Problem
The need to process Big Data Real-Time streams is becoming an increasing need for many businesses. Customers in numerous industries are seeking to harness the power of real-time big data to unlock valuable insights. They are seeking an easy to use, flexible, reliable, and scalable solution to process and transform streams of real-time data for their IoT projects. Additionally, along with these big real time data streams come anomalies in the data. Customers in a variety of industries are interested in the concept of real time anomaly detection using machine learning algorithms and operators. How can we create and visualize a real time streaming anomaly detection service?
Solution
Azure Stream Analytics is an event-processing engine which allows examining high volumes of data streaming from devices, sensors, web sites, social media feeds, applications etc. It is easy to use and based on simple SQL query language. Additionally, it is a fully managed (Paas) offering on Azure that can run large-scale analytics jobs that are optimized for cost since users only pay for streaming units that are consumed.
Azure Stream Analytics now offers built in machine learning based anomaly detection capabilities to monitor temporary and persistent anomalies. This anomaly detection capability coupled with Power BI’s real time streaming service makes for a powerful real-time anomaly detection service. In this article, I will demonstrate a practical example of how to create real time anomaly detection using Azure Stream Analytics for processing the stream and Power BI for visualizing the data.
Prerequisites
To begin implementing this solution, we will need a few resources to be created and running.
- Stream Analytics: Check out “What is Azure Stream Analytics?” for more detail.
- IoT Hub: Check out “What is Azure IoT Hub?” for more detail.
- Power BI Premium Service: This article, titled “What is Power BI Premium?” introduces key features in Power BI Premium.
- Device Details Simulator: The DeviceSimulator is used to simulate anomalies being sent from a device to IoT Hub. The schema uses temperature and a sensor ID. These events can then be consumed by an Azure Stream Analytics job configured to read from this IoT Hub. (Source)
Create an Azure Stream Analytics Job
Let’s begin by creating a new Stream Analytics Job in the Azure Portal.

I will name my job and click create.

Create an IoT Hub
While my Stream Analytics Job is spinning up, I will create an IoT Hub as well.
IoT Hub is a managed service that is hosted in the cloud and acts as a central message hub for bi-directional communication between IoT applications and the devices it manages. An IoT Hub is essentially an Event Hub with additional features including per-device identity, cloud to device messaging and several additional features that can be reviewed and considered in Microsoft’s article Connecting IoT Devices to Azure: IoT Hub and Event Hubs.

In the Basics Tab, give your IoT Hub a Name and ensure that the Subscription, Resource Group and Region are configured correctly.

There is also an option to Size and Scale the IoT Hub as needed:

After selecting the tier, Review the selections and then click Create to deploy the IoT Resource:

Once the IoT resource is deployed, navigate to the IoT Hub and then click New from under the IoT Hub navigation menu:

Then add a Device ID and click Save.

Once the device is added, Click the device to open the device details:
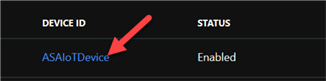
Next, copy the connection string (primary key) which will be used as the connection for the IoT Device.

Download the Device Simulator
The DeviceSimulator is used to simulate anomalies being sent from a device to IoT Hub. The schema uses temperature and a sensor ID. These events can then be consumed by an Azure Stream Analytics job configured to read from this IoT Hub.
For more information on the DeviceSimulator and to download, visit Device Simulator on Github.
Once the DeviceSimulator is downloaded, open the visual studio solution file and run the simulator.

Note the various setting available in the device simulator.
Review the readme.md GitHub file to understand the various configuration and settings available.
For example, Mock Mode is a method of experimenting with the simulator and various anomaly patterns without sending data to a live IoT Hub.
When we have the available IoT Namespace, device ID and device key, we will enter it in the IoT Hub Config section prior to running the simulator to ensure messages and data are sent to the IoT Device.

Create a Stream Analytics Job
A Stream Analytics job comprised of an Input, a Query, and an Output will need to be defined and running in order to take the IoT Hub Device input, process it using the query and output it to a Power BI Real time streaming dashboard.
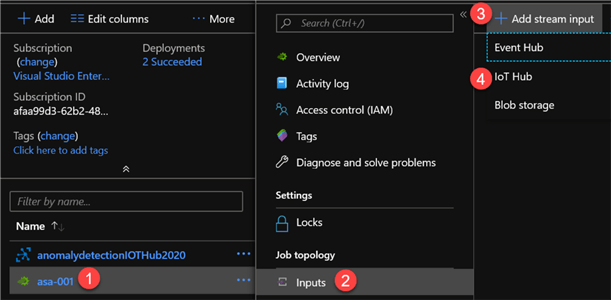
Add Stream Input
I’ll start by adding an IoT Hub stream input.
Next, I will configure the input stream details.

Lastly, I will see that the IoTHub Source Stream has been created.

Add Stream Output
Similarly, I will also add an Output Stream.

Next, I will authorize Power BI to access the stream analytics job.

This will prompt me to enter my Azure Portal credential and then click next.

I will then give my name my dataset and table along with setting the authentication mode to ‘User Token’ since I am in dev/demo mode.
Also available is Managed Identity mode. For more information, check out Use Managed Identity to authenticate your Azure Stream Analytics job to Power BI
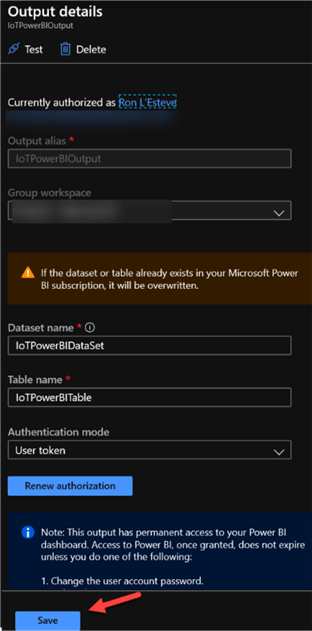
Lastly, I will see that the IoTPowerBIOutput Sink Stream has been created.

Write the Stream Analytics Query
My final piece to creating the Stream Analytics Job will be to write my SQL Query for my Anomaly Detection. In this scenario, I will be using the Spike and Dip Function.
Check out Anomaly detection in Azure Stream Analytics for more detail on machine learning based anomaly detection operators such as Spike and dip or Change Point.

WITH AnomalyDetectionStep AS
(
    SELECT
        EVENTENQUEUEDUTCTIME AS time,
        CAST(temperature AS float) AS temp,
        AnomalyDetection_SpikeAndDip(CAST(temperature AS float), 95, 120, 'spikesanddips')
            OVER(LIMIT DURATION(second, 120)) AS SpikeAndDipScores
    FROM IoTHub
)
SELECT
    time,
    temp,
    CAST(GetRecordPropertyValue(SpikeAndDipScores, 'Score') AS float) AS
    SpikeAndDipScore,
    CAST(GetRecordPropertyValue(SpikeAndDipScores, 'IsAnomaly') AS bigint) AS
    IsSpikeAndDipAnomaly
INTO IoTPowerBIOutput
FROM AnomalyDetectionStep
Start the Stream Analytics Job
Now that I have configured all components of my job, I can Start the job.


Create a Real-Time Power BI Dashboard
Once the job is running, I am ready to head over to Power BI to begin building my real time dashboard.
Create a Dataset
I’ll start by navigating to my workspace containing my IoTPoweBIDataSet in the datasets section. Note that the Stream Analytics Job must be running and must have processed at least 1 event for the dataset to be created.

Create a Dashboard
Now that I have verified that my dataset was created, I will create a new Dashboard.


Add a Tile
I will then add a tile for my Real-time custom streaming data.

I’ll then select my dataset.

I will add a Card visualization to track the count of spike and dip anomalies.

I will also add a line chart visualization to track the spike and dip scores.

Run the Device Simulator
Now that I have finally configured all of my resource, I am ready to head back to my DeviceSimulator and configure the IoT Hub Details.
Once the details are configured, I will click ‘Update IoT Hub Config.

I will then select Anomaly settings for Normal Events and start the DeviceSimulator.

Monitor Real-Time Power BI Streaming
Once my device has been started, I can head back to my Power BI Dashboard to begin monitoring my stream.
As we can see, streaming details and now available on my Power BI Dashboard. Note also how the SpikeandDip Anomalies Card is still 0 since we are currently only streaming Normal events.

I will then head back to my simulator and change the Anomaly settings to Spike/Dip and will have it repeat every 2 seconds. As I can see, the anomalies have begun in the simulator.

When I head back to my real time Power Bi dashboard, I can see that the Spike and Dip anomalies have begun flowing into the dashboard and the SpikeandDip Anomalies Card is beginning to display the incoming anomalies.

There are a few additional anomaly settings in the DeviceSimulator that could be explored as a next step.

Once I complete my tests, I will ensure that I head back to the Azure Portal and stop my Stream Analytics Job and Device Simulator as well.

Next Steps
- For more detail on creating a Stream Analytics Power BI Dashboard, check out Stream Analytics and Power BI: A real-time analytics dashboard for streaming data.
- Read more detail on Azure Stream Analytics AnomalyDetection_SpikeAndDip function.
- Check out other Anomaly detection functions in Azure Stream Analytics.
- For more detail related to time-streaming scenarios and using windowing functions, check out Microsoft’s article: Introduction to Stream Analytics windowing functions.
- For additional device simulator options, check out the Raspberry Pi Web Simulator on GitHub.

Ron C. L’Esteve is a Data and AI Leader and professional Author residing in Chicago, IL, USA. He is well-known for his impactful books and article publications on Azure Data & AI Architecture, Engineering, and Leadership. Ron holds a Master of Business Administration (M.B.A.) and Master of Science in Corporate Finance (M.S.F.) from Loyola University Chicago. Ron possesses deep technical skills and experience in designing, implementing, leading, and delivering modern Azure Data & AI projects for numerous clients around the world. He is a Motorola Certified Six Sigma Green Belt, a Microsoft Global Challenger, and also holds numerous additional Microsoft, Snowflake, and Databricks professional certifications in Big Data Engineering, Artificial Intelligence, Apache Spark and Data Platform Architecture.
- MSSQLTips Awards: Champion (100+ tips) – 2023 | Author of the Year – 2020-2021 | Rookie of the Year – 2019