Problem
Many companies adopt a tree-like organizational structure. An employee reports to another employee, who in turn reports to still another employee. Because each employee refers to another in an enterprise data model, this kind of relationship exhibits a recursive hierarchy. A reporting system usually allows employees to access their data. Employees at high levels in the hierarchy can access data associated with their direct and indirect subordinates, i.e., they can look down. This reporting system can serve two purposes: one is to summarize data associated with all employees of a given superior. The other is to restrict employees from accessing data that does not relate to their responsibilities. Additionally, some employees, such as marketing specialists, need to access other employees’ data even though they are not supervisors of these employees. How can we design SSRS reports that allow people to access data associated with employees at a particular hierarchy level and below?
Solution
We use the hierarchyid, a built-in SQL server data type [1][2][3], to create a table with the employee report-to hierarchical structure. A value of the hierarchyid represents the position of an employee in the hierarchy. Therefore, given an employee, we can find a list of employees at or below the position of the employee; this employee can access all data associated with these employees. We use this row-level security strategy to determine what data an employee can access. To improve the user experience of reports, we create a recursive hierarchy group in SSRS to organize data so that report users can initially view summary information at the high-level, then drill down through the summary to get to further detail [4].
Having some idea of recursive hierarchies helps comprehend the techniques used in this tip. After briefly introducing recursive hierarchies, we provide a step-by-step procedure to create a ready-to-use report shown in Figure 1. Report users select a year from the parameter dropdown list and, then, click on the "View Report" button to access data in the report.
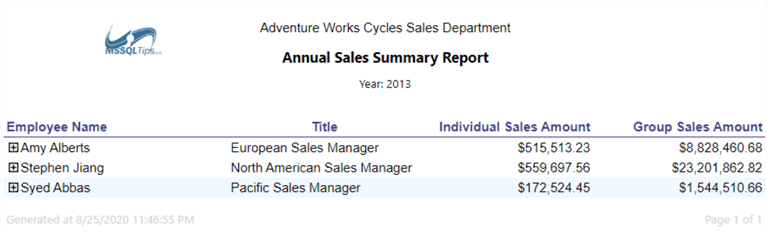
Figure 1 Adventure Works Sales Summary Report
The plus signs beside employee names indicate these employees have subordinates. Clicking on a plus sign, we expand the corresponding drill-down group and see detailed information inside this group, as shown in Figure 2. This group may have other groups. We can continue to expand groups until there is no collapsed group inside.
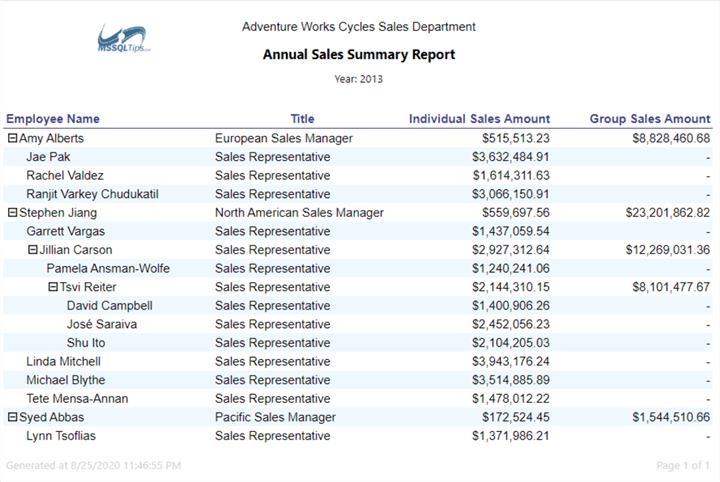
Figure 2 Interactively Expand Row Groups
We use data from the AdventureWorks sample database "AdventureWorksDW2019.bak" [5]. In practice, we gather business requirements from report users. For demonstration purposes, we make up some requirements to create the report:
- Sales managers at AdventureWorks want to have a report to list annual sales of every salesperson. The report should contain employee names, employee titles, individual sales, and group sales. When business users view the report, they select a year and see each group’s yearly amount of sales. They can drill down from a high-level group to view all employees’ data inside this group.
- The company has three sales territory groups: North America, Europe, and the Pacific. Sales representatives in each group report to their managers; in turn, these managers also report to the sales vice president. The vice president can access all sales data, and each manager can view data associated with sales representatives in his/her group. Sales representatives can see their data.
- To develop marketing strategies, David Bradley, the marketing manager, wants to access all sales data. Two other employees want to use sales data to perform marketing analysis: Mary Gibson, a marketing specialist, wants to access sales data in Europe and Pacific territory; Mary Dempsey, a marketing assistant, wants to access data in North America territory.
I organize the remaining sections of this tip as follows: In Section 1, we briefly introduce recursive hierarchies. We create two database tables in Section 2. These tables contain the hierarchyid data and role representatives. We cover a step-by-step process to build a ready-to-use report using Visual Studio 2019 in Section 3. Next, in Section 4, we explore the row-level security strategy. Section 5 verifies row-level security in a report server environment.
I created this report using Microsoft Visual Studio Community 2019 and Azure Data Studio 1.19.0 on Windows 10 Home 10.0 <X64>; I tested the report on SQL Server 2019 Reporting Services (Version 15.0.7243.37714). The DBMS is Microsoft SQL Server 2019 Developer Edition (64-bit).
1 – A Brief Introduction to Recursive Hierarchies
According to Wikipedia [6], a hierarchy defines relationships among items in a system. The hierarchy arranges items into many levels, and each item links to other items either directly or indirectly. A simple hierarchy, as shown in Figure 3, looks like an inverted tree. The elements represented by rectangles are nodes; the lines connecting elements are called branches. The tree has a root on the top. Each node in the tree may have zero or more child nodes. When a node does not have any child node, we call this node leaf node or leaf. In an employee hierarchy, a superior is a node with child nodes, and these child nodes are subordinates of the superior. When implementing row-level security, we usually grant permission to superiors to access their subordinates’ data.
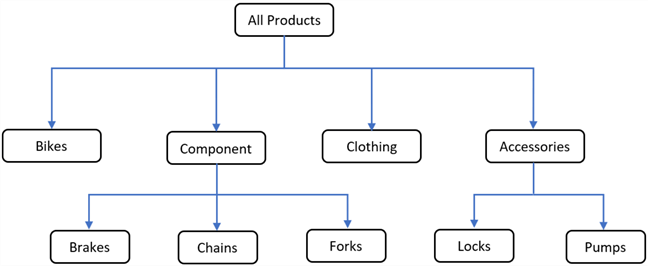
Figure 3 A Simple Product Hierarchy
From the root way down to the leaves, each level describes a product more detailed than its superior level. The hierarchy describes relationships between an entity’s attributes. Therefore, we call this kind of hierarchy an attribute hierarchy [7]. Like the SSRS report with multiple row grouping levels introduced in [8], a report naturally organizes data toward successively more detailed levels. For example, we look at the total sales revenues received from all products. We then can view subtotal sales revenues generated from each product category. We can further drill down to view sales at the product subcategory level.
Attribute hierarchies usually have a fixed number of levels, i.e., they are balanced hierarchies. However, the categories "Bikes" and "Clothing" shown in Figure 3 do not have any subcategories. We call this kind of hierarchy an unbalanced hierarchy or a variable-depth hierarchy. Suppose this structure causes an issue in reporting. In that case, we can use the backfilling technique [7]. We create a "Bikes" child category under the "Bikes" category and make a "Clothing" subcategory below the "Clothing" category. Then, all branches have three levels, i.e., we obtain a balanced hierarchy.
With the simple product hierarchy, illustrated in Figure 3, we can use attributes to describe relationships. For example, the subcategory "Brakes" is within the category "Component." Figure 4 illustrates another type of relationship. We cannot use attributes to describe the hierarchy; instead, we say that one employee may report to another employee. In this hierarchy, each instance of an entity may relate to another same kind of entity. This kind of self-referring relationship depicts an instance hierarchy. This relationship is naturally recursively, and the number of levels in the hierarchy is variable.
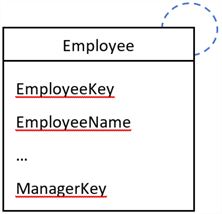
Figure 4 An Instance Hierarchy
An instance hierarchy describes relationships between instances of the same kind of entity, and the instance hierarchy is recursive. We can also use a tree-like structure to illustrate the instance hierarchy. However, the tree structure has an indefinite number of levels, and the structure may continuously change. In our everyday life, we may see four types of instance hierarchy [7]:
- Parts breakdown structure: components contain other components;
- Business unit ownership: business units are subdivisions of other business units;
- Report-to structure: employees report to other employees;
- Geographical systems: some regions are within other regions;
Reviewing the basic concepts of a recursive hierarchy enables us to strengthen our comprehension of row-level security techniques used in this solution. Even though this tip places focus on the report-to structure, we can apply these security techniques to other types of instance hierarchies. It is worth noting that these techniques only report data according to the most current hierarchies. We do not manage historical records. For example, when a company promotes a sales representative to be a regional sales manager in 2020, the new manager can access all subordinates’ data before 2020. If we do not expect the manager to access data that occurred in past years, we can adopt a slowly changing dimension (SCD2) technique to store current and historical data. Book [7] explores two methods to handle recursive hierarchies and explain the ripple effect.
2 – Prepare for Row-level Security
We can set up a report server using the default setting if all clients and the SSRS are in the same domain. When users access reports through the web portal, the web portal passes their domain account information to the report server [9]. We use the expression "User!UserID" to access this information. In order to use domain account information to filter the data, we should establish some connections between data and user domain accounts.
2.1 The Report-to Structure in the Sales Department
The salesperson’s report-to structure in the sample database–AdventureWorksDW2019–has three levels: Sales Representative -> Sales Manager -> Vice President of Sales. Most recursive hierarchies are more complicated than this structure. To ensure the solution can work for general recursive hierarchies, we add two more levels to the salesperson’s report-to structure:
UPDATE [dbo].[DimEmployee]
SET [ParentEmployeeKey] = 283
WHERE [EmployeeKey] in (285, 286)

UPDATE [dbo].[DimEmployee]
SET [ParentEmployeeKey] = 285
WHERE [EmployeeKey] in (287, 288,289)

/* Rollback changes */
--UPDATE [dbo].[DimEmployee]
--SET [ParentEmployeeKey] = 272
--WHERE [EmployeeKey] in (285, 286, 287, 288,289)
After the change, the tree-like report-to structure should look like Figure 5. Each row on the report represents an employee. The individual sales amount column displays the employee’s annual sales; the group sales amount column shows the total sales amount from all his/her subordinates, including the employee.
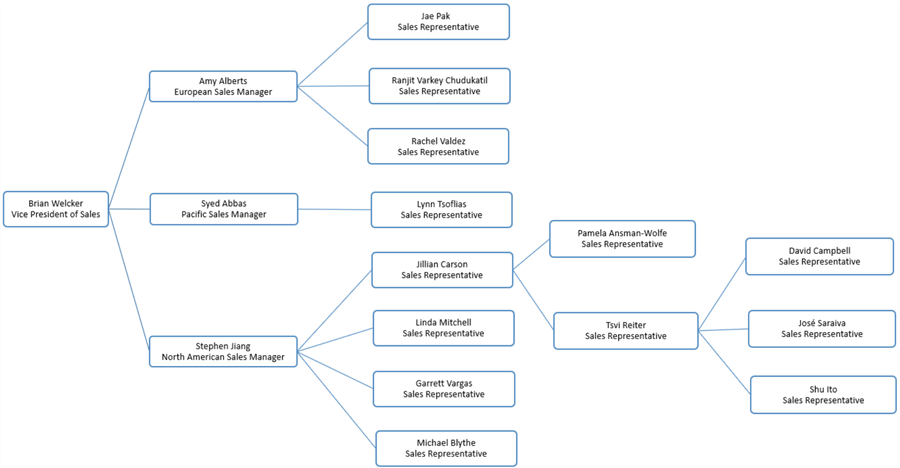
Figure 5 The Report-to Structure in the Sales Department
2.2 The Conceptual Data Model for Row-level Security
Although we recommend star schemas in dimensional modeling, we create an outrigger table to store employee hierarchies in this tip. Some employees may represent other roles to access data. We store this information in a factless fact table, which acts as an intermediate fact table. The conceptual model of these two tables should look like Figure 6. We want to separate the row-level security implementation form other BI processes so that this implementation does not require changes in other processes. Since some call outrigger tables outrigger dimensions, we follow the dimension table name conventions in the sample database to name the outrigger table.
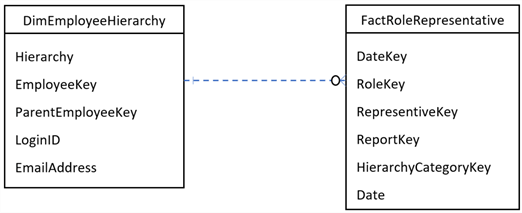
Figure 6 The Conceptual Model for Row-level Security
This design aims to find the hierarchy, i.e., a hierarchyid, of an employee ID. The employee ID could be an employee key, domain account, or email address. Power BI may use the email address to identify report users. If the employee ID is in the factless fact table, we find the role ID that the employee wants to represent. We then go to the outrigger table to find the hierarchy. If the employee ID is not in the factless fact table, the outrigger table can directly provide the hierarchy based on the employee ID. A company may have many reports and different hierarchies; we use Report Key and Hierarchy Category Key in the fact table to differentiate different situations. For the sake of simplicity, we default these two values to 1.
2.3 Implement the Employee Hierarchy Model
We use the following T-SQL script to create the outrigger dimension table and load data from the "DimEmployee" table to the new table. We can place this loading process after ETL completes loading data into the "DimEmployee" dimension.
/**
Create an outrigger dimension table store employee hierarchy
**/
IF OBJECT_ID('DimEmployeeHierarchy') IS NOT NULL
BEGIN
    DROP TABLE DimEmployeeHierarchy
END;
GO
CREATE TABLE [dbo].[DimEmployeeHierarchy](
[Hierarchy][hierarchyid]NOT NULL,-- Hierarchyid data type
[EmployeeKey][int]NOT NULL,
[ParentEmployeeKey][int]NULL,
[LoginID][nvarchar](256) NOT NULL,
[EmailAddress][nvarchar](50)NOT NULL,-- For Power BI Row-Level Security
CONSTRAINT [PK_DimEmployeeHierarchy] PRIMARY KEY CLUSTERED ([Hierarchy] ASC)
);
GO
/**
Load data from DimEmployee dimension to the new outrigger table [1]
**/
IF OBJECT_ID('tempdb..#Hierarchies') IS NOT NULL
BEGIN
    DROP TABLE #Hierarchies
END;
CREATE TABLE #Hierarchies
   (
    [EmployeeKey]int,
    [ParentEmployeeKey]int,
    [IndexNum]int
);
INSERT #Hierarchies (
 [EmployeeKey]
,[ParentEmployeeKey]
,[IndexNum])
SELECT[EmployeeKey]
,[ParentEmployeeKey],
ROW_NUMBER() OVER (PARTITION BY [ParentEmployeeKey] ORDER BY [ParentEmployeeKey])
FROM [dbo].[DimEmployee];
WITH HierarchyPaths(HierarchyPath, EmployeeKey)
AS (
SELECT hierarchyid::GetRoot()
,[EmployeeKey]
FROM #Hierarchies
WHERE [ParentEmployeeKey] IS NULL
UNION ALL
SELECT
CAST(p.[HierarchyPath].ToString() + CAST(h.[IndexNum] AS varchar(30)) + '/' AS hierarchyid)
,h.[EmployeeKey]
FROM #Hierarchies AS h
INNER JOIN HierarchyPaths AS p ON h.[ParentEmployeeKey] = p.[EmployeeKey]
)
INSERT INTO [dbo].[DimEmployeeHierarchy]
           ([Hierarchy]
           ,[EmployeeKey]
           ,[ParentEmployeeKey]
           ,[LoginID]
,[EmailAddress])
SELECT p.[HierarchyPath]
,p.[EmployeeKey]
,e.[ParentEmployeeKey]
,e.[LoginID]
,e.[EmailAddress]
  FROM [dbo].[DimEmployee] e
INNER JOIN HierarchyPaths p ON p.[EmployeeKey] = e.[EmployeeKey]
IF OBJECT_ID('tempdb..#Hierarchies') IS NOT NULL
BEGIN
    DROP TABLE #Hierarchies
END;
GO
SELECT TOP (10) [Hierarchy]
  ,[Hierarchy].ToString() AS  HierarchyPath
      ,[EmployeeKey]
      ,[ParentEmployeeKey]
      ,[LoginID]
      ,[EmailAddress]
  FROM [dbo].[DimEmployeeHierarchy]
The last code block in the T-SQL script reads data from the new table. The query results should look like Figure 7. The tutorial "Using the hierarchyid Data Type" [1] provided by Microsoft SQL Docs explains how to convert a table to a hierarchical structure. The hierarchy data type has a method "ToString()" that shows the hierarchyid data in a string format. The employee with the hierarchy string "/1/1/7/" reports to the employee whose hierarchy string is "/1/1/", in turn, this employee reports to another employee who has the hierarchy string "/1/". The root node has a hierarchy string "/" and all others report to the employee at the root node. Comparing these hierarchy strings, we find the superiors’ hierarchy strings always match the left part of the subordinates’ strings. Knowing this pattern helps us write an SSRS expression to filter data.
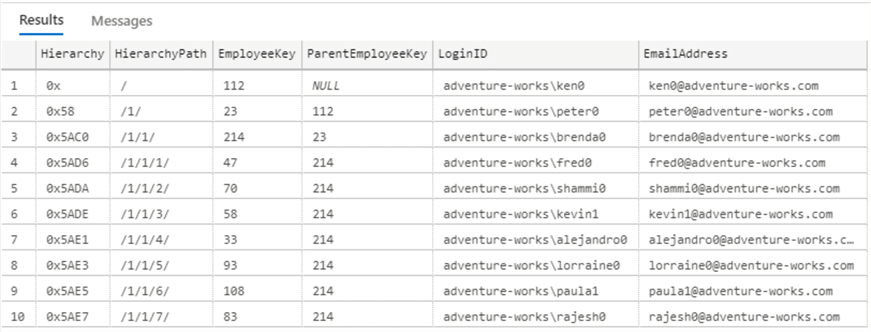
Figure 7 Sample Data in the New Table DimEmployeeHierarchy
2.4 Implement the Role Representative Model
When we grant data access permissions according to the report-to structure, there are some exceptions. David Bradley, the marketing manager, wants to access all sales data. Mary Gibson, a marketing specialist, wants to access sales data in Europe and Pacific territory. Mary Dempsey, a marketing assistant, wants to access data in North America territory. We create an intermediate fact table and insert these permission setups into this table:
/**
Create an intermediate fact table to store permission setups
**/
IF OBJECT_ID('FactRoleRepresentative') IS NOT NULL
DROP TABLE [dbo].[FactRoleRepresentative]
GO
CREATE TABLE [dbo].[FactRoleRepresentative](
[DateKey] [int]NOT NULL,
-- The role to be represented
[RoleKey] [int]NOT NULL,
       -- The employee who accesses the report
[RepresentativeKey] [int]NOT NULL,
-- Setting may vary from report to report
[ReportKey] [int]NOT NULL,
-- May have other types of hierarchies
[HierarchyCategoryKey] [int]NOT NULL,
[Date] [date] NOT NULL,
 CONSTRAINT [PK_FactRoleRepresentative] PRIMARY KEY CLUSTERED (
[DateKey] ASC,
[RoleKey] ASC,
[RepresentativeKey] ASC,
[ReportKey] ASC,
[HierarchyCategoryKey] ASC)
  )
GO
/**
Add permission data to the table
**/
INSERT INTO [dbo].[FactRoleRepresentative]
           ([DateKey]
           ,[RoleKey]
           ,[RepresentativeKey]
           ,[ReportKey]
           ,[HierarchyCategoryKey]
           ,[Date])
     VALUES
(20200820,277,8,  1,1,'2020-08-20'),
(20200820,290,109,1,1,'2020-08-20'),
(20200820,294,109,1,1,'2020-08-20'),
(20200820,272,276,1,1,'2020-08-20')
GO
/**
Check the data in the table
**/
SELECT(s.FirstName + ' ' + s.LastName)AS RepresentativeName
,(r.FirstName + ' ' + r.LastName)AS RoleName
,r.TitleAS RoleTile
FROM [dbo].[FactRoleRepresentative] f
INNER JOIN [dbo].[DimEmployee] r on r.EmployeeKey = f.RoleKey
INNER JOIN [dbo].[DimEmployee] s on s.EmployeeKey = f.RepresentativeKey
GO
The query results should look like Figure 8. Marketing employees are in the "Representative Name" column. When they access the report, they act as roles defined in the "Role Title" column. They have the same access permissions as those roles they represent.
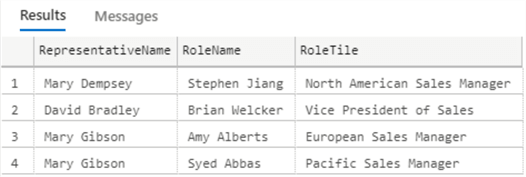
Figure 8 Grant Data Access Permission to Employees in the Marketing Department
3 – Build an SSRS Report with Recursive Hierarchy Groups
When we build a new report, a good practice is to start with a template. Not only can we maintain consistency, but we avoid repeatedly adding the header section, footer section, and logo to the report. In this tip, we use the report created in tip [8] as the template. We start with a blank report and copy the contents from the template to the new report later for demonstration purposes. In practice, we add the template to the report server project, rename the template to the actual report name and, then, put new contents into the report.
3.1 Launch a New Report Server Project
We first create a new report server project in Visual Studio 2019. Following the step-by-step procedure in tip [8], we add an empty report and a shared data source to the project. The report uses the shared data source to retrieve data from the SQL server database. The report design canvas should look like Figure 9.
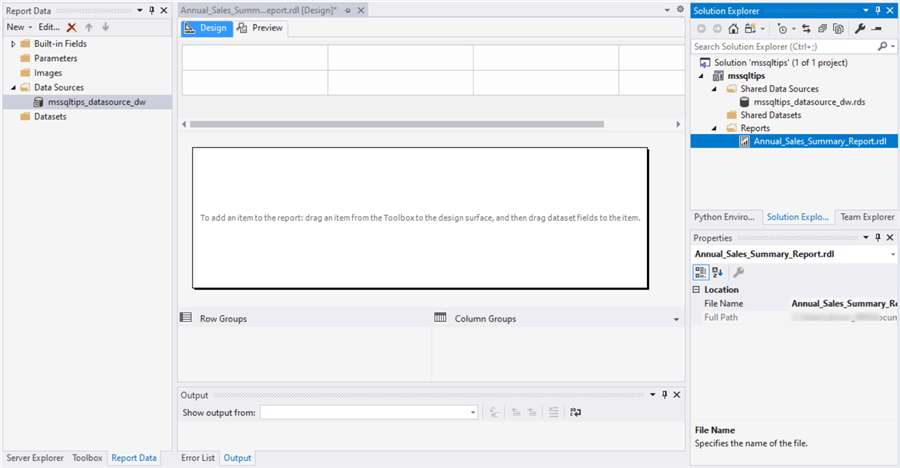
Figure 9 The Report Design Canvas
3.2 Add Datasets to the New Report
Based on the business requirements, we should retrieve the following data into the report: employee name, employee title, and sales amount. To create recursive groups in SSRS, we load employee key and parent employee key from the data source. We also extract the employee hierarchy path to the report for filtering a dataset. The following stored procedure serves this purpose:
CREATE PROCEDURE [dbo].[uspGetAnnualSales]
   @Year int
AS
BEGIN
   BEGIN TRY
        SELECT h.[EmployeeKey]
              ,h.[ParentEmployeeKey]
              ,h.[Hierarchy].ToString()                       AS HierarchyPath
              ,CONCAT(e.[FirstName],SPACE(1),e.[LastName])    AS EmployeeName
              ,e.Title
              ,sum(f.[SalesAmount])                           AS SalesAmount
          FROM [dbo].[FactResellerSales] f
              INNER JOIN [dbo].[DimEmployee] e ON f.EmployeeKey = e.EmployeeKey
              INNER JOIN [dbo].[DimEmployeeHierarchy] h ON f.EmployeeKey = h.EmployeeKey
        WHERE YEAR([OrderDate]) = @Year
        GROUP BY
               h.[EmployeeKey]
              ,h.[ParentEmployeeKey]
              ,h.[Hierarchy].ToString()
              ,CONCAT(e.[FirstName],SPACE(1),e.[LastName])
              ,e.Title
   END TRY
   BEGIN CATCH
        DECLARE @ErrorMessage NVARCHAR(4000);
        DECLARE @ErrorSeverity INT;
        DECLARE @ErrorState INT;
        SELECT @ErrorMessage = ERROR_MESSAGE(),
                @ErrorSeverity = ERROR_SEVERITY(),
                @ErrorState = ERROR_STATE();
        RAISERROR (@ErrorMessage, @ErrorSeverity, @ErrorState );
        RETURN 1
    END CATCH
    RETURN 0
END
GO
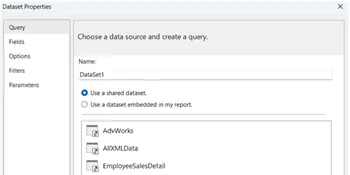
On the "Report Data" pane, there is a folder called "Datasets." Right-click on the folder. Select the "Add Dataset" menu item to bring up the "Dataset Properties" dialog. On the dialog, choose "Use a dataset embedded in my report" and select the data source we added. When we select "Stored Procedure" as query type, we can select the new stored procedure "uspGetAnnualSales" from the pull-down list. The dataset uses the same name as the stored procedure name. When we have multiple datasets in the report, this naming convention helps us quickly identify the data source. The dialog should look like Figure 10.
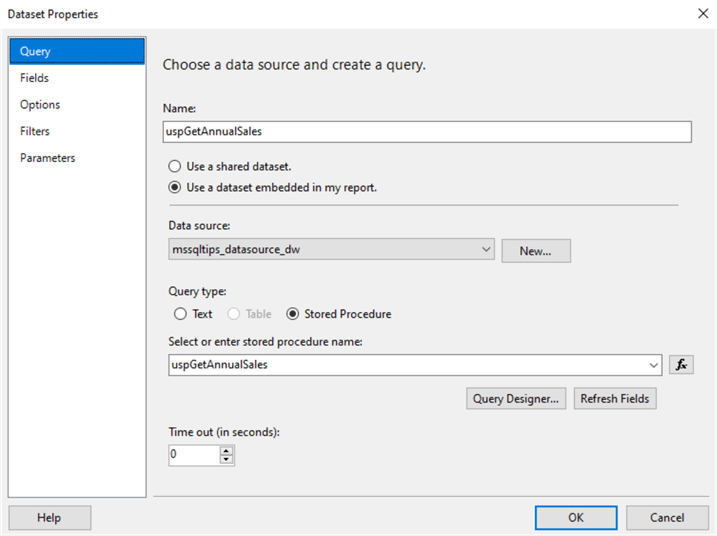
Figure 10 Configure the Dataset Properties
Click on the "OK" button to close the dialog. On the "Report Data," we observe the new parameter "Year," and the dataset with a list of fields, as shown in Figure 11.
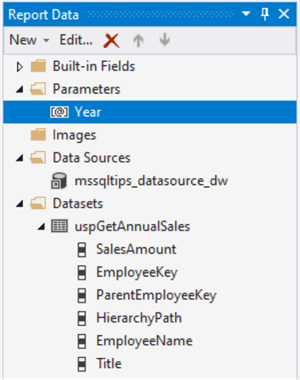
Figure 11 The New Parameter and Dataset in the Report
3.3 Get the Parameter Values from a Query
In Visual Studio 2019 Report Designer, we can quickly view a report in the Preview mode. When we switch to the Preview mode, the report asks us to enter a value of the parameter "Year" in a textbox. To improve the user experience, we want to provide a list of years for selection. Since other reports may also use this list, and this list does not frequently change, we create a shared dataset. Multiple reports can use the shared dataset. If the query runs frequently and causes a performance issue, we can cache the shared dataset [10]. To retrieve a list of years from the database, we create the following stored procedure:
CREATE PROCEDURE [dbo].[uspGetResellerSalesYears]
AS
BEGIN
   BEGIN TRY
    WITH Year_CTE([YEAR])
    AS
    (
SELECT DISTINCT [OrderDateKey]/10000 AS [Year]
FROM [dbo].[FactResellerSales]
)
SELECT [YEAR]
FROM Year_CTE
ORDER BY [YEAR] DESC
   END TRY
   BEGIN CATCH
        DECLARE @ErrorMessage NVARCHAR(4000);
        DECLARE @ErrorSeverity INT;
        DECLARE @ErrorState INT;
        SELECT  @ErrorMessage = ERROR_MESSAGE(),
                @ErrorSeverity = ERROR_SEVERITY(),
                @ErrorState = ERROR_STATE();
        RAISERROR (@ErrorMessage, @ErrorSeverity, @ErrorState );
        RETURN 1
    END CATCH
    RETURN 0
END
GO
Go to the "Solution Explorer" pane, right-click on the "Shared Datasets" folder and choose "Add New Datasets" from the context menu. The "Shared Dataset Properties" dialog appears. Select the shared data source on the dialog; choose the new stored procedure "uspGetResellerSalesYears" from the pull-down list. We use the stored procedure name as the shared dataset name. The dialog should look like Figure 12.
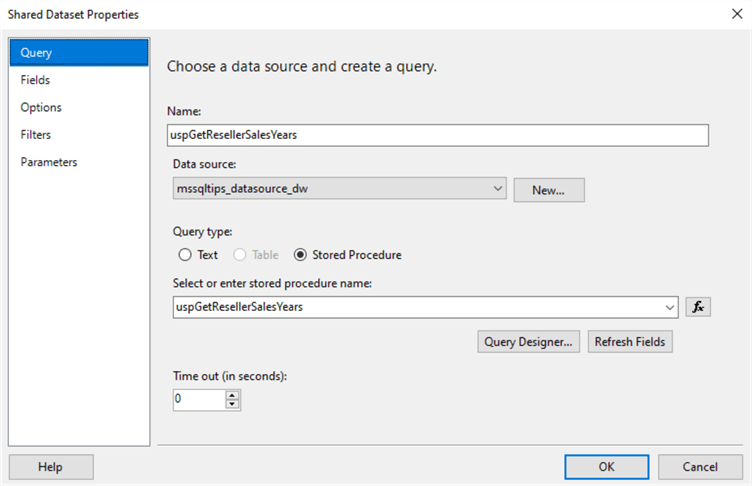
Figure 12 Configure the Dataset Properties
Click on the "OK" button on the dialog to close the dialog. The shared dataset should appear in the "Shared Datasets" folder. Go to the "Report Data" pane. Right-click on the "Dataset" folder and choose "Add Dataset" from the context menu to bring up the "Dataset Properties" dialog. We configure the dataset properties based on Figure 13.
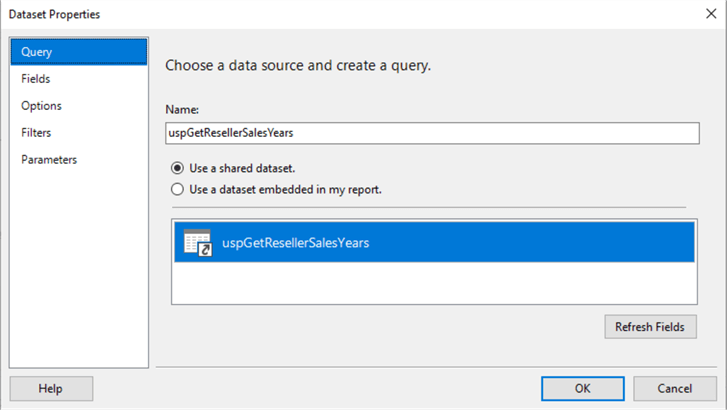
Figure 13 Add the Shared Dataset to the Report
On the same pane, right-click on the "Year" parameter and select the "Parameter Properties" from the context menu. The "Report Parameter Properties" dialog appears. We change to the value in the "Prompt" textbox to "Select a year to view," as exhibited in Figure 14.
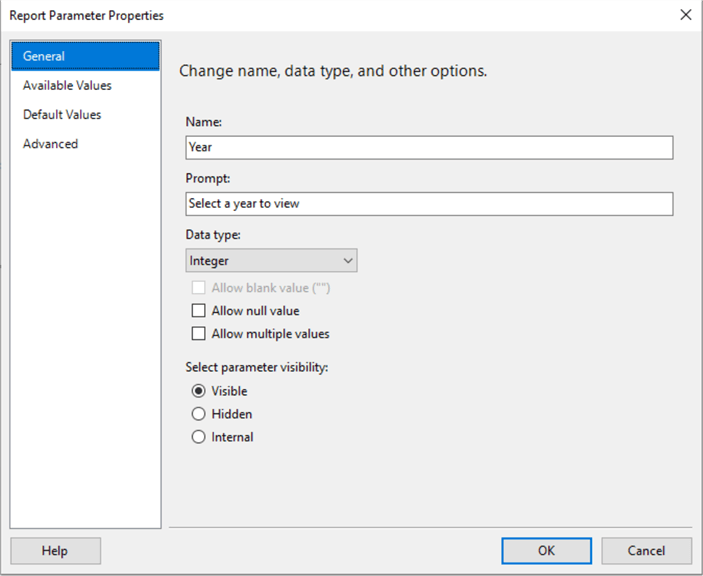
Figure 14 Change Prompt in the General Tab
Switch to the "Available Values" tab. Select "Get values from a query." We choose other options based on Figure 15.
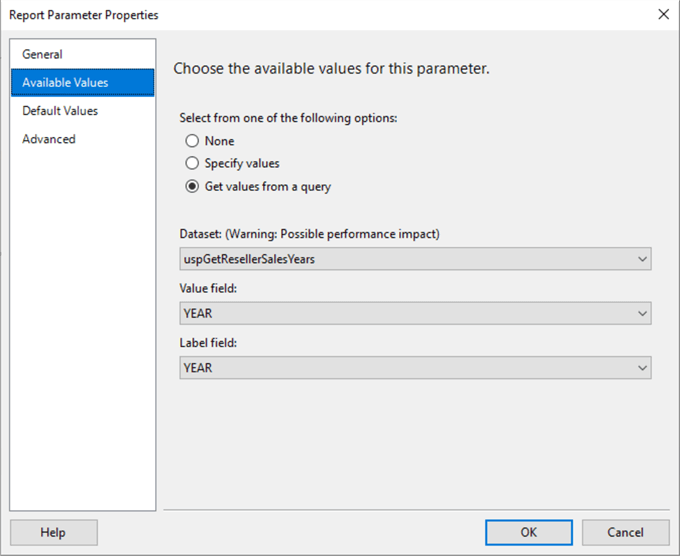
Figure 15 Choose the Available Values for the Parameter
Click on the "OK" button to close the dialog. Switch to the "Preview" tab. As shown in Figure 16, we can select a value for the year parameter.

Figure 16 Preview the Parameter Value List
3.4 Use the Tablix Data Region to Organize Data into Rows and Columns
On the "Toolbox" pane, select the "Table" item. We either double-click on the item or drag it to add the item to the report design canvas. By default, the table has three columns and two rows. Since our report should include employee names, employee titles, individual sales dollar amounts, and group sales dollar amounts, we need to add one more column to the table.
When we click on any area inside the table, two grey bars appear to the table’s left and top. We right-click on the grey bar on the top of the right column. The context menu appears, as illustrated in Figure 17. Select the "Insert Column -> Right" menu item to add a new column.
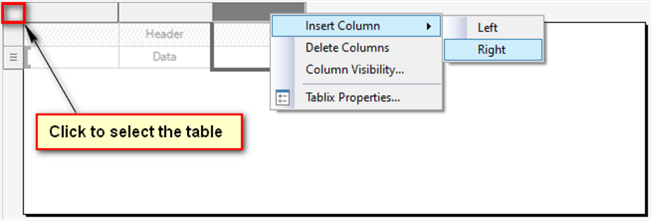
Figure 17 Add a New Column to the Table
Click on any area inside the table again. When gray bars appear, click on the top-left grey square, shown in Figure 17, to select the table. Go to the "Properties" pane to configure the Tablix properties according to Table 1.
| Property | New Value |
|---|---|
| Name | tbl_Annual_Sales |
| DataSetName | uspGetAnnualSales |
| Location: Left | 0.05in |
| Location: Top | 0.05in |
| RepeatColumnHeaders | True |
Table 1 Configure the Tablix Properties
When we move the cursor over a data cell in the second row, an icon representing the field selector appears. Clicking on the icon, we see a list of fields in the dataset. According to Figure 18, we add three fields to the table. When we add fields, the Report Designer automatically adds column headers into the first row. Next, we change the column title "Sales Amount" to "Individual Sales Amount." Then, we enter the column header "Group Sales Amount" into the last column. We can use the mouse to move the column borders to change the column width.
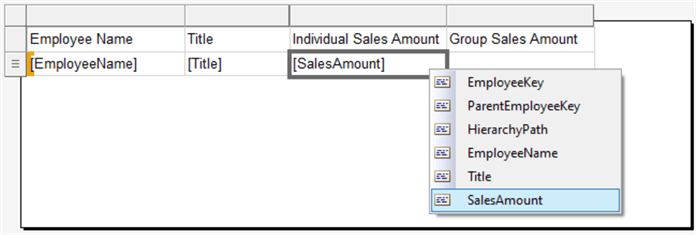
Figure 18 Add Fields to the Table
Switch the Report Designer to the Preview mode. We then select the year 2013 from the dropdown list and click on the "View Report" button. The report should look like Figure 19.
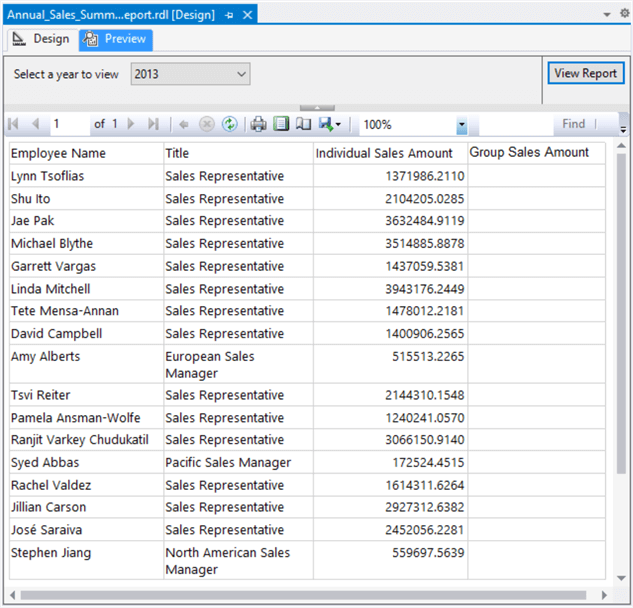
Figure 19 View the Report in the Preview Mode
3.5 Create a Recursive Hierarchy Group in SSRS
To compute the total sales amount below a certain level (including the level) in the hierarchy, we can use recursive techniques. We categorize an employee and his/her subordinates into an employee group named by the employee name. An employee who does not have any subordinate is a group member. According to the requirements, users want to view the total sales amount of a group. They can then drill down through the group to get to the detail. Each group may contain group members and employee groups. Each employee group, in turn, may contain group members and other employee groups. We use the recursive grouping feature in SSRS to implement this task.
On the group pane, as shown in Figure 20, right-click on the "(Details)." Navigate to the menu item "Group Properties…" from the context menu.
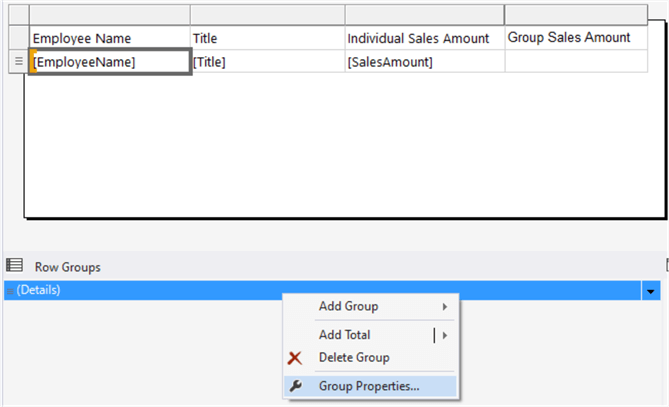
Figure 20 Access Group Properties
Select the menu item "Group Properties…" to bring up the "Group Properties" dialog. In the "Group expressions" section, click on the "Add" button and select "EmployeeKey" from the "Group on" dropdown list, as shown in Figure 21.
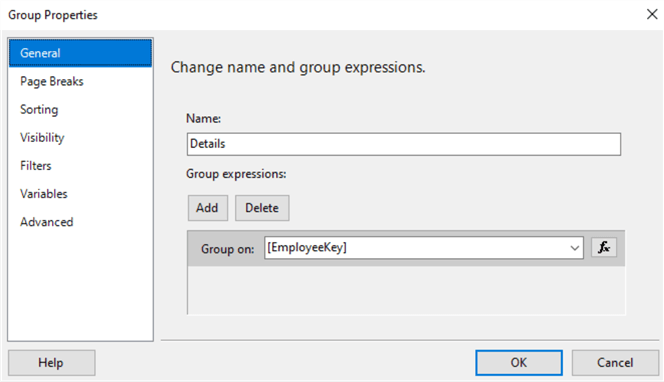
Figure 21 The Group Properties Dialog
Go to the "Sorting" tab and click on the "Add" button. As shown in Figure 22, we select the "EmployeeName" field from the "Sort by" dropdown list.
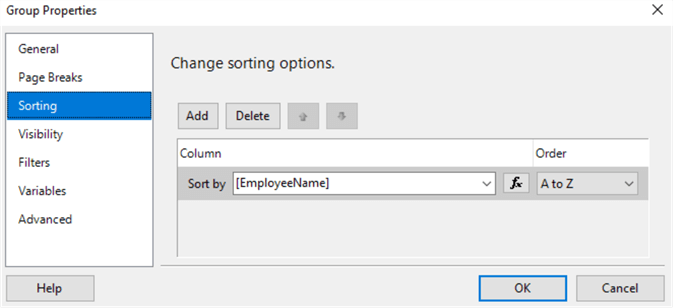
Figure 22 Change Sorting Options
When users access the report, we want to show them summary information. Then, they can drill down through the summary to get to further detail. To achieve this, we go to the "Visibility" tab and choose the "Hide" option when the report is initially run. We then check the "Display can be toggled by this report item" checkbox. As shown in Figure 23, we select "EmployeeName" from the dropdown list.
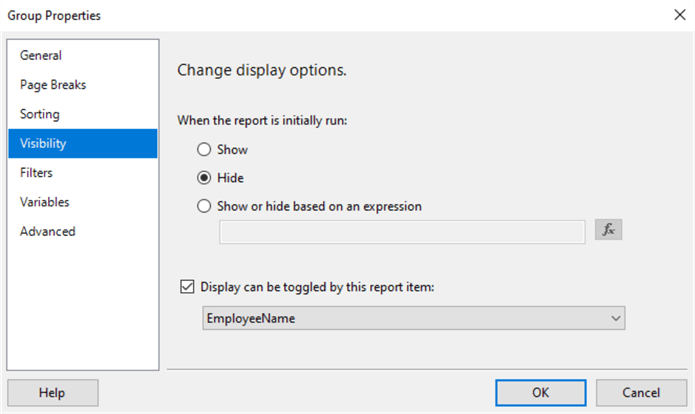
Figure 23 Change Display Options
On the same dialog, we switch to the "Advanced" tab and choose the field "ParentEmployKey" from the "Recursive parent" dropdown list, as shown in Figure 24.
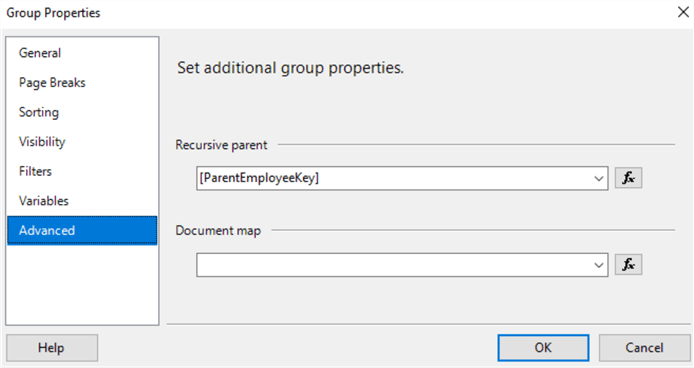
Figure 24 Set Recursive Parent
Click on the "OK" button to close the dialog. Go to the report design canvas. We want values in the last columns to display the total sales amount of an employee group. If an employee does not have any subordinates, we display the hyphen "-" in the cell to improve readability. We use the following expression to compute the value for the last column:
=IIF(Count(Fields!EmployeeName.Value,"Details",Recursive) > 1, Sum(Fields!SalesAmount.Value,"Details",Recursive),"-")
Copy the expression to the data cell in the last column. View the report in the Preview mode. The SSRS allows us to expand or collapse groups interactively. The report should look like Figure 25.
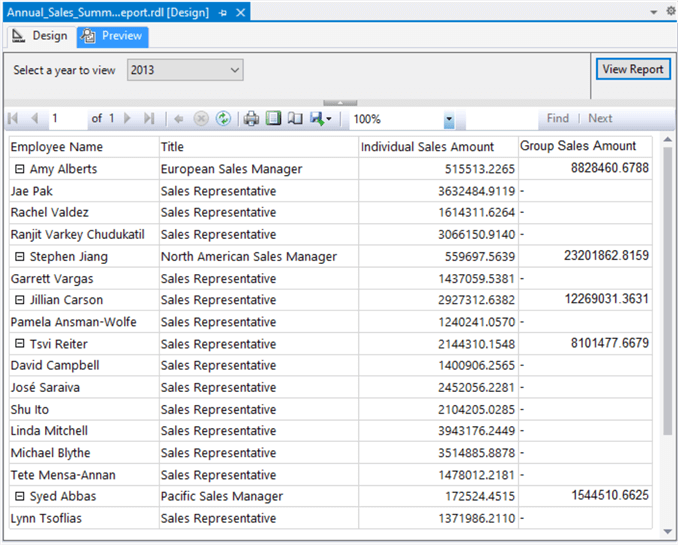
Figure 25 Run the Report in Preview Mode
3.6 Decorate the Report
To present the report to business users, we want the report to be clear and concise. Additionally, we can save the report into a PDF file and print the PDF document on a letter-sized page.
3.6.1 Design the Tablix
Go to the "Design" tab on the report designer. Select the first row in the table by clicking the grey bar on the left. We can access the row properties in the "Properties" pane. We change some properties of this header row based on Table 2. When we update Font properties, we may not change the font size or font-weight of the entire header. If we face this issue, we can change the properties for each textbox.
| Property | New Value |
|---|---|
| BorderColor: Default | Black |
| BorderColor: Bottom | DarkSlateBlue |
| BorderStyle: Default | None |
| BorderStyle: Bottom | Solid |
| Color | DarkSlateBlue |
| Font: Family | Arial |
| Font: FontSize | 9pt |
| Font: FontWeight | Bold |
Table 2 Configure the Table Header Properties
We then select the second row, i.e., the data row, and change the row properties according to Table 3. If we cannot change the font properties for the entire row, we should access each textbox and change Font properties.
| Property | New Value |
|---|---|
| BorderColor: Default | Black |
| BorderStyle: Default | None |
| Font: Family | Arial |
| Font: FontSize | 9pt |
| Fill: BackgroundColor | =iif(RowNumber("tbl_Annual_Sales") Mod 2, "White", "AliceBlue") |
Table 3 Change the Data Row Properties
To set the width and height of a cell, we configure the size of its contained textbox. We change these textbox properties according to Table 4.
| Row No | Textbox | Size | Text Alignment |
|---|---|---|---|
| 1 | Employee Name | 2.15in, 0.19in | Left |
| 1 | Title | 1.85in, 0.19in | Center |
| 1 | Individual Sales Amount | 1.65in, 0.19in | Right |
| 1 | Group Sales Amount | 1.65in, 0.19in | Right |
| 2 | [EmployeeName] | 2.15in, 0.19in | Left |
| 2 | [Title] | 1.85in, 0.19in | Left |
| 2 | [SalesAmount] | 1.65in, 0.19in | Right |
| 2 | «Expr» | 1.65in, 0.19in | Right |
Table 4 Set Width, Height and Text Alignment
To differentiate the employees and their subordinates, we add padding to the employee name textbox. Select the "[EmployeeName]" textbox in the data row. Go to the "Properties" pane. Change the value of "Padding: Left" property to ‘=CSTR(2+ level()*15) + "pt"’, as shown in Figure 26.
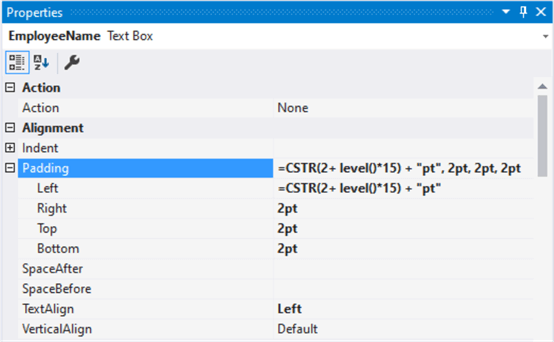
Figure 26 Configure the Textbox Padding
To improve the readability of the dollar amount, we format a number with thousand separators and round the number to two decimal places. We right-click on an empty area in the textbox "SalesAmount" in the data row. Select "Textbox Properties…" from the context menu. The "Text Box Properties" dialog appears. Switch to the "Number" tab and set the textbox properties based on Figure 27. We use the same procedure to format the expression in the "Group Sales Amount" column.
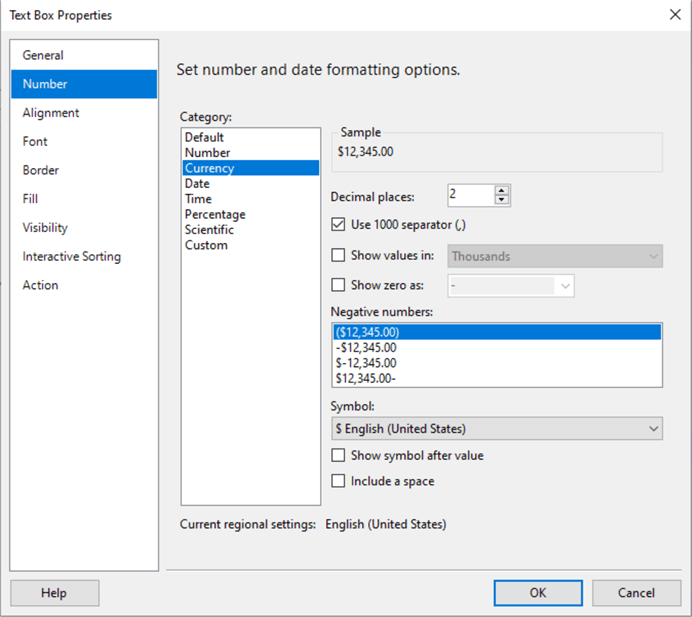
Figure 27 Set Number and Date Formatting Options
View the report in the Preview mode. The report should look like Figure 28.
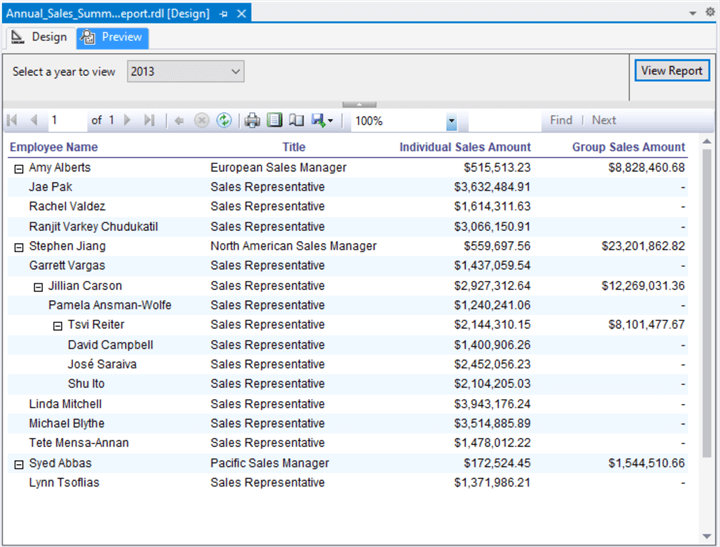
Figure 28 View the Report in the Preview Mode
3.6.2 Configure the Page Size and Report Size
From the top menu bar, we select "Extensions -> Report -> Report Properties…" to bring up the "Report Properties" dialog. We configure the report properties according to Figure 29.
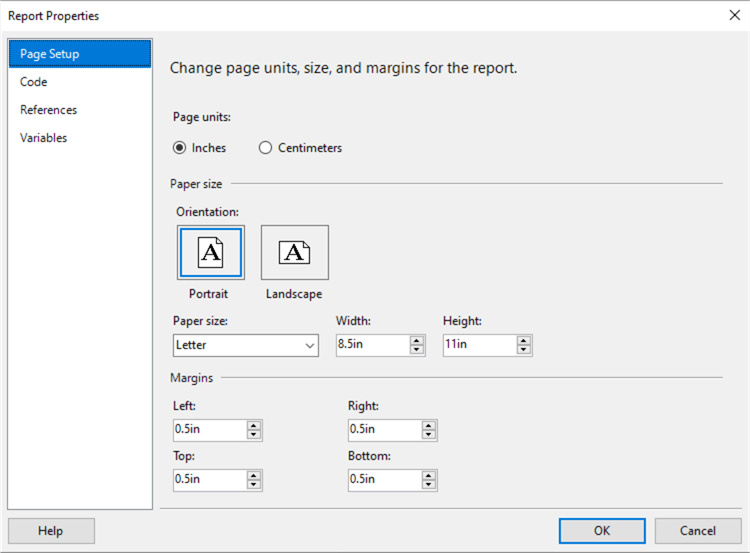
Figure 29 Change Page Units, Size and Margins for the Report
Click on any empty area in the report body. We go to the Properties pane to change the report size based on Figure 30.
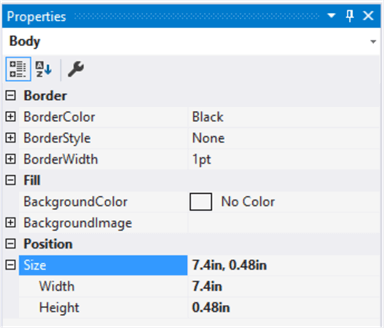
Figure 30 Change the Report Body Size
Preview the report and save the report into a PDF file. Open the PDF file. The content in the PDF file should look like Figure 31.
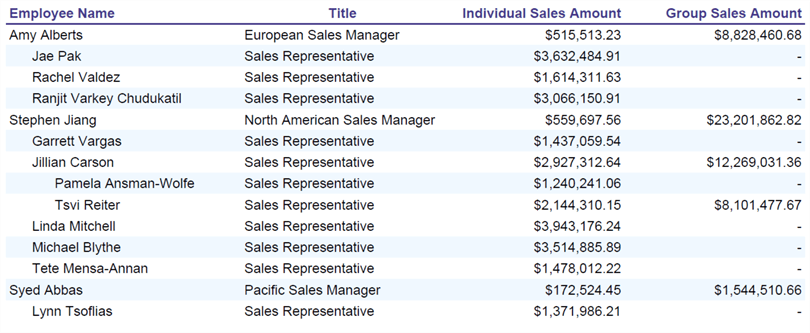
Figure 31 The Report in the PDF Format
3.6.3 Add the Header and Footer Sections
Sections 2.7 and 4 in tip [8] provide step-by-step instructions to add header, footer, and logo into a report. We follow these instructions to add these components to the report. The report on the canvas should look like Figure 32.
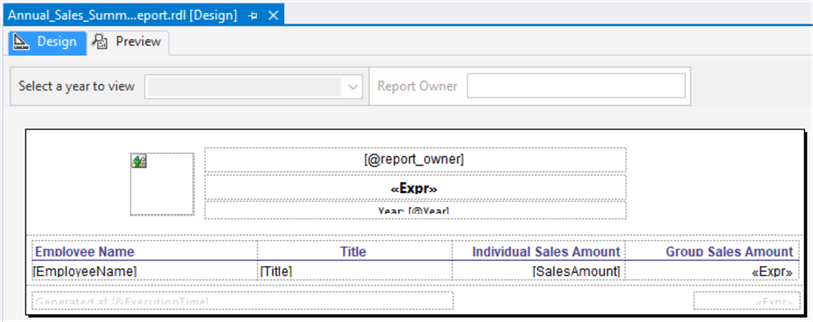
Figure 32 The Report Layout
4 – Implement Dynamic Row-level Security
In practice, users may access SSRS reports through the SSRS web portal, SharePoint, or Report Viewer Controls. To secure reports and data, we can adopt a security framework with three layers. The outer layer restricts users from logging into these report applications. The middle layer allows users only to access specific reports, and the inner layer filters report content based on a user’s role. This tip focuses on row-level security, assuming users can access reports through the web portal.
4.1 Find the Hierarchy Path Associated to the Report User
In the fact table "FactResellerSales," each row associates to an employee ID. Each employee ID corresponds to a node in the report-to tree illustrated in Figure 5. When we know the node’s position, we can find all nodes above this node. Given a row, we find the employee position. All this employee’s superiors can access this row. Let us look at an example.
Assuming the domain account we run the report is "domain\user," we use the following SQL statements to substitute Mary Gibson’s login ID (EmplyeeKey = 109) in the sample database. When we access the report, we act like Mary Gibson, a marketing specialist, representing Amy Alberts (EmployeeKey = 290), the Europe sales manager, and Syed Abbas (EmployeeKey = 294), the Pacific sales manager.
UPDATE [dbo].[DimEmployeeHierarchy]
SET [LoginID] = 'domain\user'
WHERE EmployeeKey = 109
From the outrigger dimension, we find that the hierarchy paths for Syed Abbas and Amy Alberts are "/9/1/" and "/9/2/," respectively. Their subordinates’ paths should be the concatenation of their paths and subordinates’ relative paths, such as "/9/1/1/" and "/9/2/1/." When we compare the path associated with a data row and the path associated with the login user, we can determine if the user can access the row. First, let us create a stored procedure to find hierarchy paths given an employee login ID. As presented in the example, this stored procedure may return multiple rows.
CREATE PROCEDURE [dbo].[uspGetUserHierarchyPaths]
   @LoginID nvarchar(256)
AS
BEGIN
   BEGIN TRY
DECLARE @HierarchyPath TABLE
(
HierarchyPath NVARCHAR(MAX)
)
INSERT INTO @HierarchyPath(HierarchyPath)
SELECT e.Hierarchy.ToString() AS HierarchyPath
FROM [dbo].[DimEmployeeHierarchy] e
WHERE e.EmployeeKey IN
(
SELECT ISNULL(r.RoleKey,e.EmployeeKey)
FROM [dbo].[DimEmployeeHierarchy] e
LEFT JOIN [dbo].[FactRoleRepresentative] r ON r.RepresentativeKey = e.EmployeeKey
WHERE e.[LoginID] = @LoginID
)
IF(EXISTS(SELECT 1 FROM @HierarchyPath))
SELECT HierarchyPath FROM @HierarchyPath
ELSE
SELECT 'NA' AS HierarchyPath
   END TRY
   BEGIN CATCH
        DECLARE @ErrorMessage NVARCHAR(4000);
        DECLARE @ErrorSeverity INT;
        DECLARE @ErrorState INT;
        SELECT @ErrorMessage = ERROR_MESSAGE(),
                @ErrorSeverity = ERROR_SEVERITY(),
                @ErrorState = ERROR_STATE();
        RAISERROR (@ErrorMessage, @ErrorSeverity, @ErrorState );
        RETURN 1
    END CATCH
    RETURN 0
END
We implement data access security in the SSRS report rather than in the database. Since the report should know the user’s hierarchy path, we add another dataset to the report, and the new dataset uses the new stored procedure to retrieve data. We go to the "Report Data" pane and right-click on the "Datasets" folder. In the context menu, we select "Add Dataset…" to bring up the "Dataset Properties," as shown in Figure 33.
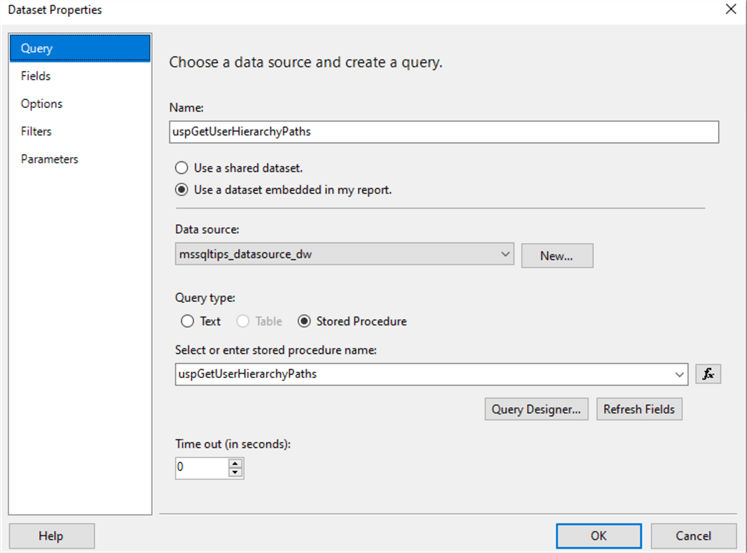
Figure 33 Add a New Dataset
On the same dialog, we switch to the Parameters tab, as shown in Figure 34. We pass the value of the built-in field "[&UserID]" to the stored procedure parameter. Click on the "OK" button to close the dialog.
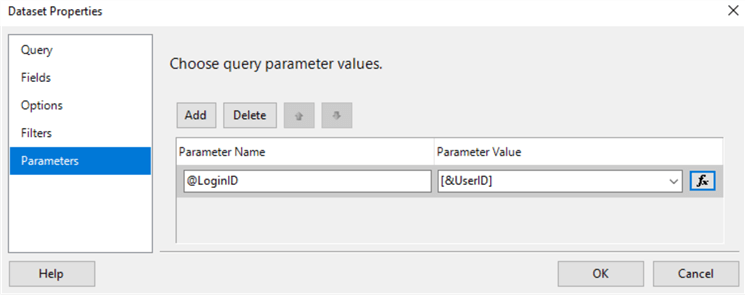
Figure 34 Pass the Built-in Field to the Stored Procedure Parameter
4.2 Store Values from a Query into the Multi-value Parameter
The dataset "uspGetUserHierarchyPaths" may have multiple rows. To enable other datasets to access this dataset’s contents, we store these multiple rows into a multi-value parameter. We go to the "Report Data" pane and right-click on the "Parameters" folder. In the context menu, we select "Add Parameter…" to bring up the "Report Parameter Properties." We configure the new parameter according to Figure 35.
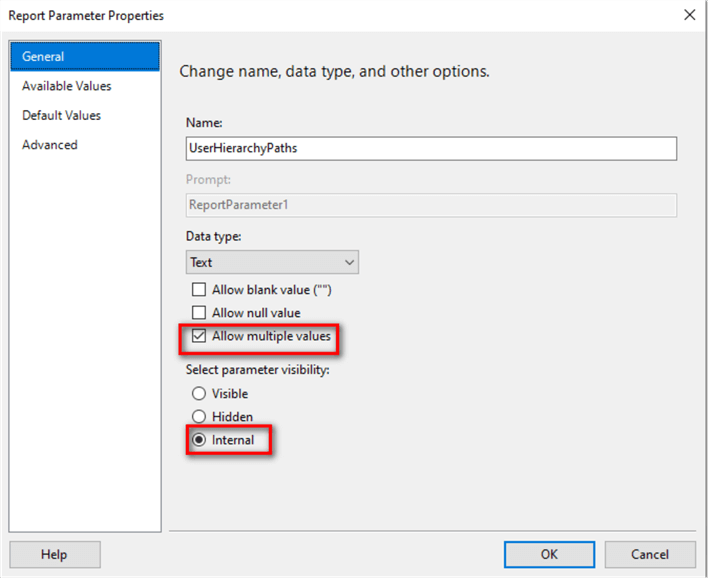
Figure 35 Create an Internal Parameter
On the same dialog, we select the "Default Values" tab and set the default values based on Figure 36.
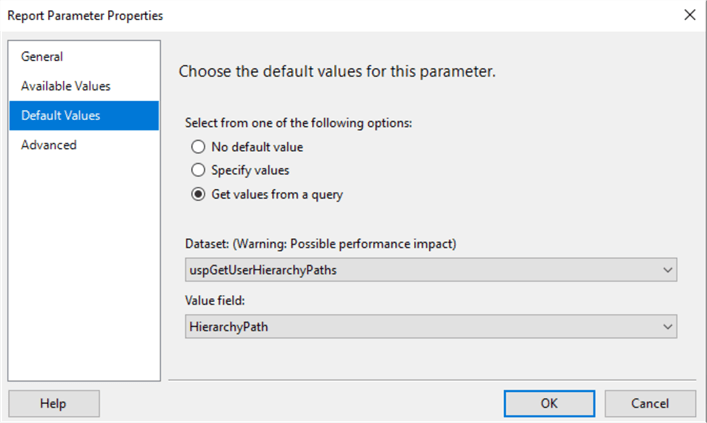
Figure 36 Set Default Values of the Internal Parameter
4.3 Filter the Dataset Based on User Hierarchy Path
We implement data access restriction in the SSRS report. This strategy can apply to other reporting applications such as Power BI. If a row corresponds to a hierarchy path that starts with the login user’s hierarchy path, the user can view the row. We write a VB function to check if a hierarchy path starts with the user’s hierarchy path. Since a representative may represent multiple roles and associate with multiple hierarchy paths, we use a loop to test each path.
Public Function PathContain(ByVal userPaths As Object(), _
    ByVal dataPath As String) As Integer
Dim rtnValue As Integer = 0
If userPaths.Length > 0 Then
For Each path As Object in userPaths
If dataPath.StartsWith(path.ToString()) Then
rtnValue = 1
End If
Next
Else
rtnValue = 0
End If
Return rtnValue
End Function
We select the menu item "Extensions -> Report -> Report Properties…" to bring up the "Report Properties" dialog. Switch to the "Code" tab and copy the VB function to the "Custom code" textbox, as shown in Figure 37.
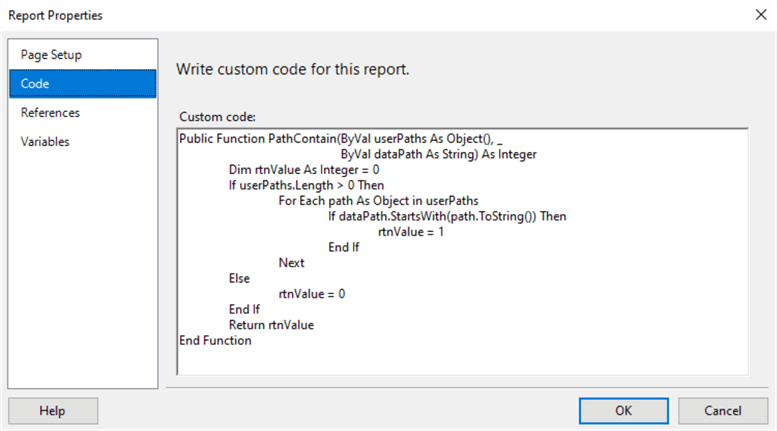
Figure 37 Write Custom Code for This Report
Switch to the "Report Data" pane and right-click on the dataset "uspGetAnnualSales." Select the menu item "Dataset Properties" from the context menu. The "Dataset Properties" dialog appears. Switch to the "Filters" tab and click on the "Add" button. The dialog should look like Figure 38.
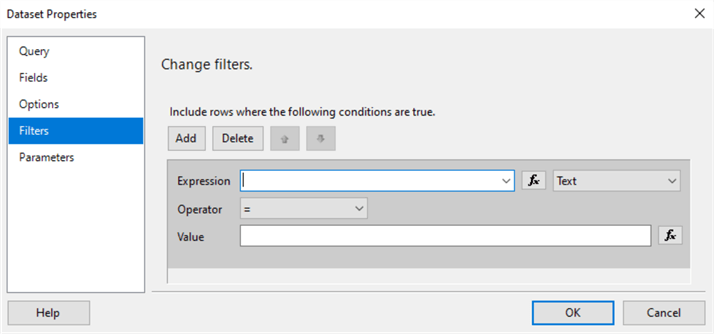
Figure 38 Change Filter in the Dataset Properties Dialog
Add the following expression to the "Expression" box. We change other options based on Figure 39.
=Code.PathContain(Parameters!UserHierarchyPaths.Value,Fields!HierarchyPath.Value)

Figure 39 Add a Filter to the Dataset
Click on the "OK" button to close the dialog. View the report in the Preview mode. We should access Amy Alberts, Syed Abbas, and all their subordinates’ data. The report should look like Figure 40.
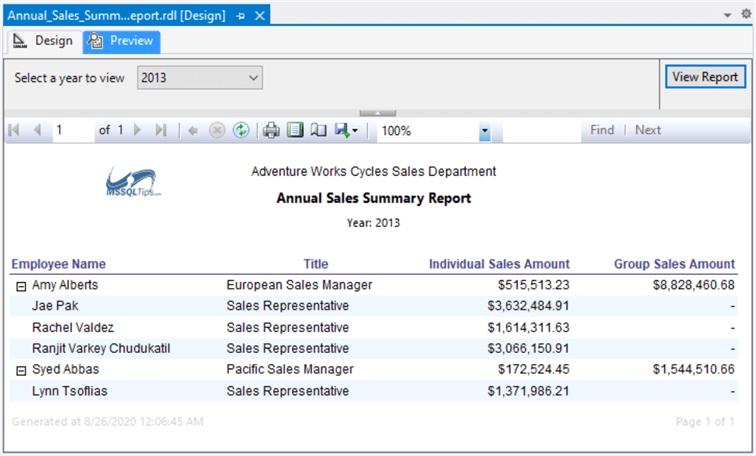
Figure 40 View the Report in the Preview Mode
5 – Test Row-level Security through the Web Portal
We quickly tested the row-level security in the report designer. To ensure this solution can work in a production environment, we deploy the report to a report server and test the data access through the SSRS web portal. Section 4.4 in tip [8] describes how to deploy reports using Visual Studio 2019 and access them through the web portal.
5.1 Representative Access
We run the following T-SQL script on the report server’s database and make our domain account act like Mary Gibson, a marketing specialist, who can access Amy Alberts, Syed Abbas, and all their subordinates’ data.
UPDATE [dbo].[DimEmployeeHierarchy]
SET [LoginID] = 'domain\user'
WHERE EmployeeKey = 109
Access the report through the web portal. Select the year 2013 and click on the "View Report" button. The report should look like Figure 41.
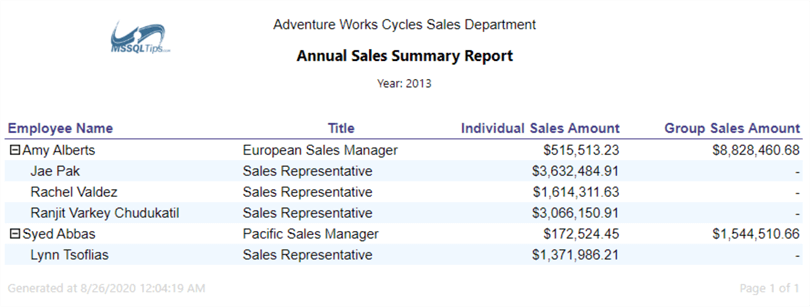
Figure 41 Test Representative Access on the Web Portal
5.2 Sales Manager Access.
Brian Welcker (EmployeeKey=277) is the Vice President of Sales in the company. He should access all sales data. We want to verify if the report works correctly for him. We roll back our changes for the EmployeeKey 109 and update the Login ID for the EmployeeKey 277:
UPDATE [dbo].[DimEmployeeHierarchy]
SET [LoginID] = 'adventure-works\mary0'
WHERE EmployeeKey = 109

UPDATE [dbo].[DimEmployeeHierarchy]
SET [LoginID] = 'domain\user'
WHERE EmployeeKey = 277
To avoid web browser cache issues, we close the web browser and re-open. We should be able to view all sales data in the report. The report should look like Figure 42.
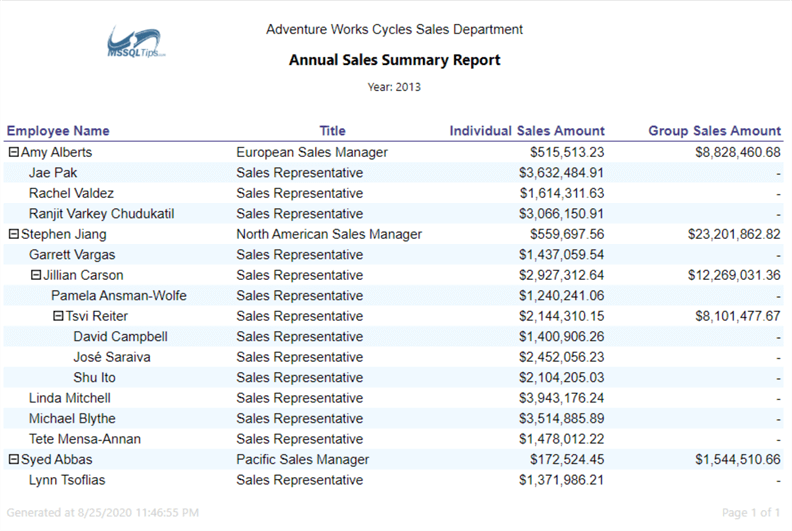
Figure 42 Test Vice President of Sales Access on the Web Portal
5.3 Sales Representative Access.
When a sales representative does not have any subordinate, the employee can only access his/her data. Let us act like Lynn Tsoflias (EmployeeKey=296). We rollback all changes and run the following script:
UPDATE [dbo].[DimEmployeeHierarchy]
SET [LoginID] = 'adventure-works\brian3'
WHERE EmployeeKey = 277

UPDATE [dbo].[DimEmployeeHierarchy]
SET [LoginID] = 'domain\user'
WHERE EmployeeKey = 296
When we re-access the report, we can only view Lynn’s data on the report. The report should look like Figure 43.
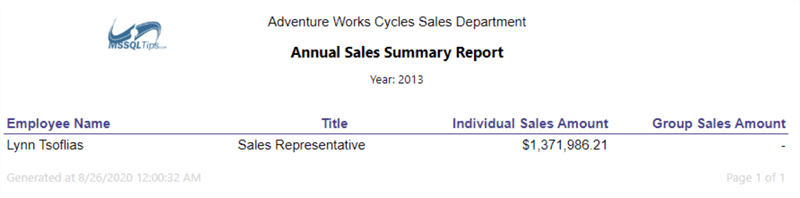
Figure 43 Test Sales Representative Access on the Web Portal
Summary
We briefly reviewed the concepts of recursive hierarchies. This review enables us to strengthen our comprehension of row-level security techniques adopted in this article. To prepare for the row-level security implementation, we created two tables to store employee hierarchies and role representatives. The basic idea is to compare two employees’ hierarchyid and tell if there is a superior-subordinate relationship between them. Based on this relationship, we can determine if one employee can access other’s data.
We then provided step-by-step instructions to create a recursive group in the SSRS report. We demonstrated how to add multiple datasets into a report. We created a dropdown list for users when they need to enter a parameter value. To improve user experience, we enabled a user to expand or collapse groups in the report interactively.
Next, we added a filter to the dataset. We used the filter to restrict data access. Superiors can access their subordinates’ data. We stored values from a query into a multi-values parameter, and the dataset filter could use these values to filter data. We also showed the way of using custom code in SSRS.
Finally, we conducted three testing cases to ensure users can access data that they are allowed to access.
Reference
[1] Guyer, C., Milener, G., Hamilton, B., Kumar, S., Stein, S. & Ray, M. (2017). Tutorial: Using the hierarchyid Data Type. Retrieved from SQL Docs: https://docs.microsoft.com/en-us/sql/relational-databases/tables/tutorial-using-the-hierarchyid-data-type?view=sql-server-ver15.
[2] Guyer, C., Hamilton, B., Milener, G., Macauley, E., Kumar, S., Schonning, N. & Ray, M. (2017). hierarchyid data type method reference. Retrieved from SQL Docs: https://docs.microsoft.com/en-us/sql/t-sql/data-types/hierarchyid-data-type-method-reference?view=sql-server-ver15.
[3] Milener, G., Guyer, C., Ray, M., Hamilton, B., Roth, J., Kumar, S., Byham, R. & Yoshioka, H. (2019). Hierarchical Data (SQL Server). Retrieved from SQL Docs: https://docs.microsoft.com/en-us/sql/relational-databases/hierarchical-data-sql-server?view=sql-server-ver15.
[4] Guyer, C., Hamilton, B., Sparkman, M., Milener, G., Rabeler, C., Ghanayem, M., Keller, L., Kumar, S. & Howell, J. (2017). Create a Recursive Hierarchy Group (Report Builder and SSRS). Retrieved from SQL Docs: https://docs.microsoft.com/en-us/sql/reporting-services/report-design/create-a-recursive-hierarchy-group-report-builder-and-ssrs?view=sql-server-ver15.
[5] Kess, B. (2017). AdventureWorks sample databases. Retrieved from GitHub: https://github.com/Microsoft/sql-server-samples/releases/tag/adventureworks.
[6] Wikipedia. (2020). Hierarchy. Retrieved from Wikipedia: https://en.wikipedia.org/wiki/Hierarchy.
[7], Adamson, C. (2010). Star Schema The Complete Reference. New York, NY: McGraw-Hill.
[8] Zhou, N. (2020). Multiple Row Grouping Levels in SSRS Report. Retrieved from MSSQLTips: https://www.mssqltips.com/sqlservertip/6533/multiple-row-grouping-levels-in-ssrs-report/.
[9] Sparkman, M., Guyer, C., Milener, G., Kumar, S., Rabeler, C., Hamilton, B., Howell, J., Sherer, T., Thompson, B., & Ghanayem, M. (2020). Configure Windows Authentication on the Report Server. Retrieved from SQL Docs: https://docs.microsoft.com/en-us/sql/reporting-services/security/configure-windows-authentication-on-the-report-server?view=sql-server-ver15.
[10] Guyer, C., Sparkman, M., Sherer, T., Hassler, M., Hamilton, B., , Rabeler, C., , Keller, L., Kumar, S., Schonning, N., Reilingh, N., Howell, J., Milener, G. & Ghanayem, M. (2019). Cache Shared Datasets (SSRS). Retrieved from SQL Docs: https://docs.microsoft.com/en-us/sql/reporting-services/report-server/cache-shared-datasets-ssrs?view=sql-server-ver15.
Next Steps
- The hierarchyid data type is essential to the techniques that we used in this article. Even though this data type may not be available in certain circumstances, we still can borrow the idea of this data type. We used the hierarchyid data type to store employee hierarchy data. We then used this data to restrict data access. We mentioned that we might encounter four types of recursive hierarchies. We only tackled the report-to structure in this tip. The techniques covered in this tip can apply to other types of recursive hierarchies. Besides, DAX also provides several parent and child functions. By using these functions, we can employ the techniques to implement Power BI row-level security as well. When we prepare for row-level security, we should consider a general solution that can lead to a company’s security framework.
- Check out these related tips:
- Using a Parent Child Hierarchy in SQL Server to Implement a Custom Security Scheme
- Working with a Parent Child Hierarchy in SQL Server Reporting Services SSRS
- Recursive Queries using Common Table Expressions (CTE) in SQL Server
- SQL Server Hierarchyid Data Type Overview and Examples
- SQL Server Common Table Expression vs Temp Table
- SQL Server and Excel Hierarchyid Example for Organization Charts
- Multiple Row Grouping Levels in SSRS Report
- SQL Server Reporting Services Using Multi-value Parameters

Nai Biao Zhou has twenty years of experience in software development, with strong analytical skills and a broad range of computer expertise.
He has fifteen years of experience in development and maintenance of database applications on SQL Server in OLTP/OLAP/BI environments.
He has a master’s degree in Control Engineering and is pursuing a Master of Science degree in Predictive Analytics.
Knowledge/Skills
Advanced computer programming skills and well versed with C/C#, Java, ASP.NET, JavaScript, and SQL.
In depth knowledge of Solution Architecture, and Software Development Life Cycle (SDLC).
Microsoft Certified Application Developer (MCAD) since 2004.
- MSSQLTips Awards: Author of the Year – 2021 | Rising Star (50+ tips) – 2024 | Author Contender – 2020, 2023