Problem
Our organization has many SQL Server Agent Jobs that run over the course of a day. Many of these jobs are critical to the business so we need to monitor the status of the jobs closely. There are many options for monitoring such as the Job Activity Monitor or View History in SQL Server Management Studio (SSMS), executing custom T-SQL queries that use tables and views in the msdb database, PowerShell, third-party tools, etc.
I would like to simplify our monitoring by creating a Power BI dashboard that will give us the details we need and provide an on-demand refresh capability. We are looking for a few pieces of information about each job that is currently running such as how long has the job been running, the average time the job runs, etc. Every so often I want to click on the dashboard and have the data refresh with the latest available status on the jobs currently running.
In addition to the basic monitoring I have described, we need to have an estimated completion time for each job that is currently running. For any given job, its completion provides the availability of certain data that is critical to the business. As a for instance, there are many dashboards that get their data refreshed every morning. There is an expectation that the dashboards will be available no later than 8:00 AM. We need to know if any of the jobs that the dashboards depend on will finish later than 8:00 AM and if so, we need to post a company-wide alert that the dashboards are delayed and when they will be available.
How can we accomplish this with Power BI?
Solution
In this tip I will demonstrate a simple approach to gathering data from the SQL Server Agent tables, populating a data mart, and rendering the data with a Power BI dashboard. At a high level, I will walk through the following steps:
- Provide an overview of the Power BI dashboard that can be used to monitor SQL Agent jobs currently running.
- Review the SQL Server Agent tables used to gather data for the dashboard.
- Review the data mart tables that will be populated from the SQL Server Agent tables.
- Provide an overview of the SQL Agent jobs and SQL Server stored procedures that extract data from the SQL Server Agent tables and populate the data mart.
- Discuss the design considerations for the Power BI dashboard.
Power BI Dashboard
The following is an example of the Power BI dashboard that I created to monitor active SQL Server Agent jobs:
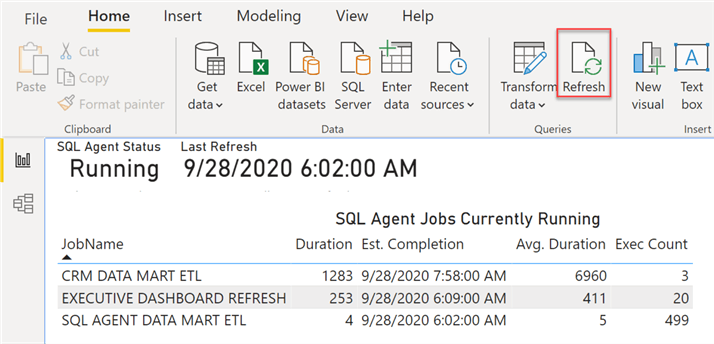
The main points for the dashboard are:
- The dashboard is shown running in Power BI Desktop Version 2.84.701.0 64-bit (August 2020).
- The dashboard is populated from a data mart that will be discussed in the sections that follow.
- Click the Refresh button to update the data from the latest data loaded to the data mart.
- SQL Agent Status is a Card visual that displays the status_desc column from the DMV sys.dm_server_services. The value retrieved should be Running, indicating that the SQL Agent service is currently running.
- Last Refresh is a Card visual that displays the date and time that the underlying data mart tables were last refreshed from the SQL Server Agent tables.
- The SQL Agent Jobs Currently Running Table visual is populated from a view in the data mart with the details on the SQL Agent jobs currently running.
- Duration and Avg. Duration are in seconds. Duration is how long the job has been running.
- Exec Count is the number of times that the SQL Agent job has run per the data in the SQL Server Agent tables.
The solution includes the following SQL Server Agent jobs:
- CALCULATE JOB HISTORY populates the data mart history tables
- SQL AGENT DATA MART ETL populates the data mart active job tables
The jobs and data mart tables will be discussed in the sections that follow.
SQL Server Agent Tables
SQL Server Agent provides many tables in the msdb database that can be queried to retrieve current and historical data about SQL Server Agent jobs. You can get the full details on the available tables here. For our purposes, we will be using the following tables:
- sysjobs stores data about each SQL Agent job
- sysjobsteps stores data for each step in a SQL Agent job
- sysjobactivity stores data about current SQL Agent job activity and job status
- sysjobhistory stores data about SQL Agent jobs and job steps that have executed
- syssessions stores data each time the SQL Agent service is started
Data Mart History Tables
The data mart has a group of tables that contain historical data extracted from the SQL Server Agent tables. The diagram below shows the tables and their relationships using the model view in Power BI:
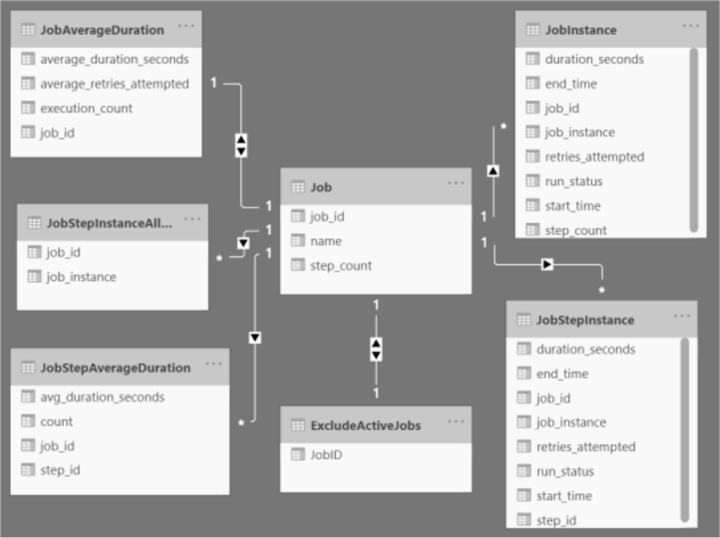
The main points for the model are:
- The data mart tables are populated from the data in the SQL Agent tables.
- The Job table is created from the data in the sysjobs and sysjobsteps tables. The step_count column is the count of steps in the SQL Agent job per the sysjobsteps table.
- The JobInstance table is used to assign a sequential value (job_instance) for each time that the SQL Agent job executes.
- The JobStepInstance table is used to assign a sequential value (job_instance) for each time that the SQL Agent job step executes. The job_instance associates the job step with the job_instance in the JobInstance table. It is the way to join the job steps executed to the job.
- The JobStepInstanceAllStepsCompleted table contains every job instance where all steps of the job completed successfully.
- The ExcludeActiveJobs table can contain the list of SQL Agent jobs that are to be ignored by the Power BI dashboard.
- All of the above tables are populated by a SQL Agent job that can be run on demand. I will discuss the job in a later section.
Note that although the above diagram looks like the standard star schema, it is a bit different. Most of the tables are fact tables. The Job and ExcludeActiveJobs tables are the only dimension tables.
Data Mart Active Job Tables
The data mart has a small group of tables and views that contain the data pertaining to SQL Agent jobs currently running. The data is extracted from the SQL Server Agent tables and the data mart history tables. The diagram below shows the tables and views using the model view in Power BI:
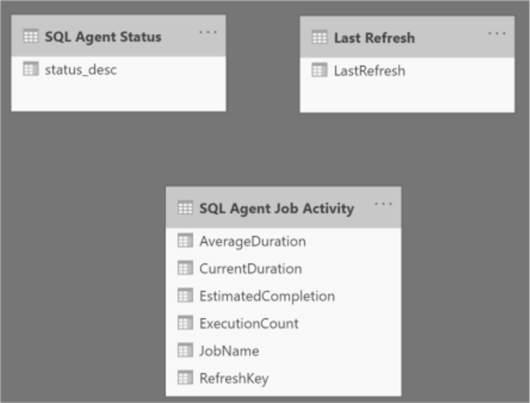
Each of the above tables and views populate a corresponding visual in the Power BI dashboard shown earlier.
SQL Agent Job: CALCULATE JOB HISTORY
The goal of the CALCULATE JOB HISTORY SQL Agent job is to calculate the average duration of SQL Agent jobs and job steps. The calculations are primarily based on the data available in the sysjobhistory table. When the data is retrieved to refresh the Power BI dashboard, the average durations are already calculated and simply retrieved from a table.
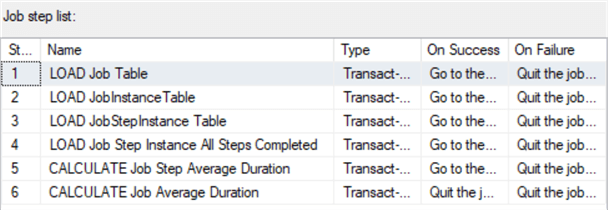
The CALCULATE JOB HISTORY SQL Agent job is designed to be run on demand, although scheduling it to run during off hours would be advisable. The tables shown in the diagram in the Data Mart History Tables section above are populated by the job. The following are the steps in the job:
Each job step executes a SQL Server stored procedure where the corresponding table is truncated and loaded from either the SQL Agent tables, or the data mart tables that have been loaded from the SQL Agent tables. The stored procedures are available in the code download link at the end of this tip. I will review selected parts of the stored procedures in the remaining parts of this section.
JobInstance Table
The JobInstance table is populated with a row from the sysjobhistory table for every job that completed successfully. The following excerpt from the stored procedure LoadJobInstance shows the details on retrieving the history for jobs that have completed successfully:
SELECT
    [job_id]
,   msdb.dbo.agent_datetime(run_date, run_time) AS [start_time]
,   DATEADD(
      second
   ,   [run_duration] / 10000 * 3600 +        -- convert hours to seconds
      ([run_duration] % 10000) / 100 * 60 +   -- convert minutes to seconds
      ([run_duration] % 10000) % 100          -- get seconds
   ,   msdb.dbo.agent_datetime(run_date, run_time)) [end_time]
   ,   [run_duration] / 10000 * 3600 +        -- convert hours to seconds
      ([run_duration] % 10000) / 100 * 60 +   -- convert minutes to seconds
      ([run_duration] % 10000) % 100          -- get seconds
         AS [duration_seconds]
,   [run_status]
,   [retries_attempted]
FROM msdb.dbo.sysjobhistory h
WHERE [step_id] = 0
AND [run_status] = 1
The following are the main points from the above T-SQL:
- The msdb.dbo.agent_datetime function takes the sysjobhistory run_date and run_time columns and returns a DATETIME. The run_date column is an integer with its value formatted as YYYYMMDD. The run_time column is an integer with its value formatted as HHMMSS representing the time that the job started.
- The run_duration column is an integer with its value formatted as HHMMSS representing the number of hours, minutes and seconds that the job ran. It gets converted into seconds as shown above.
- A row representing a job that completed has a step_id value of 0.
- The run_status column has a value of 1 when the job completed successfully.
- The above T-SQL is encapsulated in a common table expression (aka CTE). The result set is inserted into the JobInstance table and includes the job_instance column which is assigned based on the following T-SQL:
ROW_NUMBER() OVER (
   PARTITION BY [job_id]
   ORDER BY [job_id], [start_time]
)   AS [job_instance]
The result of the above T-SQL is to produce a sequential number for each job that completed successfully. The ROW_NUMBER function numbers the jobs based on job_id ordered by the job_id and start_time. The purpose is to group the job steps in the job. We will see this below.
JobStepInstance Table
The JobStepInstance table is populated with a row from the sysjobhistory table for every job step that completed successfully. The same code used in the LoadStepInstance procedure above is used to get the start_time, end_time and duration_seconds. The following excerpt from the stored procedure LoadJobStepInstance shows the details on retrieving the history for job steps that have completed successfully:
FROM msdb.dbo.sysjobhistory
WHERE [step_id] > 0
AND [run_status] = 1
The main points for the above code are:
- Filter on step_id > 0 to get the job step completion rows; step_id = 0 is a job completion.
- The run_status column has a value of 1 when the job step completed successfully.
The JobStepInstance row is associated with the JobInstance row based on where the job step start_time is between the JobInstance start_time and end_time.
JobStepInstanceAllStepsCompleted Table
The JobStepInstanceAllStepsCompleted table gets populated with the list of job_id and job_instance combinations where the job completed successfully and every step in the job completed successfully. The purpose is to only include these job instances in the calculation of the average job and job step durations (covered below).
It would be a bit tricky to accurately compute average durations under the following scenarios:
- A job fails before successfully completing all job steps and it is never restarted at the point of failure to complete. The duration of the job is lower than normal because not all steps were completed.
- A job fails and is restarted at the point of failure (possibly multiple times after repeated failures). In this case the duration of the job may be lower or higher than normal.
Given the above issues, I decided to only include successful jobs where all job steps completed successfully in the calculation of average duration.
The following is an excerpt from the T-SQL code in the LoadJobStepInstanceAllStepsCompleted stored procedure:
The rows selected are inserted into the JobStepAverageDuration table. Note that the rows from the JobStepInstance table are joined to the JobStepInstanceAllStepsCompleted table to limit the calculation to job steps that completed successfully and were part of a job that completed all steps successfully.
JobAverageDuration Table
The JobAverageDuration table gets populated with the average duration of each job. The jobs that completed all steps successfully are included in the calculation of the average.
The following excerpt of T-SQL code from the CalculateJobAverageDuration stored procedure shows the rows selected and the calculation of the average duration:
SELECT
    j.[job_id]
,   COUNT(*)
,   AVG([duration_seconds])
,   AVG([retries_attempted])
FROM [dbo].[JobInstance] j
JOIN [dbo].[JobStepInstanceAllStepsCompleted] c ON c.[job_id] = j.[job_id] AND c.[job_instance] = j.[job_instance]
GROUP BY j.[job_id];
The rows selected are inserted into the JobAverageDuration table. Just like the calculation of the average job step duration, the above code joins to the JobStepInstanceAllStepsCompleted table to limit the calculation to job steps that completed successfully and were part of a job that completed all steps successfully.
SQL Agent Job: SQL AGENT DATA MART ETL
The SQL AGENT DATA MART ETL job only has one step; it executes the stored procedure GetActiveJobs. The GetActiveJobs stored procedure extracts data for the SQL Agent jobs that are currently running from the sysjobactivity table and also retrieves the average job and job step durations as explained above. The data is inserted into the ActiveJobs table. The view vActiveJobs queries the ActiveJobs table and is used by the Power BI dashboard to populate the list of the SQL Agent jobs currently running.
The SQL AGENT DATA MART ETL job can be scheduled to run as often as you like. You can set the schedule based on how long the job runs and how often you would like to see refreshed data in the Power BI dashboard. I have the job running every minute for my testing.
The following excerpt of T-SQL code from the GetActiveJobs stored procedure retrieves the data on the currently running SQL Agent jobs from the sysjobactivity table:
DECLARE
    @SESSION_ID       INT
,   @REFRESH_KEY      INT = NEXT VALUE FOR [dbo].[RefreshKey]
,   @REFRESH_DATE     SMALLDATETIME = CONVERT(SMALLDATETIME, GETDATE());

SELECT
   @SESSION_ID = MAX(session_id)
FROM msdb.dbo.syssessions;

;WITH CTE_JOBS_RUNNING AS (
   SELECT
       a.[job_id]
   ,   a.[start_execution_date]
   ,   a.[last_executed_step_id]
   ,   a.[last_executed_step_date]
   FROM msdb.dbo.sysjobactivity a
   LEFT JOIN [dbo].[ExcludeActiveJobs] e
   ON e.[job_id] = a.[job_id]
   WHERE a.session_id = @SESSION_ID
   AND a.start_execution_date IS NOT NULL
   AND stop_execution_date IS NULL
   AND e.[job_id] IS NULL
)
The main points for the above T-SQL code are:
- RefreshKey is a sequence that retrieves the next sequential number; it will be used later.
- Every time the SQL Agent service is started, a row is written to the syssessions table with a session_id and the datetime. The session_id is used to filter the results from the sysjobactivity table to only include data from the current instance of the SQL Agent.
- The sysjobactivity table is queried to retrieve the data on the currently running SQL Agent jobs. A job that is currently running will have a start_execution_date that is NOT NULL and a stop_execution_date that IS NULL.
- The ExcludeActiveJobs table contains the list of job_id values to exclude. There may be SQL Agent jobs that you do not want to see in the Power BI dashboard. The left join to the ExcludeActiveJobs and check that its job_id IS NULL includes jobs where the job_id does not exist in the ExcludeActiveJobs table.
I think the only way to get the job_id of a SQL Agent job is to query the sysjobs table:
SELECT
    [job_id]
,   [name]
FROM msdb.dbo.sysjobs
ORDER BY [name];
The next step in the GetActiveJobs stored procedure is to calculate the remaining duration for each active job. The following excerpt of T-SQL code from the GetActiveJobs stored procedure is used:
, CTE_JOB_STEPS_REMAINING_DURATION AS (
   SELECT
       a.[job_id]
   ,   SUM(d.[avg_duration_seconds]) [job_step_average_duration]
   FROM CTE_JOBS_RUNNING a
   LEFT JOIN [dbo].[JobStepAverageDuration] d
   ON d.[job_id] = a.[job_id]
   WHERE d.[step_id] > COALESCE(a.[last_executed_step_id], 0)
   GROUP BY a.[job_id]
)
The main points for the above T-SQL code are:
- Retrieve the result set from CTE_JOBS_RUNNING which has the list of SQL Agent jobs currently running.
- Join to the JobStepAverageDuration table and calculate the sum of the average duration for the remaining steps to be completed in the job.
- CTE_JOBS_RUNNING has the column last_executed_step_id. Before the first step is completed, last_executed_step_id will be NULL.
- If a job is restarted from a step other than the first step of the job, until that step is completed the remaining duration will be overstated because all job steps will be summed to calculate the remaining duration. After the first actual step completes, the remaining duration will only include the remaining steps to be executed.
The next step in the GetActiveJobs stored procedure is to finish up the calculations and insert the data into the ActiveJobs table. The following excerpt of T-SQL code from the GetActiveJobs stored procedure is used:
INSERT [dbo].[ActiveJobs] (
    [RefreshKey]
,   [job_id]
,   [CurrentDuration]
,   [ExecutionCount]
,   [AverageDuration]
,   [EstimatedCompletion]
)
SELECT
    @REFRESH_KEY
,   a.[job_id]
,   DATEDIFF(second, a.[start_execution_date], GETDATE()) AS [current_duration]
,   j.[execution_count]
,   d.[job_step_average_duration] -- based on last step executed
,   CONVERT(
      SMALLDATETIME
   ,
      DATEADD(
          second
      ,   d.[job_step_average_duration] + DATEDIFF(second, a.[start_execution_date], GETDATE())
      ,   a.[start_execution_date]
      )
   ) AS [estimated_completion]
FROM CTE_JOBS_RUNNING a
LEFT JOIN CTE_JOB_STEPS_REMAINING_DURATION d ON d.[job_id] = a.[job_id]
LEFT JOIN [dbo].[JobAverageDuration] j ON j.[job_id] = a.[job_id];
The main points for the above T-SQL code are:
- The @REFRESH_KEY variable has the value for the next number in the RefreshKey sequence. When the Power BI dashboard retrieves data from the ActiveJobs table, it retrieves the data for the MAX(RefreshKey).
- The current_duration is the number of seconds that the job has been running.
- The execution_count is the number of times the job has run (based on the data gathered by the CALCULATE JOB HISTORY SQL Agent job.
- The job_step_average_duration is actually the remaining duration based on the last step executed in the job.
- The estimated completion date is the remaining duration plus the time that the job has been running.
Finally, the last step in the GetActiveJobs stored procedure is to insert the @REFRESH_KEY and @REFRESH_DATE into the ActiveJobsRefresh table as shown below:
INSERT [dbo].[ActiveJobsRefresh] (
   [RefreshKey]
,   [RefreshDate]
)
SELECT
   @REFRESH_KEY
,   @REFRESH_DATE;
When the Power BI dashboard is refreshed, the view vActiveJobs is used. The following is the code for the view:
CREATE OR ALTER VIEW [dbo].[vActiveJobs]
AS
   SELECT
       [RefreshKey]
   ,   j.[name] AS [JobName]
   ,   [CurrentDuration]
   ,   [ExecutionCount]
   ,   [AverageDuration]
   ,   [EstimatedCompletion]
   FROM [dbo].[ActiveJobs] a
   JOIN [dbo].[Job] j ON j.[job_id] = a.[job_id]
   WHERE [RefreshKey] = (
      SELECT
         MAX([RefreshKey])
      FROM [dbo].[ActiveJobsRefresh]
   );
As shown above, the MAX(RefreshKey) is retrieved from the ActiveJobsRefresh table and used to join with the ActiveJobs table to only return the latest data collected on SQL Agent jobs running.
Power BI Dashboard Development
The Power BI dashboard for this tip is really a trivial one. However, I will walk through some typical considerations.
When you are retrieving data from a SQL Server database with Power BI, you can choose from the Import or DirectQuery Data Connectivity modes. Import makes a copy of your data and stores it in the Power BI pbix file. DirectQuery queries the data directly from the SQL Server database(s). Given that the SQL Agent data is in the msdb database on the SQL Server instance where the SQL Agent service is running, I chose DirectQuery. Refreshing the dashboard data executes the queries specified in the dashboard and returns the data.
Whenever you retrieve data for analysis and reporting, it is often a good idea to transform the data into a schema that is conducive to reporting. This is typically the star schema. I did this and created the data mart although it is not the typical star schema as mentioned above. However, Power BI has some really impressive capabilities for transforming data as shown in the tip Introduction to Power BI Desktop and the M Language. With data coming from SQL Server, I choose to do the transformations in SQL Server using stored procedures that write the data to tables in the data mart. At this point I am much more comfortable with this approach. In addition, I have created a dart mart which could easily be used outside of Power BI.
As far as deployment of the Power BI dashboard, I only used it running in Power BI Desktop which is quite an impressive application. It supports both development and rendering of the dashboard. Literally you just click Refresh to update the data rendered on the dashboard.
The other options for deployment are the Power BI Report Server and the Power BI Service. I usually use the Power BI Report Server which is an enhanced version of SQL Server Reporting Services (SSRS) which allows you to upload and execute Power BI dashboards (i.e. .pbix files) the same as you upload and execute SSRS report (i.e. .rdl files).
One final note is that I developed the code using a single SQL Server instance. This allows me to create stored procedures that retrieve data from the msdb database and insert into the SQL_AGENT_DATA_MART database tables. I simply use the three part name for the msdb tables; e.g. msdb.dbo.sysjobhistory. If I wanted to put the SQL_AGENT_DATA_MART database on a different SQL Server instance, I would create a SQL Server Integration Services (SSIS) package that uses a Data Flow to retrieve the data from the msdb database tables and write the data to staging tables in the SQL_AGENT_DATA_MART database. I would then modify my stored procedures to process the data in the staging tables to update the tables in the SQL_AGENT_DATA_MART database. I chose my approach of using stored procedures and a single SQL Server instance to make it easy to develop and test.
Next Steps
- At this point, Power BI has been around for a number of years. It is really a pretty easy way to develop dashboards to render data using a variety of built-in and custom visuals.
- A Power BI dashboard could be a great way to monitor SQL Agent jobs currently running.
- Download the sample code and test in your environment.
- There are many tips available in the Power BI Category. Take a look for other interesting ones.
- After you read through this tip, you will probably find that there are many uses for Power BI dashboards.

Ray is a Principal Architect at IT Resource Partners focused on SQL Server and Business Intelligence. He is a Microsoft Certified Solutions Expert (MCSE) in Business Intelligence, a MSSQLTips.com BI Expert and Ambassador. He is also a co-author of the book: SharePoint 2010 Business Intelligence Unleashed.
- MSSQLTips Awards: Champion (100+ tips)


Take a look at this tip for the details on how to use parameters in Power BI Desktop: https://www.mssqltips.com/sqlservertip/4475/using-parameters-in-power-bi/
I haven’t had any experience deploying to multiple targets. I only need to upload my Power BI reports manually to my dev, test and prod report servers.
Thanks for the great article. Quick question when you publish the report to Power BI report server. How are you seeing a parameter when report is deployed in report server for let say “server/instance name”. If i deploy the scripts across 1000 servers i do not want to have 1000 entries for server name as that will just bloat the model. Can i just dynamically enter server name as can be done from desktop?