Problem
Many companies would like to have real time data stored in the Power BI service for reporting. For instance, the location of tractor trailers for a trucking company allows management to keep eye on delivery assets. There are two ways to accomplish this task in Power BI. One way is to create a streaming dataset. Unfortunately, the data is only stored in a temporary cache for a limited amount of time. Another way is to create a push dataset. The data retention is controlled by the programmer.
How can we manage Power BI datasets using a scripting language?
Solution
Microsoft has provided the administrator PowerShell cmdlets to manage objects in the Power BI service including workspaces, datasets and reports. The cmdlets are just a nice wrapper for REST API. If you can not find a PowerShell cmdlet to perform the required action, you can just call the web service directly. Today, we are going to review cmdlets that manage datasets in the cloud.
Business Problem
Our boss has asked us to investigate the use of PowerShell scripts to manage datasets for the cloud service. Most windows operating systems come with the Power Shell ISE preinstalled. Please make sure you have at version 5.1 or greater. You will need an Azure AD account that has been given rights to use the Power BI APIs. Please see my prior article on how to configure this setting in the Power BI tenant.
During my undergraduate studies at the University of Rhode Island, I majored in both applied mathematics and computer science. Today, we will be picking sample datasets from number theory and machine learning to demonstrate how to manage datasets within the Power BI Service.
Review Modules and Cmdlets
Microsoft has supplied the PBI administrator with a bunch of modules and cmdlets that can be used to manage the online service. Please see the online documentation for details.

Today, we are going to focus on the module and cmdlets that deal with datasets. Any missing functionality can be overcome with calling the swiss army cmdlet named Invoke-PowerBIRestMethod.
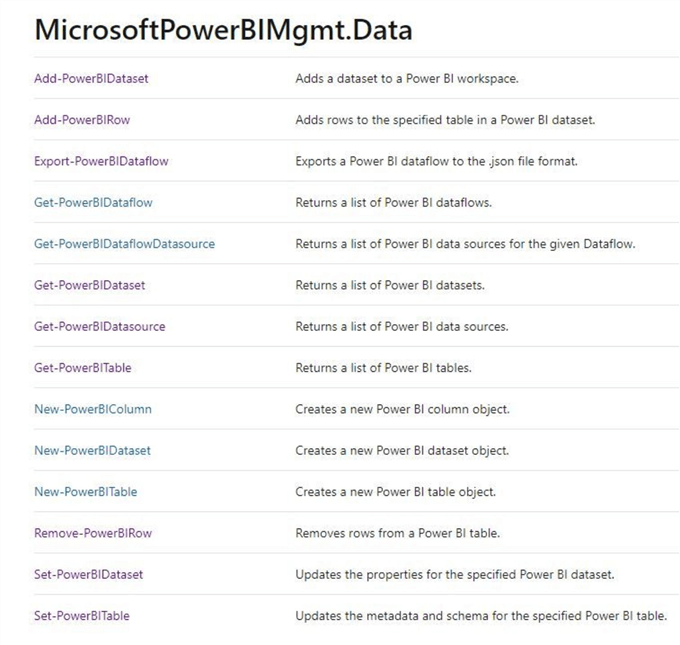
To install these cmdlets, you must have a PowerShell version of 5.1 or later. The following script validates the version, updates the nuget package, installs the Microsoft Power BI management cmdlets and lists cmdlets filtered by the datasets module.
# What version of PowerShell
$PSVersionTable
# Update nuget
Install-PackageProvider -Name NuGet -Force
# Install power bi
Install-Module -Name MicrosoftPowerBIMgmt -Force
# Verify module
Get-Command -Module MicrosoftPowerBIMgmt
# List cmdlets
Get-Command | Where-Object { $_.Source -match 'MicrosoftPowerBIMgmt.Data'}
The image below shows that my computer has the correct version of PS software.

The nuget package has been updated to the latest.

Last but not least, we can see there is an alias for each cmdlet for backwards compatibility.

We now have the cmdlets install and can start exploring how to manage datasets. I will not cover the three cmdlets that are related to Power BI dataflows since they are not related to push datasets.
Push vs Streaming Datasets
A streaming dataset is stored in a temporary cache within the Power BI Service. This temporary cache is used to display visuals and the information expires in a timely manner. Only simple visuals such as a line chart are supported and have a time window of one hour. Since there is no underlying database, so you cannot build report visuals off the data that flows in from the stream. As such, you cannot make use of report functionality such as filtering, Power BI visuals, and other report functions.
A push dataset is stored in a new database within the Power BI Service. Since there is an underlying database that continues to store the data as it comes in, reports can be created with the data that flows into the service. All the features of Power BI are available when creating reports and dashboards can be created in the service. Unless you are dealing with huge amounts of data, push datasets have an major advantage over streaming datasets.
The chart below shows the differences between the two real time datasets. Please pay attention to the max ingestion rate and total data throughput since they key to choosing the correct dataset type. Please online Microsoft documentation for more details.

Create new workspace
Before we can start exploring the cmdlets for datasets, we first need to log into the Power BI Service and create a new workspace for this investigation. The Connect-PowerBIServiceAccount cmdlet logs the current user (credential) into the Power BI service. The PowerShell script below creates a credential from a given user name and secure password. Then, it uses this credential to connect to the Power BI Service.
#
# Connect to service
#
# User credential
$User = "pbi@craftydba.com"
$Pword = ConvertTo-SecureString -String 'MySamplePwd' -AsPlainText -Force
$Credential = New-Object -TypeName System.Management.Automation.PSCredential -ArgumentList $User, $Pword
# Connect to service
Connect-PowerBIServiceAccount -Credential $Credential
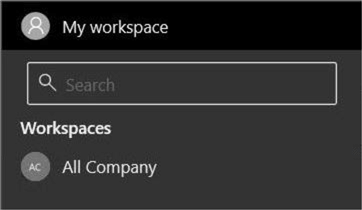
The connect cmdlets displays the current user who is logged into the Power BI service.

The image below shows the pbi@craftydba.com account which is an administrator and has access to the All Company workspace.
The script below satisfies a typical user request for a new workspace. Calling the New-PowerBIWorkspace cmdlet will create a new shared workspace called “Push Data Sets”.
#
# Create a new workspace
#
$workspace1 = New-PowerBIWorkspace -Name "Push Data Sets"
$workspace1
The output below shows the successful execution of the code. Please notice that there is no Capacity Id. Therefore, we are using shared capacity for computing power. Check out Microsoft’s premium capacity for dedicated computing power.

Now that we have a new workspace, we can now create some datasets.
Creating datasets and tables
The creation of a dataset is a very simple and straight forward. The chart below shows the steps required to complete this process.
Step | Description | Cmdlet |
1 | Define columns in the table. | |
2 | Define table from columns. | |
3 | Define dataset from tables. | |
4 | Add dataset to workspace. |
I am going to create two tables to store Prime and Fibonacci numbers. The code below creates the two tables and adds them to a dataset called “ds_Number_Theory”.
#
# Create two new dataset
#
# Create table (prime numbers)
$col1 = New-PowerBIColumn -Name "my_Id" -DataType Int64
$col2 = New-PowerBIColumn -Name "my_Value" -DataType Int64
$col3 = New-PowerBIColumn -Name "my_Division" -DataType Int64
$col4 = New-PowerBIColumn -Name "my_Time" -DataType DateTime
$table1 = New-PowerBITable -Name "tbl_Primes" -Columns $col1, $col2, $col3, $col4

# Create table (fibonacci sequence)
$col5 = New-PowerBIColumn -Name "my_Id" -DataType Int64
$col6 = New-PowerBIColumn -Name "my_Value" -DataType Int64
$col7 = New-PowerBIColumn -Name "my_Time" -DataType DateTime
$table2 = New-PowerBITable -Name "tbl_Fibonacci" -Columns $col5, $col6, $col7

# Create dataset (number theory)
$dataset1 = New-PowerBIDataSet -Name "ds_Number_Theory" -Tables $table1, $table2
# Add to workspace
$dataset2 = Add-PowerBIDataSet -DataSet $dataset1 -WorkspaceId $workspace1.Id
$dataset2
The output below from the Power Shell (Interactive Shell Environment) shows the creation of our dataset. Please note, there is no actual storage associated with the dataset right now.

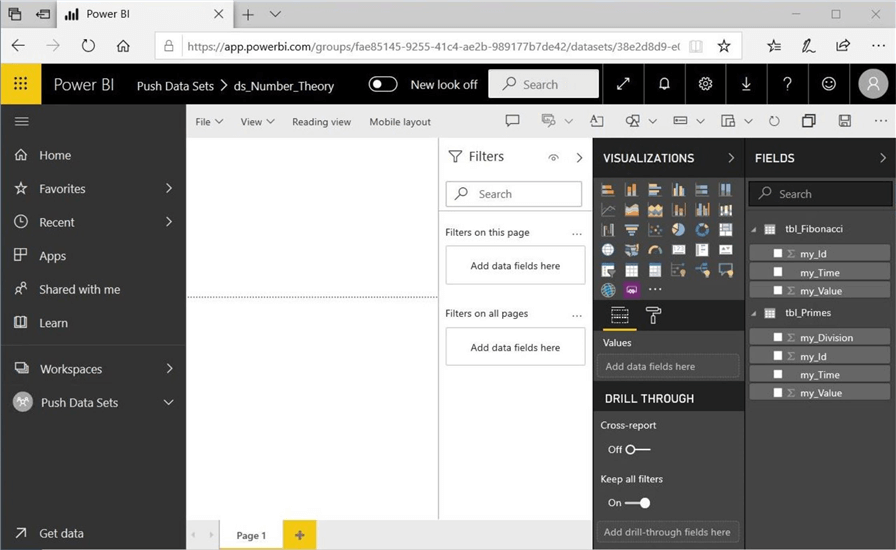
We can double check the results from the Power BI service. We can see that the “Push Data Sets” workspace contains a dataset named “ds_Number_Theory”, and the two empty tables named “tbl_Fibonacci” and “tbl_Primes”.
Now that we have the foundation for our push datasets, we need to create two Power Shell scripts to calculate the sequence of numbers for the tables. These data points will be added to the dataset in real time.
Fibonacci Numbers
The Fibonacci Number sequence can be calculated very easily as a recurrence relation. In mathematics, a recurrence relation is an equation that expresses each element of a sequence as a function of the preceding ones. Thus, f(n) = f(n-1) + f(n-2) where (n-2) = 2 and (n-1) = 3. The image below shows the first 6 numbers in the sequence starting at 2. We can see that the numbers are almost doubling in size during each iteration.

If we plot the sequence, we can see we have an exponential growth function. Also, the log of each value shows a linear growth. This will be a problem with data types in Power BI. This link shows the data types supported by the software. The Power Shell script might encounter an arithmetic overflow if we do not be careful.

I would like to calculate the first 100 numbers for both mathematical sequences. However, the script below encounters an arithmetic overflow at f(93). Also, the sequence actually starts with 0 and 1 as the starting seeds. The Add-PowerBIRow cmdlet allows the developer to add data to a table. We are making one web call per each row. If we wanted to optimize this program in the future, we could create one large array of rows to pass as the data to Power BI Service. This would reduce the web traffic from 92 to 1 call. Just remember there is a limit of 16 MB of information per call per second.
#
# Calculate fibonacci numbers
#
# first f(n-2)
[datetime]$date1 = Get-Date -Format "MM/dd/yyyy HH:mm"
[Int64]$f1 = 0
Add-PowerBIRow -DataSetId $dataset2.Id -TableName "tbl_Fibonacci" -Rows @{"my_Id"=1;"my_Value"=$f1;"my_Time"=$date1}
# second f(n-1)
$date1 = Get-Date -Format "MM/dd/yyyy HH:mm"
[Int64]$f2 = 1
Add-PowerBIRow -DataSetId $dataset2.Id -TableName "tbl_Fibonacci" -Rows @{"my_Id"=2;"my_Value"=$f2;"my_Time"=$date1}
# arithmatic overflow at fn(93)
for ($i=0; $i -lt 91; $i++) {
# new number
$fn = $f1 + $f2
# add to row
$r = $i+3
Add-PowerBIRow -DataSetId $dataset2.Id -TableName "tbl_Fibonacci" -Rows @{"my_Id"=$r;"my_Value"=$fn;"my_Time"=$date1}
# continue sequence
$f1 = $f2
$f2 = $fn
}
The code for calculating the Fibonacci sequence is quite simple. We are capturing an id, value and time for each row that is submitted to the table. Let’s calculate primes numbers in the next section.
Prime Numbers
The prime number sequence can be calculated by dividing a number by the preceding numbers. If there is a division other than 1 that has no remainder, then the number is prime. Otherwise, the number is divisible by another and is not a prime number. Such a number is called a composite number. In 1202 Fibonacci published a book called Liber Abaci which suggested that trial division up to the square root of the number was good enough for determination. The technique is labor intensive but easy to understand and code.

The script below is an implementation of the algorithm in Power Shell.
#
# Calculate prime numbers
#
# first prime number
[datetime]$date1 = Get-Date -Format "MM/dd/yyyy HH:mm"
[Int64]$p = 2
Add-PowerBIRow -DataSetId $dataset2.Id -TableName "tbl_Primes" -Rows @{"my_Id"=1;"my_Value"=$p;"my_Time"=$date1;"my_division"=1}
# second prime number
$date1 = Get-Date -Format "MM/dd/yyyy HH:mm"
[Int64]$p = 3
Add-PowerBIRow -DataSetId $dataset2.Id -TableName "tbl_Primes" -Rows @{"my_Id"=2;"my_Value"=$p;"my_Time"=$date1;"my_division"=1}
# calculate prime numbers
[Int64]$i = 3
[Int64]$n = 4
do
{
# prime flag
$f = $true
# test from 2 to sqrt(n)
$l = [math]::Sqrt($n) + 1
for ($j=2; $j -lt [int]$l; $j++) {
if (($n % $j) -eq 0) {
$f = $false
break;
}
}
# found a prime number
if ($f -eq $true) {
write-host "prime number "
write-host $n
Add-PowerBIRow -DataSetId $dataset2.Id -TableName "tbl_Primes" -Rows @{"my_Id"=$i;"my_Value"=$n;"my_Time"=$date1;"my_division"=$j}
$i = $i + 1
}
# next number to check
$n = $n + 1
$f = $true
} while ($i -le 100)
The above script loads the data set with columns for sequence id, sequence value, current time and number of trial divisions. I am only loading (calculating) the first 100 primes. If you want to try a real time dataset, set the stopping value to a higher number.
Number Theory Report
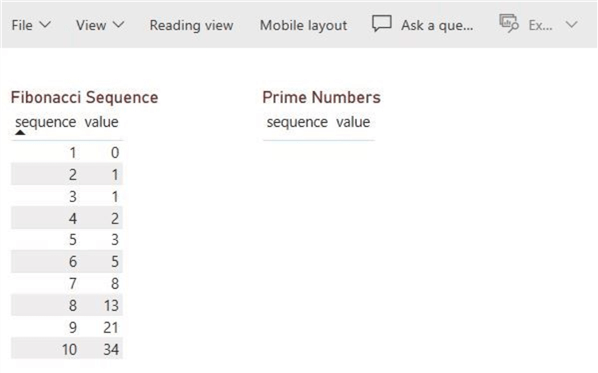
Now that we have datasets in the Power BI Service, let’s use the report editor to drag over the “my_Id” and “My_Value” fields over to the report. Please convert the visual to a table visual and rename the columns to “sequence” and “value”. Use the filter to select the top ten most sequences in ascending order.

If you repeat the same process for the prime number’s dataset, you report should look like the one below. Wow, this is really cool since we can apply all the normal reporting techniques to these push datasets.

If we want to view information about datasets, we can use the Get-PowerBIDataset cmdlet. Additionally, the Get-PowerBITable cmdlet can be used to get information about a table. The script below shows how to execute these commands.
#
# Various get cmdlets
#
# dataset
$q1 = Get-PowerBIDataset -Scope Organization -Name "ds_Number_Theory" -WorkspaceId $workspace1.Id
$q1
# table
$q2 = Get-PowerBITable -WorkspaceId $workspace1.Id -DatasetId $q1.Id
$q2
It is very interesting to look at the output for our dataset. We now see that data is stored in an Analysis Services Backup File (ABF). This is due to the fact that we added data to the tables.

What if we wanted to remove or add columns to a dataset? Do we have to recalculate our algebraic sequence from scratch? The Set-PowerBITable cmdlet can be used to modify a dataset. In the example below, we create a new definition that only has the two fields that we want.
#
# Update table (no loss of data)
#
# all tables
$curTables = Get-PowerBITable -DatasetId $dataset2.Id
# fib table
$curTable = $curTables[1]
# change schema
$col8 = New-PowerBIColumn -Name "my_Id" -DataType Int64
$col9 = New-PowerBIColumn -Name "my_Value" -DataType Int64
$updTable = New-PowerBITable -Name $curTable.Name -Columns $col8, $col9
# update the table
Set-PowerBITable -Table $updTable -DatasetId $dataset2.Id
If we get information on the table called “tbl_Fibonacci”, we can see that the “my_Time” field has been removed from the dataset.

Workspace Cleanup
Cleaning up a workspace is a task you will perform many times in the future as a Power BI Administrator. There is only one cmdlet available in the Microsoft module. Use the Remove-PowerBIRow cmdlet clear all the data within a given table. The Invoke-PowerBIRestMethod cmdlet can be used to create a code snippet to remove a dataset. Unfortunately, there is not even a REST API call that can be used to drop a table. Here is the reference for you to review at a later time.
The script below first removes all data from the table called. Next, it drops the dataset called “ds_Number_Theory” by passing the id to the REST API call.
#
# Drop all rows
#
Remove-PowerBIRow -DataSetId 38e2d8d9-e09d-4900-93d0-1ea470f8bf4c -TableName "tbl_Primes"
#
# Drop the dataset
#
$Id = $dataset2.Id
$Url = "datasets/$Id"
Invoke-PowerBIRestMethod -Url $Url -Method Delete
The screen shot of the Power BI report was captured after clearing the data from the prime numbers table.
Last but not least, we can see the dataset is missing from our workspace. Also, I manually deleted the report since there was no data to report on

To date, we have been researching how to create push datasets from code. How does a typical report and dataset look in the Power BI service?
Fishers Iris Dataset – SQL Table
To demonstrate one of the last Power BI cmdlets, I will need to upload a report to the Power BI Service. I am going to quickly create a simple clustering report for Fishers Iris Flower Dataset. This data set has been studied since 1936. Both linear regression and k-means clustering models can be explored with this simple 150 row data set. The enclosed links show blogs on regression and clustering using machine learning.
I chose to store the data in an Azure SQL Server named svr4tips2020, an Azure SQL Database named dbs4tips2020 and a SQL table named Iris. The image below from SQL Server Management Studio shows a handful of records from the dataset.

Please use the Power BI Desktop to import the data into the storage engine. The advanced editor of the Power Query section of the desktop designer shows the M language query. Please load the data into the model now.

The dataset view of the Power BI designer shows 150 records have been loaded into the x-velocity storage engine.

The next step is to create a clustering visual using the data from the Iris table. I choose to add a slicer based on species name. Please save the report as a file named “iris-classification-prob.pbix”. If you have not logged into the Power BI Service, please perform this action at this time. The image below shows the pbi@craftydba.com user logged into the service. I will hit the publish button to advance to the next step of the experiment.
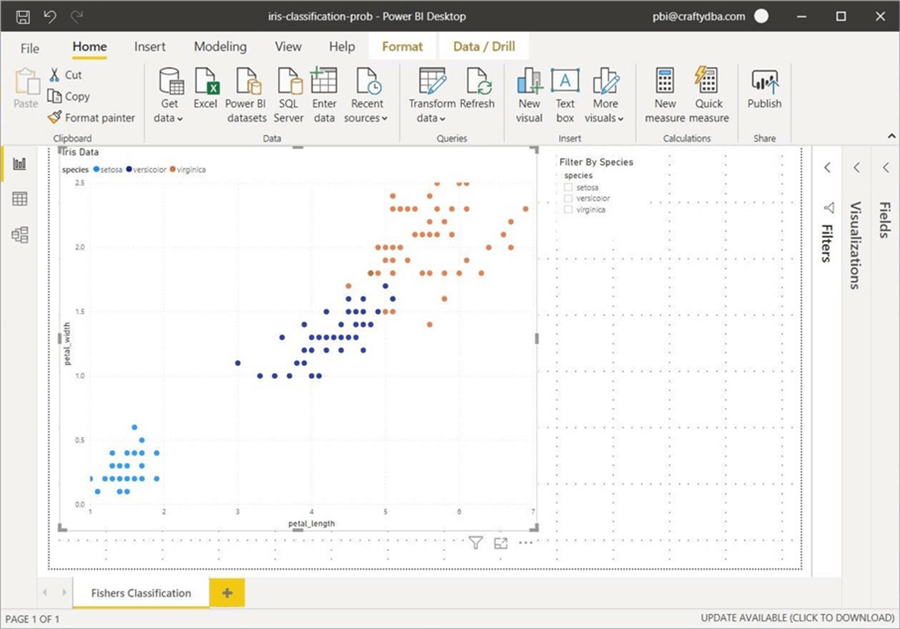
The image below shows the report and dataset named after the Power BI file that was created on premise.

The code below shows how to get information about the imported data set and data source. Since I only have one data set, I can just call the Get-PowerBIDataset cmdlet with a local scope. We can use the Get-PowerBIDatasource cmdlet to retrieve information about the connection that is used to refresh the dataset. In our case, the SQL Server database.
#
# Show published dataset and datasource
#
# Get local dataset
$q3 = Get-PowerBIDataset -Scope Individual
$q3
# Get data source info
Get-PowerBIDatasource -DatasetId $q3.Id
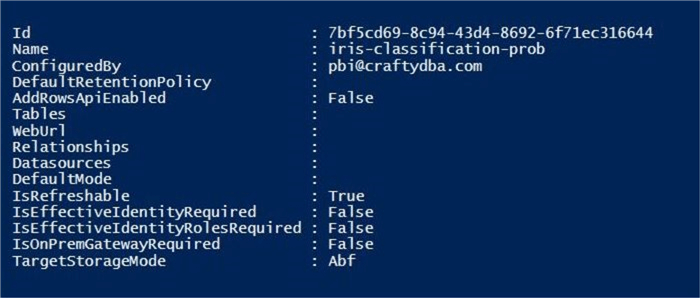
The image below shows the output of the first cmdlet. The imported dataset is stored as an Analysis Services Backup file. Unlike a push dataset, the AddRowsApiEnabled flag is set to False.
The image below shows the output of the Second cmdlet. We can see that a SQL data source is connected to our dataset. A refresh of the dataset will cause the service to communication (chat) with the Azure SQL database.

So, what have we learned with this experiment? First, datasets imported from the desktop designer into the service can’t have rows added afterwards the via API calls. Second, any import data sources store connection information in the cloud service for refreshing the dataset.
Fishers Iris Dataset – Push Dataset
Since this is a very small dataset, can we recreate the whole process using a push dataset? Our junior engineer has supplied the team with a comma separated values file for the Fishers Iris dataset. We notice that species is encode as a category. Not a great way to slice data in Power BI. Therefore, we decide to manually create a lookup table for this experiment.

The code below creates a dataset named ds_Machine_Learning with two tables called tbl_Fishers_Iris and tbl_Species_Lkup. The first dataset is loaded with one call to the REST API service by passing 150 rows as an array of data. The second dataset is loaded with three separate calls to the REST API. One for each type of species.
#
# Data Science (Clustering)
#
# Create table (iris)
$col10 = New-PowerBIColumn -Name "sepal_length" -DataType Double
$col11 = New-PowerBIColumn -Name "sepal_width" -DataType Double
$col12 = New-PowerBIColumn -Name "petal_length" -DataType Double
$col13 = New-PowerBIColumn -Name "petal_width" -DataType Double
$col14 = New-PowerBIColumn -Name "species_id" -DataType Int64
$table3 = New-PowerBITable -Name "tbl_Fishers_Iris" -Columns $col10, $col11, $col12, $col13, $col14

# Create table (species)
$col15 = New-PowerBIColumn -Name "species_id" -DataType Int64
$col16 = New-PowerBIColumn -Name "species_name" -DataType String
$table4 = New-PowerBITable -Name "tbl_Species_Lkup" -Columns $col15, $col16
# Create dataset (machine learning)
$dataset3 = New-PowerBIDataSet -Name "ds_Machine_Learning" -Tables $table3, $table4
# Add to workspace
$dataset4 = Add-PowerBIDataSet -DataSet $dataset3 -WorkspaceId $workspace1.Id
$dataset4
$workspace1 = Get-PowerBIWorkspace -Name "Push Data Sets"
$dataset4 = Get-PowerBIDataSet -Name "ds_Machine_Learning" -WorkspaceId $workspace1.Id
# Load data from file
$data = Import-Csv -Path "C:\Users\jminer\Desktop\iris.csv"
Add-PowerBIRow -DataSetId $dataset4.Id -TableName "tbl_Fishers_Iris" -Rows $data
# Load from code
Add-PowerBIRow -DataSetId $dataset4.Id -TableName "tbl_Species_Lkup" -Rows @{"species_id"=0;"species_name"="setosa"}
Add-PowerBIRow -DataSetId $dataset4.Id -TableName "tbl_Species_Lkup" -Rows @{"species_id"=1;"species_name"="versicolor"}
Add-PowerBIRow -DataSetId $dataset4.Id -TableName "tbl_Species_Lkup" -Rows @{"species_id"=2;"species_name"="virginica"}
The image below was capture when an empty data set was created in the Power BI Service.

We can see the final datasets in the Power BI Service, report designer. Things do not always work out as planned. While we have a species lookup table, the tables are totally disconnected. There is no REST API call that can be used to create a relationship between the tables.

The final report looks like the one posted from the Desktop Designer; However, the species in the report are encoded numerical values and the slicer on the report is not tied to the scatter graph visual.

Of course, this was a contrived example in which I wanted to demonstrate one very important fact. Make sure all the data for a push data set is self-contained since the REST API does not allow for relationships to be created between tables inside the cloud service.
Summary
Microsoft has definitely gained market share in the Business Intelligence reporting area since the release of Power BI in July of 2015. With more users creating and publishing reports daily, it has become a full-time job for an employee to administer the Power BI Service. PowerShell has been the de-facto scripting language for managing objects in the cloud. Today, we investigated how to manage datasets.
Real time data can be captured by either streaming or push datasets. While the streaming dataset can handle more data per day, the actual data disappears from the temporary cache in a timely manner. Also, this cache does not have the ability to be manipulated and used in the Power BI Service like a normal dataset. On the other hand, push datasets are backed by a normal database file in the service and have a user defined retention period. Additionally, all PBI features can be used with this dataset. If your data set is not large, the push dataset is the overall winner.
The Power BI cmdlets which are based upon the REST API can only view information about datasets that are imported into the service. It is important to note that relationships can only be maintained by using the Power BI report designer. This statement is true when it comes to real time datasets. Therefore, it is important to have all required information for reporting in that one dataset.
Two REST API’s calls I did not go over are probably the most important when it comes to datasets. The refresh dataset API comes in both in the my workspace and named (shared) workspace version. This API call is great for refreshing datasets via code instead of a set schedule via the Power BI portal. Please check licensing versus limitations on the number of times per day that a dataset can be refreshed.
Next Steps
- Enclosed is the full script and iris dataset for use in your own investigations.
- Next time, I will be talking about how to use PBI cmdlets to manage reports.
- Investigate PBI cmdlets for reports

John Miner is a Senior Data Architect at Insight Digital Innovation helping corporations solve their business needs with various data platform solutions.
He has over thirty years of data processing experience, and his architecture expertise encompasses all phases of the software project life cycle, including design, development, implementation, and maintenance of systems.
His credentials include undergraduate and graduate degrees in Computer Science from the University of Rhode Island. Also, he has earned certificates from Microsoft for Database Administration (MCDBA), System Administration (MCSA), Data Management & Analytics (MCSE), Data Science (MPP), Databricks Certified, and Fabric Certified.
John has been recognized with the Microsoft MVP award nine times for his outstanding contributions to the Data Platform community.
When he is not busy talking to local user groups or writing blog entries on new technology, he spends time with his wife and daughter enjoying outdoor activities. Some of John’s hobbies include wood working projects, crafting a good beer and playing a game of chess.
- MSSQLTips Awards: Author of the Year – 2019, 2022, 2023 | Champion (100+tips) – 2023


Excelent post, do you know if the relationship of power bi tables can be managed with the MicrosoftPowerBIMgmt.Data module?