Problem
In a previous article, Power BI CONCATENATE Function: How and When to Use it, I wrote about two concatenation functions in DAX that are used to join or concatenate strings together. These functions are the CONCATENATE and the CONCATENATEX functions. However, both are not used in the same way and for the same purpose. In this article, we will look at the CONCATENATEX function in more detail, and we will also demonstrate examples of common business cases where this function could be best used.
Solution
To better understand this function, I will start by describing the makeup of this DAX function and later provide examples of business use cases where the function can be used.
DAX CONCATENATEX Function
In a general, the DAX CONCATENATEX function returns a text string by concatenating the results of an expression evaluated for each row in a table. It is different from the DAX CONCATENATE function in many ways including that it is a table function (DAX functions that end with “X” e.g., MAXX, SUMX, COUNTX, AVERAGEX are table functions). Like other table functions in DAX, the CONCATENATEX function iterates over each row in a table using the visual context as filters.
While choosing to use this DAX function, it is important to understand the following points:
- Like in the case of the CONCATENATE function, if you are using row-level security (RLS) rules or need to create a calculated column in your data that depends on a Direct Query mode, the use of CONCATENATEX function is currently not supported.
- This function takes as its first argument a table or an expression that should return a table.
- The second argument in the CONCATENATEX function is a column containing the values that need to be concatenated, or an expression that returns a value.
- The third parameter is an optional “delimiter“, which is any separator to be used in the concatenation.
- Note that the concatenated values are not automatically sorted in any order, but you can specify a sort order using the “orderBy_expression”. This is the fourth parameter in the syntax which is also optional.
- The fifth parameter is the “Order” parameter which is also optional. It is a value that is used to specify how the “OrderBy_expression” value is sorted. This can accept values like 0 or 1, or alternatively you can use FALSE, TRUE, DESC or ASC.
DAX CONCATENATEX Syntax
The syntax of the DAX CONCATENATEX function is a little bit complex as compared to that of the CONCATENATE function as seen in the syntax code below.
CCONCATENATEX(<table>, <expression>[, <delimiter> [, <orderBy_expression> [, <order>]]...])
So, when and how do you use the DAX CONCATENATEX function? There are several ways Power BI developers would use this function, however, I will describe a very common but powerful use case of this function.
Example Business Case
Let’s say the table below represents a car sales company. The company might want to know what months they sold more or less cars so they can drive business expectations or get insights into their sales for marketing purposes.
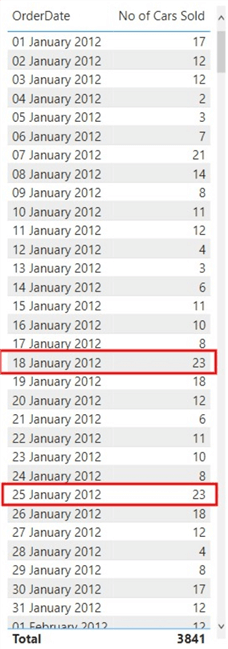
The above table visual might span many years; thus, it would not be logical to do this calculation manually. So, the requirement might be that the company wants to show on a single row for each month the “OrderDates” where they sold more cars and where they sold less cars.
As can be seen in the diagram above, looking at January 2012, we can see that more cars were sold on the 25th and 18th of that month (which was 23 cars sold respectively). So, the business wants to see these two dates in a single row representing January 2012. Similarly, the least number of cars sold in January 2012 was 2 cars which was on the 4th of January 2012. This is the sort of business requirements that CONCATENATEX (along with some other DAX functions) comes in handy.
What we hope to arrive at in the end is something like the table below.

How to Use CONCATENATEX to Meet Business Case
I will now describe how this is done using the DAX CONCATENATEX function. Do note that the final solution is not done using only CONCATENATEX, but a combination of other DAX functions. However, the magic of returning the date strings in single rows is done by the DAX CONCATENATEX function.
- First, create a measure for the “Total Cars Sold” as follows. There is a reason why this should be done first.
Total Cars Sold = SUM(ExampleCarSalesData[No of Cars Sold])
- Next, we will need to create a table that will hold a list of all the dates in the dataset using the VALUES function. For simplicity, we can embed this in a variable in a single measure.
- Then after this, we need to check for the dates in the table created in the second step where the highest or lowest number of cars was sold using MAXX and MINX functions.
- Then, we use the FILTER function to filter out other dates that do not match the dates we have in the third step.
- Next, we use the CONCATENATEX function to return the dates filtered in step four into single rows as seen in the table above.
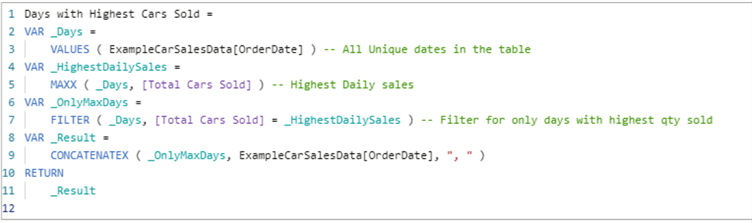
To see how this is done, I will include all the steps above in a single measure calculation using variables to hold the return values as seen in the code below.
For highest cars sold use the code below. low.
 Days with Highest Cars Sold =
VAR _Days =
    VALUES ( ExampleCarSalesData[OrderDate] ) -- All Unique dates in the table
VAR _HighestDailySales =
    MAXX ( _Days, [Total Cars Sold] ) -- Highest Daily sales
VAR _OnlyMaxDays =
    FILTER ( _Days, [Total Cars Sold] = _HighestDailySales ) -- Filter for only days with highest qty sold
VAR _Result =
    CONCATENATEX ( _OnlyMaxDays, ExampleCarSalesData[OrderDate], ", " )
RET    _Result
For fewest cars sold use the code below. low.
Days with Lowest Cars Sold =
VAR _Days =
    VALUES ( ExampleCarSalesData[OrderDate] ) -- All Unique dates in the table
VAR _FewestDailySales =
    MINX ( _Days, [Total Cars Sold] ) -- Lowest Daily sales
VAR _OnlyMinDays =
    FILTER ( _Days, [Total Cars Sold] = _FewestDailySales ) -- Filter for only days with lowest qty sold
VAR _Result =
    CONCATENATEX ( _OnlyMinDays, ExampleCarSalesData[OrderDate], ", " )
RET    _Result

As can be seen in the DAX code above, I have used a comma delimiter in the CONCATENATEX function. I could have used any other delimiter that the business required. Also, note that I have not used the “Total Cars Sold” measure in a variable.
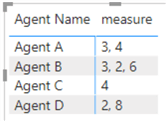
There is another common use case for the CONCATENATEX function in Power BI which involves where a business requires that the values in a column representing a particular category be placed in the same row in the table. For example, take the table below.

The requirement is to ensure all “Scores” for each “Agent Name should be placed in a single row in the table with each score separated with a delimiter like a comma. See the expected output below.
So how do we use the CONCATENATEX function to get to the expected output table as seen above?
To do this, do the following. Create a DAX measure as seen in the DAX code below.
measure = CONCATENATEX (TEX (
VALUES ( 'DemoTable'[Scores]),
'DemoTable'[Scores],
", "
)
Note that I have used a combination of CONCATENATEX function and the VALUES function. Remember we also used the VALUES function in the earlier example we demonstrated above. The VALUES function just helps to return a one column table to hold all unique scores in the table “DemoTable“. See more details on the DAX VALUES function here. Also, note that I have used a comma delimiter in the CONCATENATEX to serve as the separator of the scores, I could have used any other delimiter.
Then to visualize it, just drag in the other columns you need in the table visual and drag in the newly created measure, that would be it.
Alternative Method
We can also achieve the same output table above in a different way, still using CONCATENATEX, but this time we will be creating a table in Power BI using DAX and referencing the original table “DemoTable“. To do this, follow the following steps below.
First, click on the “Modeling” tab in Power BI Desktop, and then click on “New table” as seen below.

Next, create the DAX code as seen below.
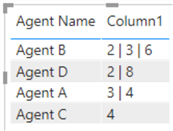
Single_Row =

SUMMARIZE (

    'DemoTable',

    'DemoTable'[Agent Name],

    "Column1", CONCATENATEX ( 'DemoTable', 'DemoTable'[Scores], " | " )
)

Note that I have used the SUMMARIZE function in the code above. Get more information on the DAX SUMMARIZE function here. Also, in the example I used the pipe (|) delimiter instead of a comma delimiter.
As before, to visualize it, just drag in all the columns you have created in the new table calculation. That’s it! You should be able to see the output table visual below.
Summary
In summary, as mentioned earlier, there are other use cases for the CONCATENATEX DAX functions which I have not mentioned in this article. It would be interesting to hear from any reader other ways they have used this function. However, the examples shown here would provide you with a basis for using this DAX function.
Next Steps
- Get some more information on CONCATENATEX function in this Microsoft documentation here.
- Also check this DAX Guide documentation for CONCATENATEX function in Power BI here.
- Learn more about the VALUES DAX function here.
- Learn more about the MAXX DAX function here.
- Learn more about the MINX DAX function here.
- Learn more about the FILTER DAX function here.

Kenneth A. Omorodion is a Microsoft Certified Solutions Associate (MCSA) with 12+ years of enterprise application experience in Power BI, DAX, Microsoft Fabric, Business Intelligence, data warehousing, SSRS, T-SQL, and Azure. Beyond his technical skills, Kenneth has expertise working with stakeholders’ and business leaders to help them better understand key insights. He has a great track record of successfully delivering full life cycle Business Intelligence and data solutions to organizations with measurable business impact.
- MSSQLTips Awards
- Achiever Award (75+ Tips) – 2025
- Author of the Year-2021
- Author Contender-2022/2023/2024


