Problem
Recently I was approached by a colleague to help find a way to deal with an issue with repeated column groups in source data in a way it would be easily usable in Power BI. While there are several YouTube videos and blogs demonstrating various approaches how to deal with this, I still initially had some challenges in applying existing approaches to solve this unique problem. In this article, I will demonstrate in detail the steps I took to normalize the data to make it easier for reporting.
Solution
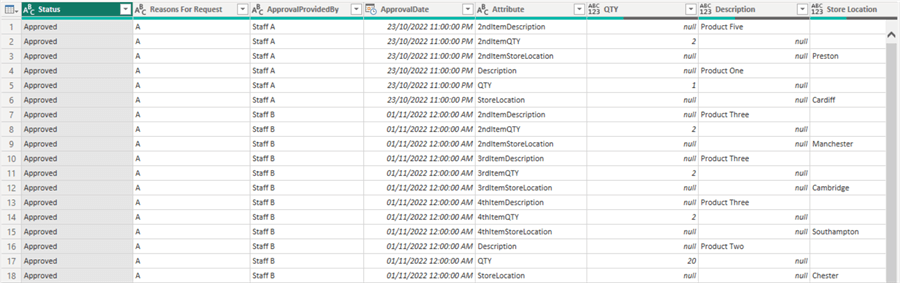
The image below shows a section of the sample raw data, it is typically a result of data entered in a SharePoint list form to allow for multiple data field entries. This could have come from any other source data, but the problem is similar where fields are duplicated in each row.
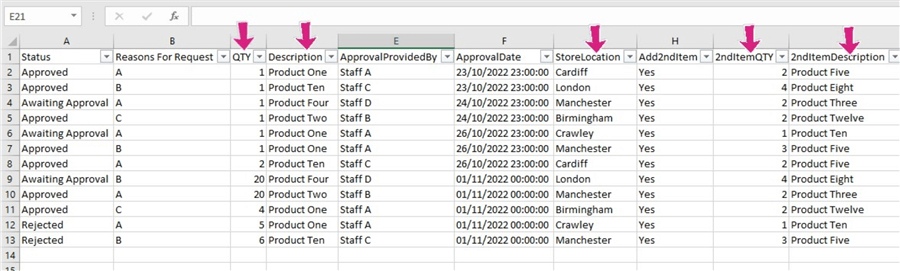
As can be seen in the image above, the column “QTY“, “Description“, and “Store Location” are repetitive. In the full sample dataset, we have “QTY“, “2ndItemQTY“, “3rdItemQTY” and “4thItemQTY” all representing just the QTY information for different entries. This is the same for the “Description” and “StoreLocation” columns. An additional problem is that these column groups are infinite, we can expect users to enter any amount of Item values, so we cannot base our solution on just the available columns currently on the source dataset. Our solution must cover for an infinite number of Item columns entered at any time.
So how do we approach this problem?
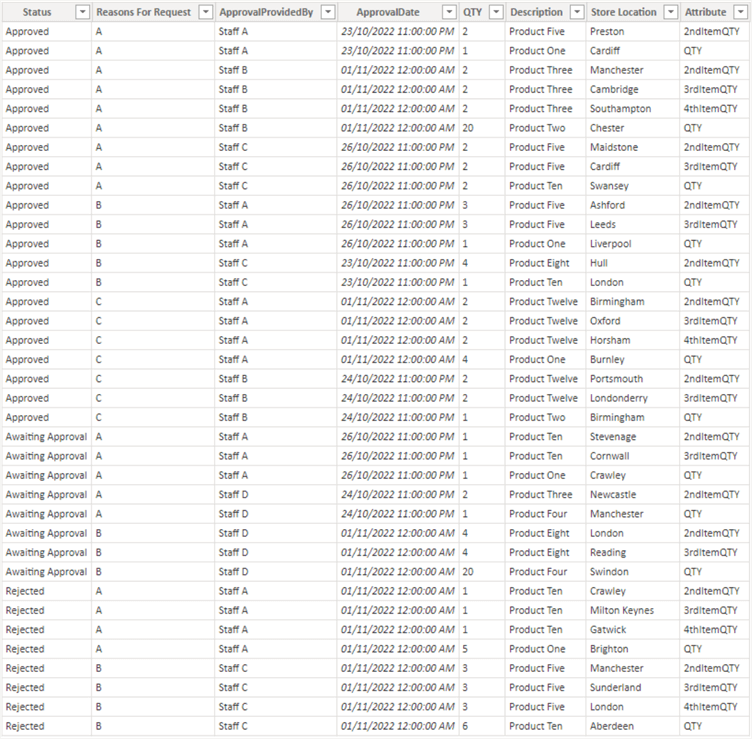
First, let’s see the desired output for the sample dataset. As you can see, after all transformations we only have seven columns in the end no matter the number of additional columns created in the future.
Let’s look at how to solve his problem. To demonstrate this, I have separated the steps as follows:
- Load the dataset into Power Query
- Unpivot the columns we need to have as values
- Remove unwanted columns
- Add a conditional column to unify the attribute names
- Pivot the Metric column
- Study the pattern of each row of data and Fill Up or Down
STEP 1: Load the dataset into Power Query
I will assume that the reader already knows how to bring data into Power Query, so I will not be explaining this in detail. But for those who want to learn more, I will refer you to read some of my other articles here.
Once the data is loaded into Power Query, you can try to do initial cleaning like promoting the headers and assigning appropriate data types to each column where applicable.
STEP 2: Unpivot the columns we need to have as values
The next step is to determine which columns are to be used as the value columns and then unpivot these columns. In this sample dataset, we will be getting our values from the “QTY“, “Description“, and “Store Location” columns. They are the columns that will keep repeating when additional entry is done to the dataset.
To unpivot these columns see the image below.
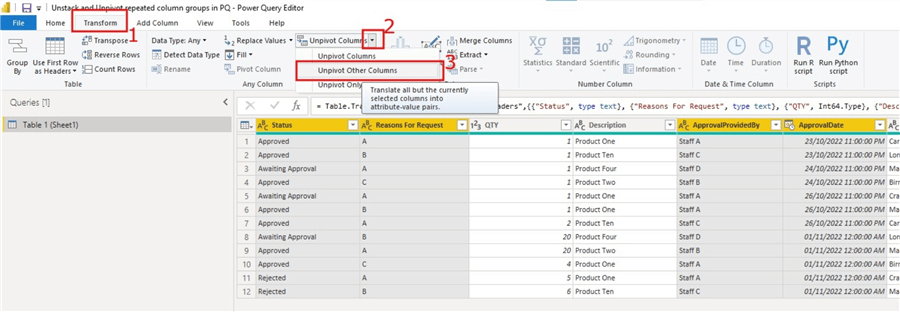
If you take note of the actions on the image above, I have selected the columns I do not want included in the unpivot action and then clicked on the “Transform” on the ribbon, then selected the dropdown on the “Unpivot Columns” and selected “Unpivot Other Columns“. There are other ways of doing this, but this is a simple way.
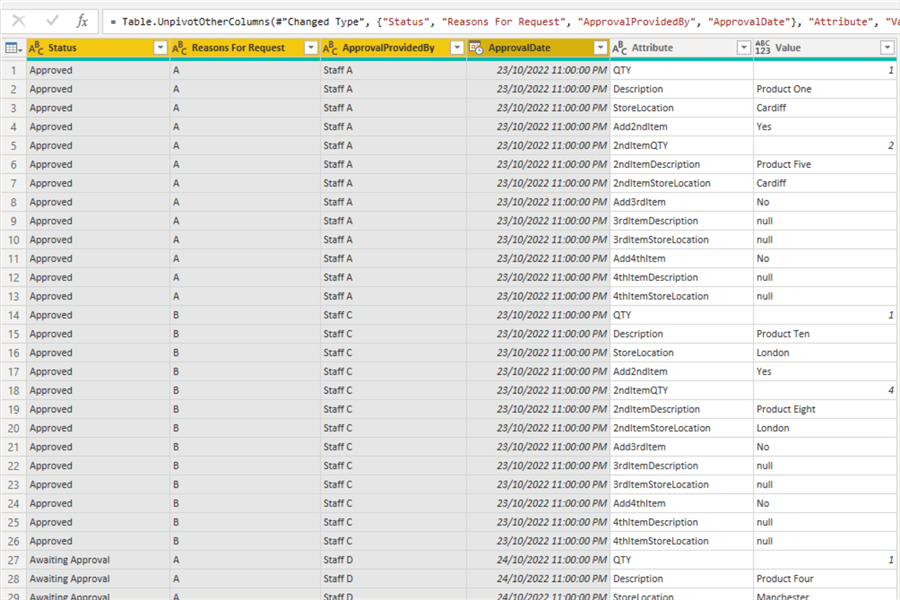
The image below shows the output of doing the unpivot in this step. As you can see, we now have the unpivoted column names in a single column named Attribute and the values in the Value column.
STEP 3: Remove unwanted columns
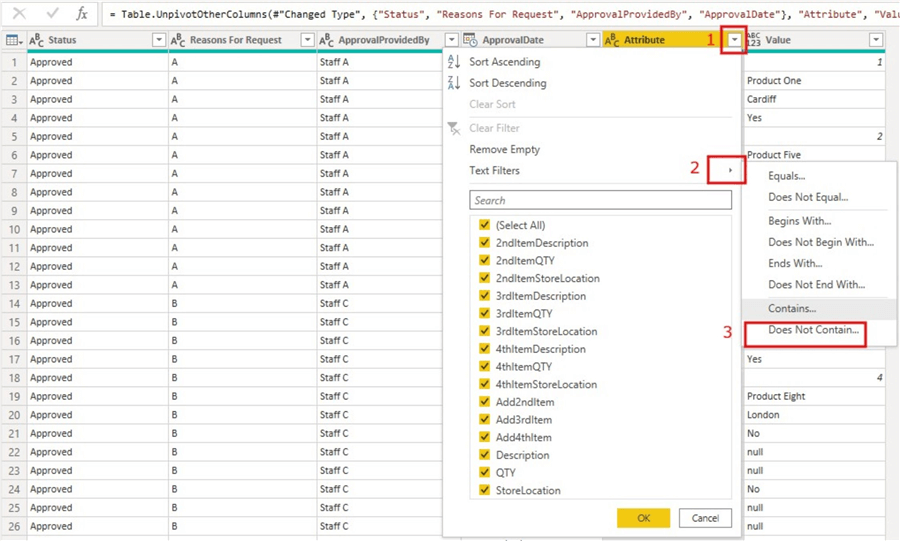
In this step, you can remove/filter out any rows that are not required for reporting or analysis. In this case, I will filter out the “Attribute” column for any values that start with “Add” as these are not required. To do this, click on the dropdown on the “Attribute” column, then click on “Text Filters“, then select “Does Not Contain” as seen in the image below.
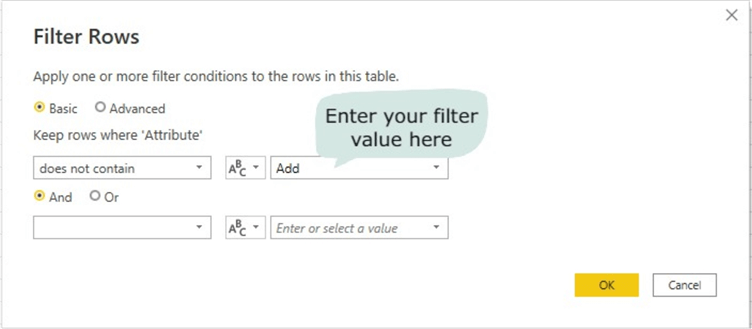
On the resulting window, just enter “Add” as we want to filter out any values in that column that contains “Add“. Please note that this is an optional step as this might not be what is required in your case. See the image below illustrating this filter action.
The output of the “Attribute” column after the filtering step is seen in the image below.

STEP 4: Add a conditional column to unify the attribute names
As you can see in the “Attribute” column, we have repetition of the column names with some having a prefix at the front to show that more than one entry was done. For example, the first entry had a column name of “QTY“, the second entry for the same person for QTY is “2ndItemQTY“. So, if this person entered twenty different items, we would have up to “20thItemQTY“. So, the number of columns is not predictable, thus we need to unify the column names since all QTY values are always Quantity values. The same applies to the other two attributes for Description and StoreLocation.
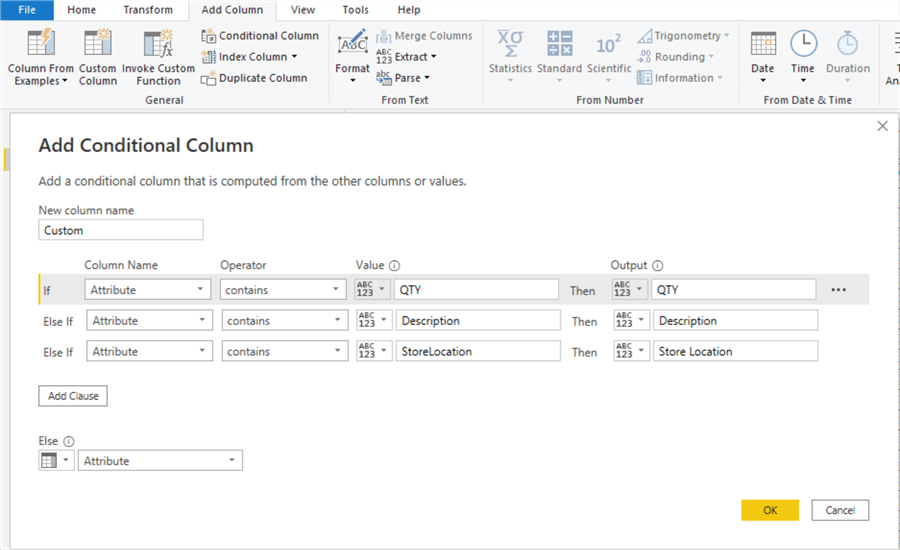
To unify the columns, we will apply logic as follows:
- all rows under the “Attribute” column that contains “QTY” should be known as “QTY“,
- all rows under the “Attribute” column that contains “Description” should be known as “Description“,
- all rows under the “Attribute” column that contains “StoreLocation” should be known as “Store Location“.
The image below illustrates how this is done.
The output of this step is seen in the image below. You can choose to rename and change the data type of the new conditional column, I have renamed the column to “Metric“.

STEP 5: Pivot the Metric column
Next, we need to make a new conditional column (Metric) be individual columns and have their own values.
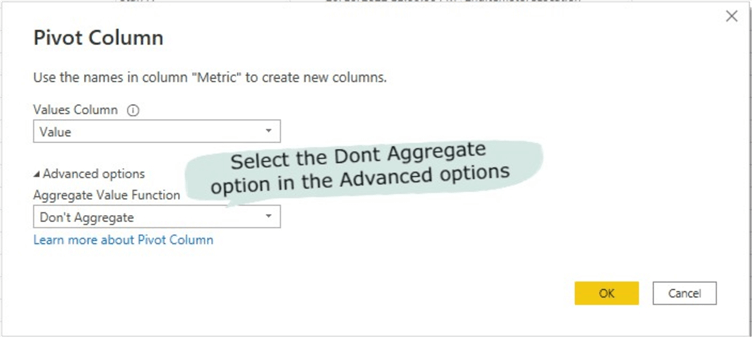
To do this, first click on the column you need to pivot (in this case it is the Metrics column), then click on the “Transform” tab on the ribbon, then select “Pivot Column” as seen in the image below. On the “Values Column” select the values column on the dropdown. Then click on “Advanced options“, and on the “Aggregate Value Function” click on the dropdown and select “Don’t Aggregate“. Learn more about this feature here.
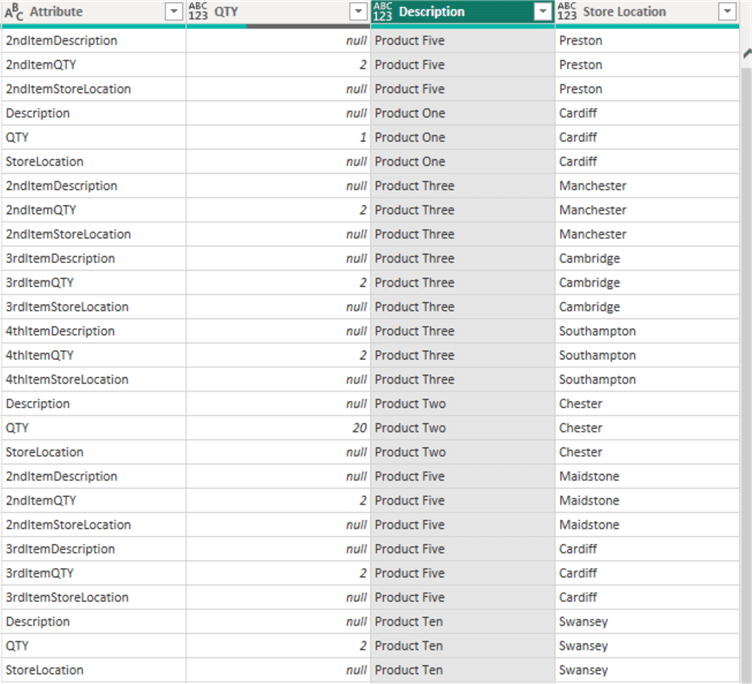
The output of this step is seen in the image below.
An enlarged version of the above image is shown below for clarity.

STEP 6: Study the pattern of each row of data and Fill Up or Down
Next is to study the pattern of each row of data and determine if a “Fill Up” or a “Fill Down” action is required to fill out the necessary data for each row.
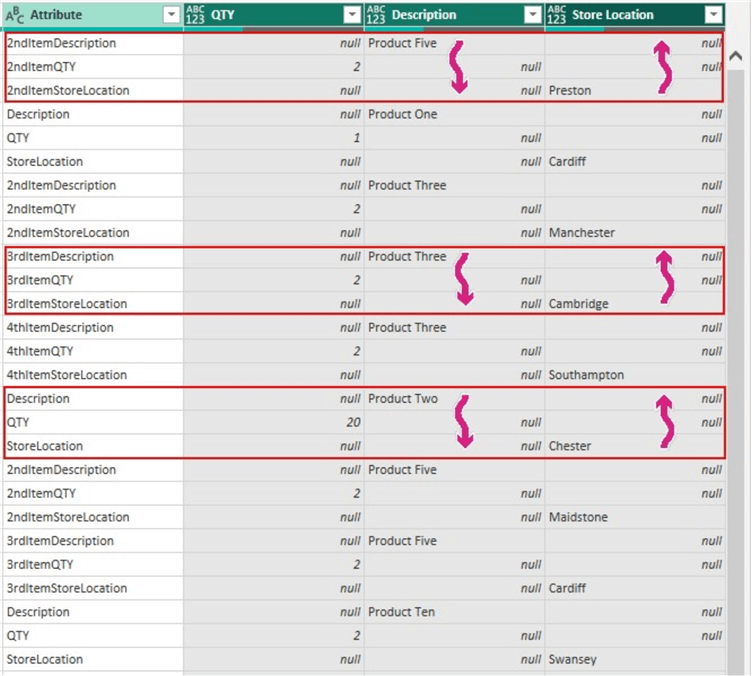
The image below illustrates how I have studied the pattern of each row in this dataset. We can observe that on the first red rectangle, each attribute value represents the same “2ndItem…” value so the values on “QTY“, “Description“, and “Store Location” are related. And further observation shows that it is best to do a Fill Up on the “Store Location” column. For the “Description” column we can do a Fill Down. We will leave the “QTY” column as is.
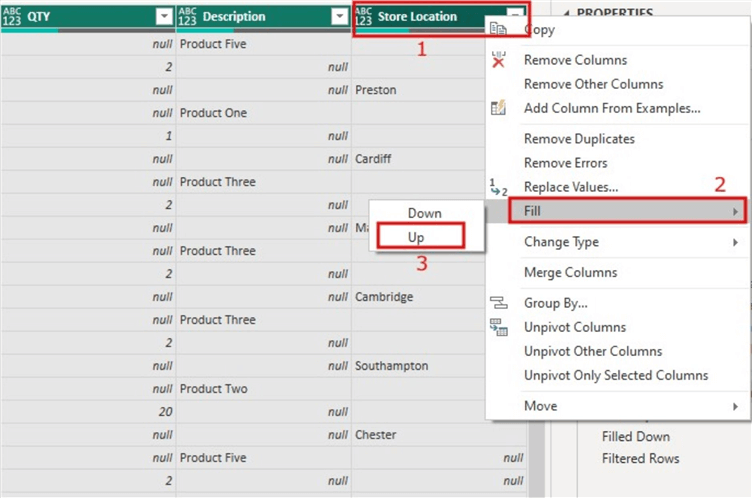
Let’s apply a Fill Up action to the “Store Location” column. To do this, click the column, then right-click and select “Fill“, then select “Up” as seen in the image below.
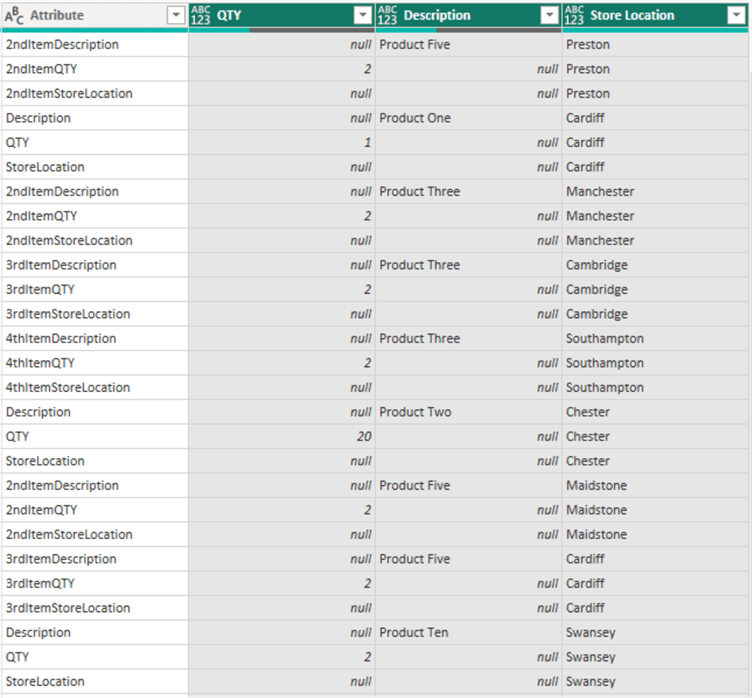
Let’s look at what the output looks like after we apply the Fill Up action as seen in the image below.
As you can see things are looking good now in the “Store Location” column. Next, we need to do a Fill Down on the “Description” column. To do this, we follow the same steps as above, but in this case, we need to select the “Description” column and select “Down” instead of “Up” as seen in the image below.

The output of this action can be seen in the image below.
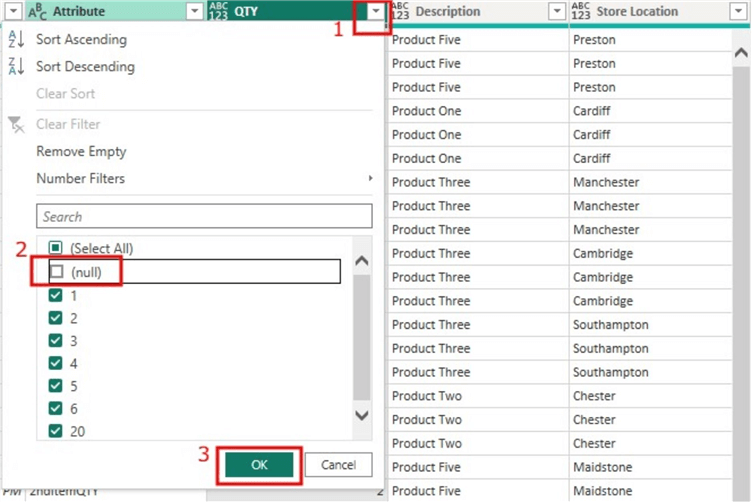
Next, we can filter out any rows that have “null” values on the “QTY” column. This would ensure any rows without a QTY value are not included. To do this we just need to click on the dropdown on the “QTY” column and then simply uncheck the box on “null” as seen in the image below.
The final output of the dataset is seen in the image below.

In summary, this approach was able to account for any additional columns created by users as it was not hard coded anywhere and it’s fully dynamic. Your dataset might be slightly different, but if the requirement is similar, I am sure this approach should work.
For ease of verifying the values, please find the attached Excel workbook to use to compare the original dataset values with the final output.
Next Steps
- See this YouTube video from Goodly on unstack uneven rows into columns here.
- You can read my other blogs here.
- Check out this YouTube video on how to unstack data by Celia Alves.
- Check out this YouTube video on how to convert stacked data into unstack by Excel Basement.
- Read more about Pivoting and Aggregating columns in this Microsoft documentation here.

Kenneth A. Omorodion is a Microsoft Certified Solutions Associate (MCSA) with 12+ years of enterprise application experience in Power BI, DAX, Microsoft Fabric, Business Intelligence, data warehousing, SSRS, T-SQL, and Azure. Beyond his technical skills, Kenneth has expertise working with stakeholders’ and business leaders to help them better understand key insights. He has a great track record of successfully delivering full life cycle Business Intelligence and data solutions to organizations with measurable business impact.
- MSSQLTips Awards
- Achiever Award (75+ Tips) – 2025
- Author of the Year-2021
- Author Contender-2022/2023/2024


Hi Jeff,
Thanks for the compliment. What part is confusing to you?
This is a great article with step by step instructions. I’m just confused. It’s likely that PowerBI was used to Pivot the original data to begin with. Why not just use the original data instead of trying to use PowerBI as a database?