By: Pablo Echeverria | Updated: 2023-06-09 | Comments | Related: > SQL Server and Oracle Comparison
Problem
We've seen in a previous article how to monitor active session queries in SQL Server and Oracle as a reactive way to respond to user complaints. But sometimes, the problems don't show up at the exact moment when we're observing. Fortunately, every database engine contains views with a larger retention time about past queries. These views can help a DBA proactively monitor the cached execution plans, pursuing ways to improve existing queries and, as much as possible, avoid issues before they appear. Still, this information needs to be interpreted correctly, knowing how to query and measure each field and if it's an accumulated value or not.
Solution
In this article, we will see how to find what execution plans are in the cache and their accumulated statistics, the number of times they have been executed, and the number of different execution plans they have.
Oracle Query to Find Queries Statistics
The view that provides the required information is v$sqlstats and the query is provided below:
SELECT
   SQL_FULLTEXT "Text",
   ROWS_PROCESSED "Rows",
   EXECUTIONS "Runs",
   ROUND(EXECUTIONS/EXTRACT(SECOND FROM SYSTIMESTAMP-TO_TIMESTAMP((SELECT MIN(FIRST_LOAD_TIME) FROM GV$SQL S WHERE S.SQL_ID=ST.SQL_ID), 'YYYY-MM-DD/HH24:MI:SS')), 2) "Calls/Sec",
   ROUND(ELAPSED_TIME/1000000,2) "TimeSec",
   ROUND(CPU_TIME/1000000,2) "CpuTimeSec",
   ROUND(APPLICATION_WAIT_TIME/1000000,2) "WaitTimeSec",
   ROUND(CONCURRENCY_WAIT_TIME/1000000,2) "ParallelTimeSec",
   ROUND(CLUSTER_WAIT_TIME/1000000,2) "ClusterTimeSec",
   ROUND(USER_IO_WAIT_TIME/1000000,2) "IOtimeSec",
   ROUND((PHYSICAL_READ_BYTES+PHYSICAL_WRITE_BYTES)/1024/1024/1024,2) "IOinGB",
   ROUND(SHARABLE_MEM/1024/1024/1024,2) "SharableMemGB",
   ROUND(PARSE_CALLS/DECODE(EXECUTIONS, 0, DECODE(PARSE_CALLS, 0, 1, PARSE_CALLS), EXECUTIONS), 2) "Parses/Executions",
   PX_SERVERS_EXECUTIONS "DOP",
   LOADS "Loads",
   VERSION_COUNT "VersionCount",
   SORTS/1000 "SortsK",
   DISK_READS/1000 "DiskReadsK",
   'SELECT PLAN_TABLE_OUTPUT FROM TABLE(DBMS_XPLAN.DISPLAY_CURSOR('''||SQL_ID||''',NULL,''ALL +PEEKED_BINDS''));' "ViewPlan"
FROM GV$SQLSTATS ST
ORDER BY (
   SELECT MAX(COLUMN_VALUE)
   FROM SYS.ODCINUMBERLIST(
      EXECUTIONS/EXTRACT(SECOND FROM SYSTIMESTAMP-TO_TIMESTAMP((SELECT MIN(FIRST_LOAD_TIME) FROM GV$SQL S WHERE S.SQL_ID=ST.SQL_ID), 'YYYY-MM-DD/HH24:MI:SS')),
      ELAPSED_TIME/1000000, CPU_TIME/1000000, APPLICATION_WAIT_TIME/1000000, CONCURRENCY_WAIT_TIME/1000000, CLUSTER_WAIT_TIME/1000000,
      USER_IO_WAIT_TIME/1000000, (PHYSICAL_READ_BYTES+PHYSICAL_WRITE_BYTES)/1024/1024/1024, SHARABLE_MEM/1024/1024/1024,
      PARSE_CALLS/DECODE(EXECUTIONS, 0, DECODE(PARSE_CALLS, 0, 1, PARSE_CALLS), EXECUTIONS),
      PX_SERVERS_EXECUTIONS, LOADS, VERSION_COUNT, SORTS/1000, DISK_READS/1000)) DESC;
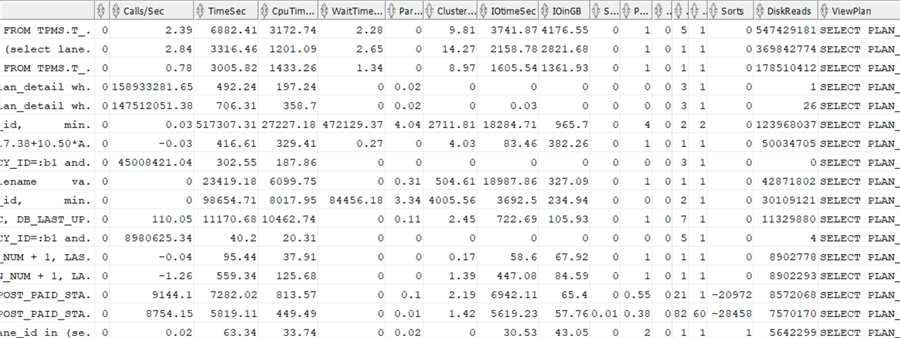
A sample output is below:

The columns are as follows:
- Text: This is the whole statement, this field is character large object (CLOB).
- Rows: Last number of rows the statement returned.
- Runs: Number of times the statement has been executed.
- Calls/Sec: Number of executions divided by the seconds since the plan was created.
- TimeSec: Last amount of time the query took to run (including its child threads), not accumulated.
- CpuTimeSec: Last number of seconds spent by the query in each CPU (sum of all CPUs), not accumulated.
- WaitTimeSec: Last number of seconds the application has been waiting, not accumulated.
- ParallelTimeSec: Last number of seconds coordinating with other threads, not accumulated.
- ClusterTimeSec: Last number of seconds coordinating with other nodes, not accumulated.
- IOtimeSec: Number of seconds waiting on I/O, accumulated.
- IOinGB: Amount of I/O in GB for both reads and writes, accumulated.
- SharableMemGB: Last amount of memory used by the execution plan, not accumulated.
- Parses/Executions: Number of times the statement has been parsed, divided by the number of executions. Ideally, this value should be less than one (one parse for all executions), and it's worse as it gets higher.
- DOP: Last degree of parallelism.
- Loads: Number of times the plan has been loaded into memory; high values indicate there has been memory pressure.
- VersionCount: Number of execution plans for the same statement; high values indicate there has been library cache contention and requires bind variables and reusable code (not generated on the fly).
- SortsK: Last number of sorts divided by 1000, not accumulated; high values indicate there has been high CPU and TEMP usage, and you need to check the indexes.
- DiskReadsK: Number of reads divided by 1000, accumulated.
- ViewPlan: Statement to view the execution plan of the statement. With this SQL_ID, you can also run the SQL Tuning Advisor to find ways to improve it: How Can we Run SQL Tuning Advisor For A SQL ID In Oracle Database.
As you can see, in this view there are only three fields with accumulated information across all executions: IOtimeSec, IOinGB, and DiskReadsK. You can divide this value by the number of runs to have an average value or use another view to get the exact value for each execution. Some fields consider all executions: Runs, Calls/Sec, Parses/Executions, Loads, and VersionCount.
SQL Server Query to Find Queries Statistics
The view that provides the required information is again sys.dm_exec_query_stats, but the information needs to be aggregated differently than how we saw it in the previous article. The query is below, but note that the columns [max_dop], [max_reserved_threads], [max_used_threads], [max_grant_kb], [max_used_grant_kb] are only available in SQL Server 2016 and greater:
SELECT
   DB_NAME(ISNULL([t].[dbid],
   (SELECT CAST([value] AS SMALLINT) FROM [sys].[dm_exec_plan_attributes]([st].[plan_handle]) WHERE [attribute] = 'dbid'))) [DatabaseName],
   ISNULL(OBJECT_NAME([t].[objectid], [t].[dbid]),'{AdHocQuery}') [Proc/Func],
   MIN(SUBSTRING([t].[text], ([st].[statement_start_offset]/2)+1, ((CASE [st].[statement_end_offset] WHEN -1 THEN DATALENGTH([t].[text]) ELSE [st].[statement_end_offset] END - [st].[statement_start_offset])/2)+1)) [Text],
   MAX([st].[max_rows]) [Rows],
   SUM([st].[execution_count]) [Runs],
   SUM([st].[execution_count])/(SELECT MAX(v) FROM (VALUES (DATEDIFF(ss,MIN([st].[creation_time]),GETDATE())), (1)) AS VALUE(v)) [Calls/Sec],
   SUM([st].[max_elapsed_time])/1000000 [TimeSec],
   SUM([st].[max_worker_time])/1000000 [CpuTimeSec],
   SUM([st].[max_logical_reads]+[st].[max_logical_writes])*8/1024/1024 [IOinGB],
   MAX([st].[max_dop]) [DOP],
   SUM([st].[max_reserved_threads])-SUM([st].[max_used_threads]) [ThreadsExceeded],
   (SUM([st].[max_grant_kb])-SUM([st].[max_used_grant_kb]))/1024 [MemoryExceededMb],
   'SELECT [query_plan] FROM [sys].[dm_exec_query_plan](0x'+CONVERT(VARCHAR(MAX),[st].[plan_handle],2)+')' [ViewPlan]
FROM [sys].[dm_exec_query_stats] [st]
CROSS APPLY [sys].[dm_exec_sql_text]([st].[sql_handle]) [t]
GROUP BY [st].[query_hash], [st].[plan_handle], [t].[dbid], [t].[objectid]
ORDER BY (SELECT MAX(v) FROM (VALUES
   (SUM([st].[execution_count])/(SELECT MAX(v) FROM (VALUES (DATEDIFF(ss,MIN([st].[creation_time]),GETDATE())), (1)) AS VALUE(v))),
   (SUM([st].[max_elapsed_time])/1000000),
   (SUM([st].[max_worker_time])/1000000),
   (SUM([st].[max_logical_reads]+[st].[max_logical_writes])*8/1024/1024),
   (MAX([st].[max_dop])),
   (SUM([st].[max_reserved_threads])-SUM([st].[max_used_threads])),
   ((SUM([st].[max_grant_kb])-SUM([st].[max_used_grant_kb]))/1024)) AS VALUE(v)) DESC;
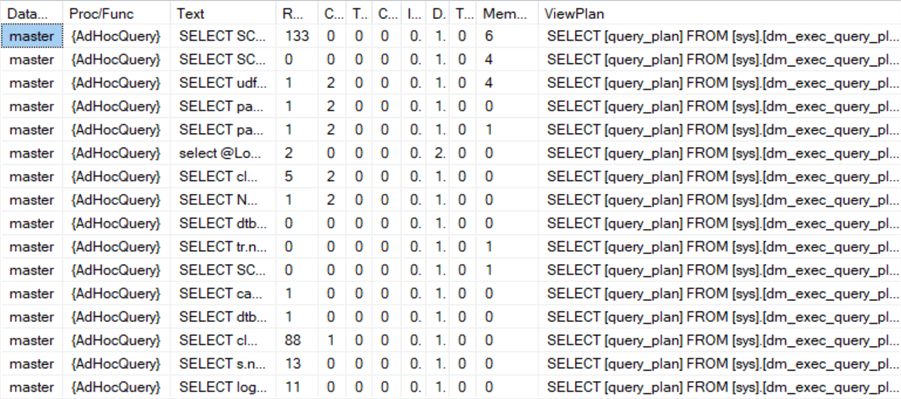
A sample output is below:

The columns are as follows:
- DatabaseName: The name of the database where the query ran.
- Proc/Func: The name of the procedure or function, or {AdHocQuery} if it's sent directly.
- Text: The text of the statement which was run.
- Rows: Maximum number of the returned rows.
- Runs: Number of times the statement has been executed.
- Calls/Sec: Number of executions divided by the number of seconds since the plan creation time (if available, otherwise 1). If this value is high, you will likely benefit from improving this query to run as fast as possible with the smallest amount of resources.
- TimeSec: Number of seconds this statement ran, accumulated.
- CpuTimeSec: Number of seconds the statement used CPU, accumulated.
- IOinGB: Amount of I/O in GB for both reads and writes, accumulated.
- DOP: Maximum degree of parallelism from all executions.
- ThreadsExceeded: Difference between reserved threads and used threads, accumulated. Anything above 0 indicates you must examine the execution plan because what the engine expects is not what it is doing. You need the estimated execution plan to match as close as possible with the actual execution plan.
- MemoryExceededMb: Difference between expected memory and used memory, accumulated. Anything above 0 indicates you must examine the execution plan because what the engine expects is not what it is doing. You need the estimated execution plan to match as close as possible with the actual execution plan.
- ViewPlan: Statement to view the execution plan of the statement and find ways to improve it.
Note: We didn't aggregate the session and connections information because we wanted to view the statistics of all cached queries. As you can see, we've accumulated the information across all executions in the columns: TimeSec, CpuTimeSec, IOinGB, ThreadsExceeded, and MemoryExceededMb. You can divide this value by the number of runs to have an average value. Also, some fields only provide the maximum value across all executions: Rows and DOP. And some fields consider all executions: Runs and Calls/Sec.
Conclusion
These views have a longer retention time and can help you troubleshoot expensive queries that are not currently running to find the most expensive ones. A report could be executed multiple times daily to identify what can be improved. In Oracle, the information is already grouped, so you can't see the maximum or average, but in SQL Server, you have one row per execution, so you can group as needed.
Next Steps
- The official documentation for Oracle: 9.76 V$SQLSTATS
- The official documentation for SQL Server: sys.dm_exec_query_stats (Transact-SQL)
About the author
 Pablo Echeverria is a talented database administrator and C#.Net software developer since 2006. Pablo wrote the book "Hands-on data virtualization with Polybase". He is also talented at tuning long-running queries in Oracle and SQL Server, reducing the execution time to milliseconds and the resource usage up to 10%. He loves learning and connecting new technologies providing expert-level insight as well as being proficient with scripting languages like PowerShell and bash. You can find several Oracle-related tips in his LinkedIn profile.
This author pledges the content of this article is based on professional experience and not AI generated.
View all my tips
Article Last Updated: 2023-06-09


