Problem
In previous articles, we covered:
- Active Session Queries to view execution plans of active sessions running.
- Query Statistics to Improve Performance to view all cached execution plans for the same query.
In this article, we look at how to get historical performance stats.
Solution
In this article, we will see how to query a statement’s historical stats to find out if there was a better execution plan in the past that can be used to improve a query’s performance.
Oracle
We can get the historical information with the query below:
-- source: https://www.mssqltips.com
SELECT
   T.SQL_TEXT "Text",
   S.SQL_ID "SqlId",
   S.PLAN_HASH_VALUE "Plan",
   S.INSTANCE_NUMBER "Instance",
   S.OPTIMIZER_MODE "OptimizerMode",
   S.SQL_PROFILE "SqlProfile",
   S.OPTIMIZER_COST "OptimizerCost",
   ROUND(S.SHARABLE_MEM/1024/1024/1024,2) "SharedMemGB",
   S.VERSION_COUNT "Versions",
   S.FETCHES_TOTAL "Fetches",
   S.END_OF_FETCH_COUNT_TOTAL "FetchEndCount",
   S.SORTS_TOTAL "Sorts",
   S.EXECUTIONS_TOTAL "Runs",
   S.PX_SERVERS_EXECS_TOTAL "DOP", S.LOADS_TOTAL "Loads",
   S.PARSE_CALLS_TOTAL "ParseCalls",
   ROUND(S.CPU_TIME_TOTAL/1000000,2) "CpuTime",
   ROUND(S.ELAPSED_TIME_TOTAL/1000000,2) "ElapsedTime",
   ROUND(S.IOWAIT_TOTAL/1000000,2) "IOWait",
   ROUND(S.CCWAIT_TOTAL/1000000,2) "ConcurrentWait",
   ROUND(S.IO_INTERCONNECT_BYTES_TOTAL/1024/1024/1024,2) "IOInterconnectGB",
   ROUND((S.PHYSICAL_READ_BYTES_TOTAL+S.PHYSICAL_WRITE_BYTES_TOTAL)/1024/1024/1024,2) "IOinGB",
   S.OBSOLETE_COUNT "ObsoleteCount",
   S.DISK_READS_TOTAL "DiskReads",
   S.BUFFER_GETS_TOTAL "BufferGets",
   S.ROWS_PROCESSED_TOTAL "RowsProcessed",
   S.BIND_DATA "Data"
FROM DBA_HIST_SQLSTAT S
 INNER JOIN DBA_HIST_SQLTEXT T ON T.SQL_ID = S.SQL_ID
ORDER BY (
    SELECT MAX(COLUMN_VALUE) FROM SYS.ODCINUMBERLIST(
       S.OPTIMIZER_COST, S.SHARABLE_MEM/1024/1024/1024, S.LOADED_VERSIONS, S.VERSION_COUNT,
       S.FETCHES_TOTAL, S.END_OF_FETCH_COUNT_TOTAL, S.SORTS_TOTAL, S.EXECUTIONS_TOTAL,
       S.PX_SERVERS_EXECS_TOTAL, S.LOADS_TOTAL, S.PARSE_CALLS_TOTAL, S.CPU_TIME_TOTAL/1000000,
       S.ELAPSED_TIME_TOTAL/1000000, S.IOWAIT_TOTAL/1000000, S.CCWAIT_TOTAL/1000000,
       S.IO_INTERCONNECT_BYTES_TOTAL/1024/1024/1024,
       (S.PHYSICAL_READ_BYTES_TOTAL+S.PHYSICAL_WRITE_BYTES_TOTAL)/1024/1024/1024,
       S.IO_OFFLOAD_RETURN_BYTES_TOTAL/1024/1024/1024, S.OBSOLETE_COUNT)) DESC;
A sample output is below:

The columns are as follows:
- Text: the text of the statement being run.
- SqlId: id of the statement being run.
- Plan: numerical representation of the execution plan.
- Instance: instance number in a RAC.
- OptimizerMode: mode under which the statement is run.
- SqlProfile: name of the applied profile.
- OptimizerCost: cost of the query given by the optimizer.
- SharedMemGB: amount of shared memory used.
- Versions: number of plans for the statement.
- Fetches: cumulative number of fetches for the statement.
- FetchEndCount: cumulative number of times the statement completed successfully.
- Sorts: cumulative number of sorts for the statement.
- Runs: cumulative number of times the plan has been executed.
- DOP: cumulative number of parallel executions of the statement.
- Loads: cumulative number of times the plan has been loaded.
- ParseCalls: cumulative number of parse calls for the statement.
- CpuTime: cumulative number of seconds used for parsing/executing/fetching.
- ElapsedTime: cumulative number of seconds executing the query in all RAC nodes.
- IOWait: cumulative number of seconds waiting for I/O.
- ConcurrentWait: cumulative number of seconds waiting for concurrency.
- IOinterconnectGB: cumulative amount of data retrieved from the storage system.
- IOinGB: cumulative amount of I/O in GB for both reads and writes.
- ObsoleteCount: number of times the plan has become obsolete.
- DiskReads: cumulative number of disk reads for the statement.
- BufferGets: cumulative number of buffer gets for the statement.
- RowsProcessed: cumulative number of returned rows.
- Data: bind data.
The information is sorted to return the worst plans at the top; if you’re struggling with a query using a plan in the top results, you can filter for that specific query and find if there are better options for it.
SQL Server
By default, SQL Server versions 2016 to 2019 do not track historical query information; it only occurs in version 2022 and Azure (SQL Database and SQL Managed Instance). This can be enabled manually with the command below, but there are many other options to customize it as needed:
ALTER DATABASE [MyDb] SET QUERY_STORE = ON;
Once enabled, we can get the historical information with the query below (note it has only been tested in SQL Server 2019):
-- source: https://www.mssqltips.com
USE [MyDb];
SELECT
   [p].[plan_id] [PlanId],
   [t].[query_sql_text] [Text],
   TRY_CAST([p].[query_plan] AS XML) [Plan],
   [rs].[count_executions] [Runs],
   [rs].[count_executions]/(SELECT MAX(v) FROM (VALUES (DATEDIFF(ss,[q].[initial_compile_start_time],GETDATE())), (1)) AS VALUE(v)) [Calls/Sec],
   [rs].[avg_duration]/1000000 [DurationSec],
   [rs].[avg_cpu_time]/1000000 [CpuTimeSec],
   ([rs].[avg_logical_io_reads]+[rs].[avg_logical_io_writes])*8/1024/1024 [IOinGB],
   [rs].[avg_tempdb_space_used]*8/1024/1024 [TempGB],
   [rs].[avg_query_max_used_memory]*8/1024/1024 [MemGB],
   [rs].[avg_dop] [DOP],
   [rs].[avg_rowcount] [Rows],
   (SELECT MAX([avg_query_wait_time_ms])/1000
             FROM [sys].[query_store_wait_stats] [w]
            WHERE [w].[plan_id] = [p].[plan_id]
              AND [w].[runtime_stats_interval_id] = [rs].[runtime_stats_interval_id]
              AND [w].[execution_type] = [rs].[execution_type]
              AND [w].[wait_category_desc] = 'CPU') [WaitCpuSec],
   (SELECT MAX([avg_query_wait_time_ms])/1000
             FROM [sys].[query_store_wait_stats] [w]
            WHERE [w].[plan_id] = [p].[plan_id]
              AND [w].[runtime_stats_interval_id] = [rs].[runtime_stats_interval_id]
              AND [w].[execution_type] = [rs].[execution_type]
              AND [w].[wait_category_desc] = 'Network IO') [WaitNetworkIOSec],
   (SELECT MAX([avg_query_wait_time_ms])/1000
             FROM [sys].[query_store_wait_stats] [w]
            WHERE [w].[plan_id] = [p].[plan_id]
              AND [w].[runtime_stats_interval_id] = [rs].[runtime_stats_interval_id]
              AND [w].[execution_type] = [rs].[execution_type]
              AND [w].[wait_category_desc] = 'Memory') [WaitMemorySec],
   [q].[count_compiles] [Compiles], [q].[avg_compile_duration]/1000000 [CompileTimeSec],
   [q].[avg_bind_duration]/1000000 [BindTimeSec], [q].[avg_bind_cpu_time]/1000000 [BindCpuTimeSec],
   [q].[avg_optimize_duration]/1000000 [OptimizeTimeSec], [q].[avg_optimize_cpu_time]/1000000 [OptimizeCpuTimeSec],
   [q].[avg_compile_memory_kb]/1024/1024 [CompileMemGB]
FROM [sys].[query_store_query] [q]
 INNER JOIN [sys].[query_store_query_text] [t] ON [t].[query_text_id] = [q].[query_text_id]
 INNER JOIN [sys].[query_store_plan] [p] ON [p].[query_id] = [q].[query_id]
 INNER JOIN [sys].[query_store_runtime_stats] [rs] ON [rs].[plan_id] = [p].[plan_id]
ORDER BY (SELECT MAX(v) FROM (VALUES
   ([rs].[count_executions]/(SELECT MAX(v) FROM (VALUES (DATEDIFF(ss,[q].[initial_compile_start_time],GETDATE())), (1)) AS VALUE(v))),
   ([rs].[avg_duration]/1000000),
   ([rs].[avg_cpu_time]/1000000),
   (([rs].[avg_logical_io_reads]+[rs].[avg_logical_io_writes])*8/1024/1024),
   ([rs].[avg_tempdb_space_used]*8/1024/1024),
   ([rs].[avg_query_max_used_memory]*8/1024/1024),
   ([rs].[avg_dop])) AS VALUE(v)) DESC;
A sample output is below:
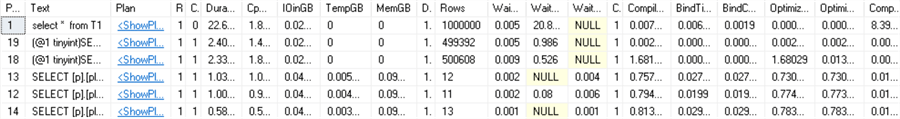
The columns are as follows:
- PlanId: id of the plan in query store.
- Text: the text of the statement which was run.
- Plan: graphical representation of the plan; you can click on it to view it.
- Runs: number of times the statement has been executed.
- Calls/Sec: number of executions divided by the number of seconds since the plan creation time (if available, otherwise 1).
- DurationSec: number of seconds this statement ran.
- CpuTimeSec: number of seconds the statement used CPU.
- IOinGB: amount of I/O in GB for both reads and writes.
- TempGB: tempDB space used in GB.
- MemGB: used memory in GB.
- DOP: degree of parallelism.
- Rows: number of returned rows.
- WaitCpuSec: number of seconds the statement waited on CPU.
- WaitNetworkIOSec: number of seconds the statement waited on network IO.
- WaitMemorySec: number of seconds the statement waited on memory.
- Compiles: number of times the statement has been compiled.
- CompileTimeSec: number of seconds of the compile operation.
- BindTimeSec: number of seconds of the bind operation.
- BindCpuTimeSec: number of seconds the bind operation used CPU.
- OptimizeTimeSec: number of seconds of the optimize operation.
- OptimizeCpuTimeSec: number of seconds the optimize operation used CPU.
- CompileMemGB: amount of memory for the compile operation in GB.
The information is sorted to return the worst plans at the top; if you’re struggling with a query using a plan in the top results, you can filter for that specific query and find if there are better options for it.
Conclusion
Although Oracle and SQL Server return different information, you can use the data to get historical query statistics and force a specific execution plan (if needed). Note: there are many ways to do it, and the good news is that even if you can’t change the code, it can be forced in certain cases. Oracle returns accumulated statistics for each execution plan, and this information is aggregated since the instance startup. SQL Server returns the average, min, max, and standard deviation for each plan, but we’ve used the average statistics. You can use a different column if needed and aggregate the information.
Next Steps
- Here is the official documentation for Oracle:
- Here is the official documentation for SQL Server:

Pablo Echeverria has worked for more than 10 years as a software programmer and analyst, during which time I studied parallel programming and became a senior programmer specialist. Afterward, he switched to a DBA position implementing new processes and creating better monitoring tools, while growing his data scientist skills to improve my customer’s businesses. Check out Pablo’s most recent book, “Hands-on Data Virtualization with Polybase“. This book brings exciting coverage on establishing and managing data virtualization using Polybase. It teaches how to configure Polybase on almost all relational and nonrelational databases, to setup a test environment for any tool or software instantly without any hassle, and to rapidly design and build high performing data warehousing solutions.
- MSSQLTips Awards: Rising Star (50+ tips) – 2024 | Author Contender – 2018, 2022, 2023 | Rookie Contender – 2017