Problem
As the world moves from conventional desktop data transformation to a more cloud and enterprise-based solution, getting big data cleaned, well-structured, and ready for analytic insight is becoming a top priority for most enterprise firms.
Solution
The need for a self-service analytic solution for business intelligence (BI) users that allows them to perform the whole ETL process without the need for support from IT or BI experts is the goal. Users can thus analyze data, produce reports, and develop dashboards without being proficient in writing SQL or utilizing sophisticated statistical applications.
A business intelligence solution that provides all these features allowing developers to perform data transformation on the Power BI services is known as dataflows. In other words, dataflows are known as Power Query online. In this article, I will walk through different applications using Power BI dataflows and how to connect with various data sources.
What are Power BI Dataflows?
Power BI dataflows is cloud-based and enables the creation and administration of reusable data transformations to help Power BI reports and dashboards operate better and be more accurate. When using dataflows, the destination of the data is usually Azure Data Lake Storage, Dataverse, or other location, unlike Power BI desktop Power Query which loads data into the dataset.

Microsoft Dataflows Architecture
When to Use Dataflows
Dataflows are called Power Query online and can be used in the following scenarios:
- Reusability: This creates a reusable transformation logic that can be used by numerous datasets and reports. By encouraging the reuse of core data components, dataflows eliminate the need for separate connections to your cloud or on-premises data sources.
- Storage: Data in Dataflows are usually stored in Azure Data Lake Gen 2, which provides a secure way of storing your data.
- ETL Process: Dataflows with Power BI Premium scale more effectively and allow you more options if you want to work with massive data volumes and do ETL at scale.
Project Architecture
For this article, I will walk through how to connect Power BI dataflows to different data sources, both cloud and on-premises, and we will create a parameter that will help us switch between data sources easily if one source is down.

Project Architecture
Create Dataflows
Dataflow is a collection of tables created and managed in a workspace. Directly from the workspace where your dataflow is created, you can add and change tables, control data schedules refresh, and more.
In your Power BI workspace, you can check our previous article on creating a workspace, Securities in Power BI. Click on the New icon at the top left corner, then select Dataflows. This will take you to another window.

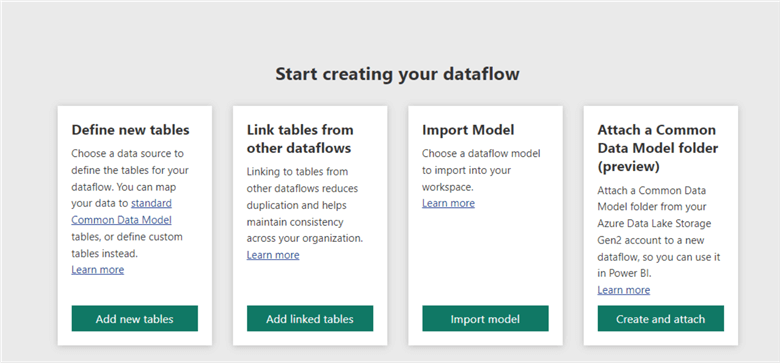
In the new window of dataflow, we are provided with four options. You are expected to select any option based on how you want to create your dataflow.
Connect Dataflow to SharePoint Folder
SharePoint is a web-based collaboration and document platform naturally integrated with the Microsoft 365 suite. Launched in 2001, it is a central hub for businesses to store, arrange, exchange, and work together on many kinds of content, including files, lists, papers, and web pages.
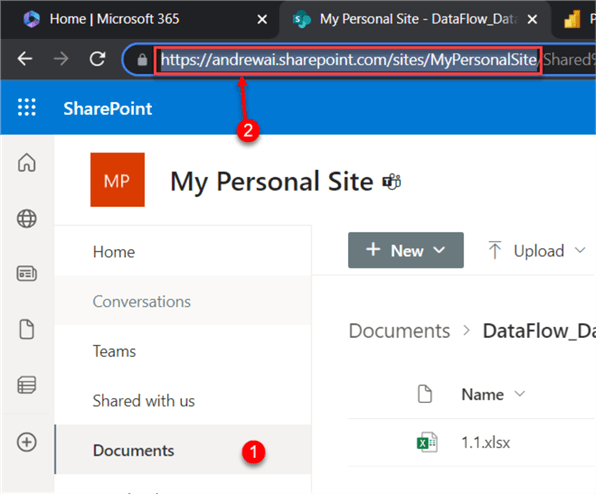
Step 1: Get SharePoint URL Link
In your SharePoint site, navigate to the document tab at the left corner. On the URL tab, copy the URL till you get to the “Site name.”
Note: You are not expected to copy the entire link on the path, just the part of the SharePoint site.
Step 2: Dataflow Get SharePoint Folder
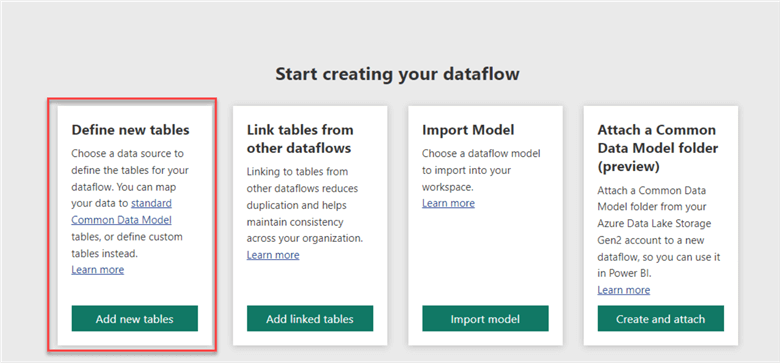
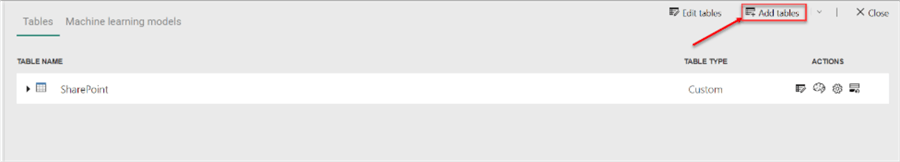
In your Dataflow environment, click “Add new tables,” which will open a new window.
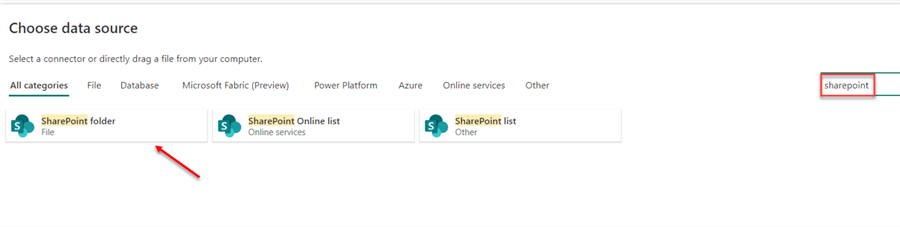
In the new window, search for the SharePoint folder, then select the SharePoint folder.
Step 3: Connection Settings
In the connection settings, you are expected to fill in the following:
- Site URL: This is the link from the SharePoint site earlier.
- Gateway: No gateway is needed since the data source is cloud-based.
- Authentication kind: This is set to the organization account used in logging in.
Click on the Next button at the bottom right to load the data.

Step 4: Transform Data
In the dataflow preview environment, click on the transform data. This will take you to the Power Query editor environment for dataflow.
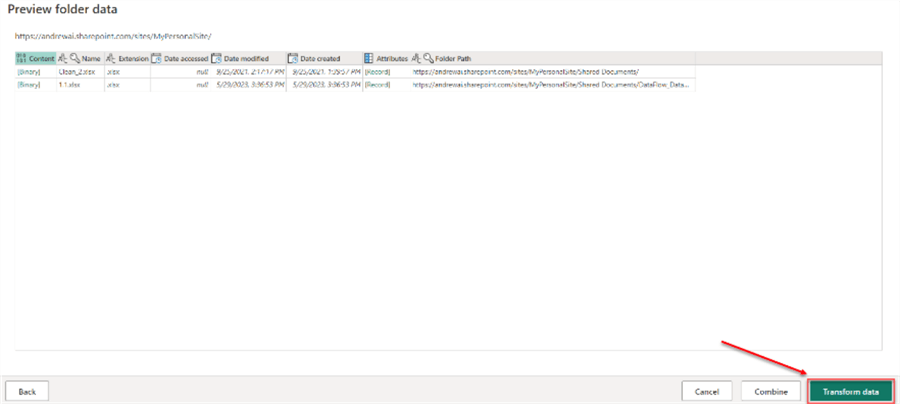
We need just one table, the 1.1.xlsx file, so we will remove the unwanted table.
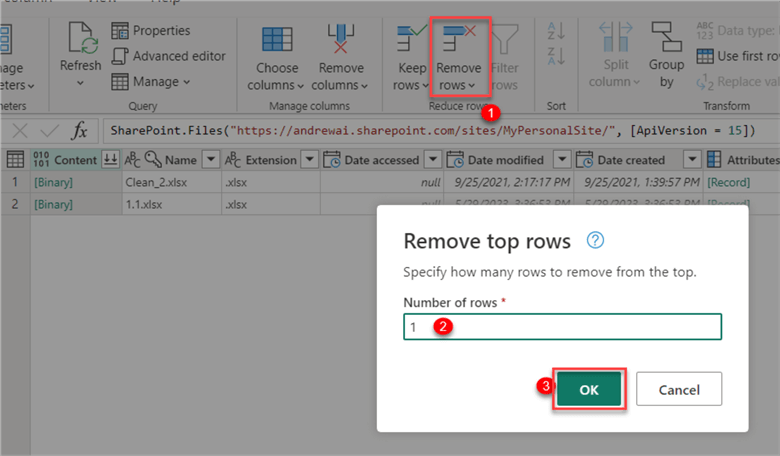
From your Home tab, click on Remove rows, then select top rows. Input the number of rows you want to remove and click OK.
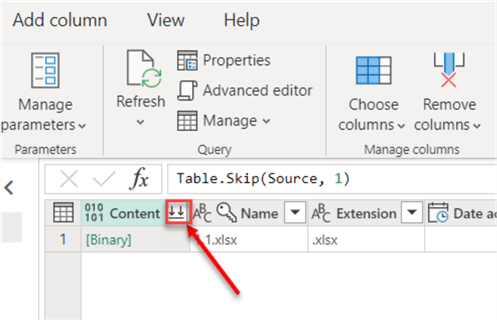
Step 5: Expand Data
Click on the Combine file dropdown in the Content column. This will expand the entire data table. This should take a couple of minutes, depending on your internet connection.
After successfully combining the file, we need to remove the Source.Name column. This can be done by clicking on the column and selecting the Remove Columns icon.
Lastly, we can rename the table name from Query to SharePoint. This will help to identify the table easily.
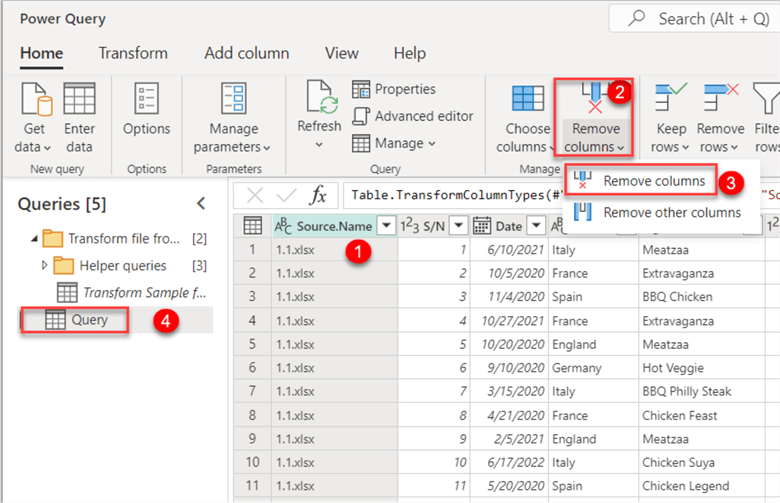
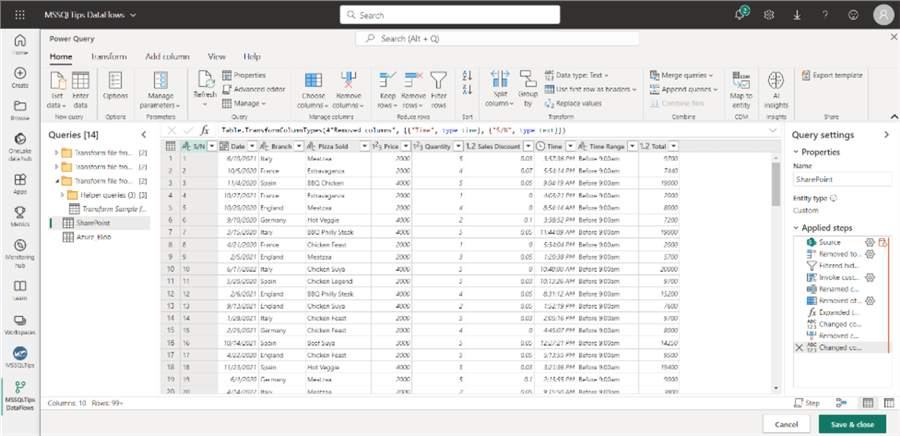
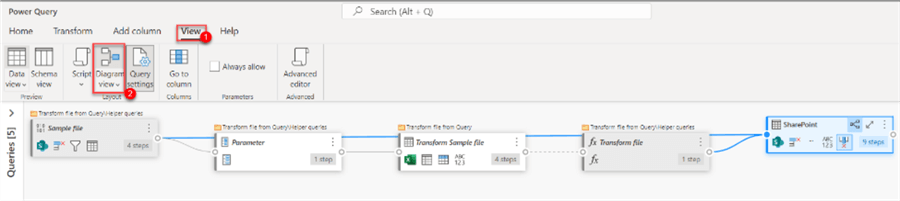
Diagram View
The diagram view is a feature that allows you to see the connection between the various tables and columns in your dataflow. Understanding the structure of your data and addressing potential issues can benefit from this. It can be said that the diagram view simplifies the entire data-wrangling process.
In the dataflow Power Query editor, click on the View tab, then select the Diagram View. The diagram view also provides a means of performing data transformation using a graphical user interface.
Now that we are done transforming the data, let’s save & close the dataflow Power Query environment by clicking the Save button in the bottom right corner.
Step 6: Save Dataflow
After clicking on the Save button, a new window appears. You must provide the dataflow with a name in the new window.

Connect Dataflow to Azure Blob Storage
The Microsoft Azure Blob Storage is a fully managed object storage that provides high performance, scalability, durability, and security for your data. Blob storage supports structured and unstructured data such as text or binary data, images, documents, videos, and log files.
To create the Azure Blob storage, you can check out our previous article Mount Azure Blob Storage.
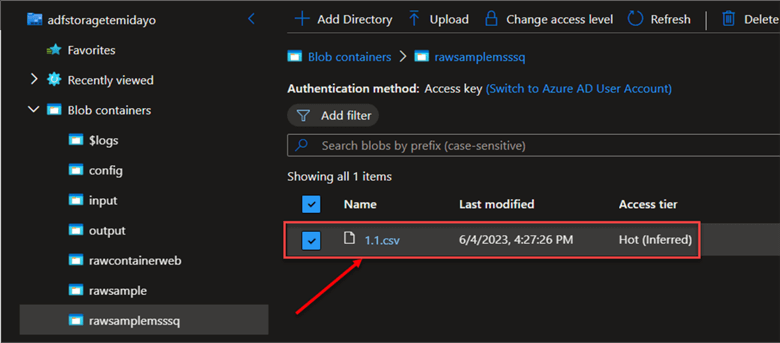
Step 1: Get the Property URL
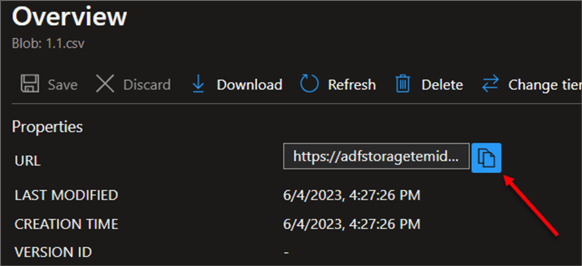
In your Azure portal, navigate to your blob storage where the file to be used is uploaded. In your blob container, click on the 1.1.csv file. This should open another window.
In the new window, copy the property URL.
Step 2: Get Data from Blob Storage
In your Dataflow environment, click Add tables at the top right corner and add a new data source.
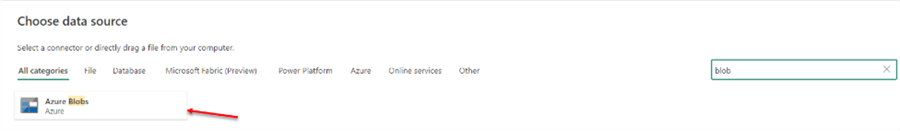
In the Choose data source window, search for blob storage, and select Azure Blobs storage.
Step 3: Configuration Settings
The property URL copied from the blob storage is divided into two parts. The first is the blob storage URL, while the other is the file name.

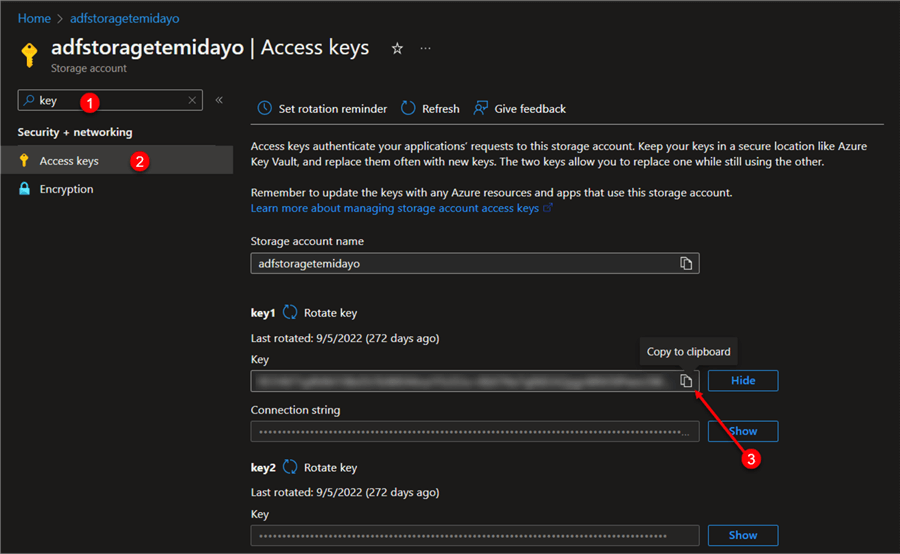
Get Account Key
In your Azure storage account, search for Access keys, then copy the key into a secure place.
In the connection settings, you are expected to fill in the following:
- Account name: Copy the Blob Storage URL to the Account name.
- Data Gateway: This is optional since the data source is cloud-based.
- Authentication Key: Paste the access key copied from the Storage account.

Step 4: Transform Data
Perform the same amount of transformation for the SharePoint folder aspect.
Start by expanding the data by clicking on the Content dropdown column.

After expanding, drop the Source.name column, then save and close.
Connect Dataflow to SQL Server Database
The SSMS is an integrated environment for managing Microsoft SQL Server. The following parameter is needed to connect Power BI Dataflows to SQL Server, which is an on-premises data source.
Create and Insert Data into Table
The following steps are needed to create a data table in SSMS.
Step 1: Create a Table. In your SQL Server, create a new table by writing the query below. They should provide the individual column headers.
create table sales_target(
   SN varchar(999),
   Date_ date,
   Branch varchar(50),
   Pizza_Sold varchar(50),
   Price int,
   Quantity int,
   Sales_Discount numeric,
   Time_ time,
   Time_Range varchar(30),
   Total numeric
);
Step 2: Insert Table Using SQL Server Import and Export Wizard. The Import and Export wizard is a graphical interface that helps users import data from various sources to a destination.
In your SSMS, right-click on the database, navigate to Tasks, and select Import Data. This should open another window for you.

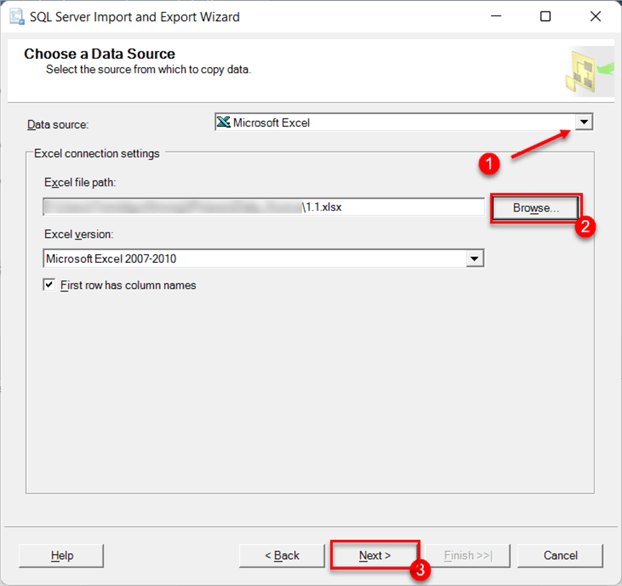
In the Data Source, click on the dropdown and select Microsoft Excel, then navigate to the path in which the file is saved on your local machine and click the Next button when done.
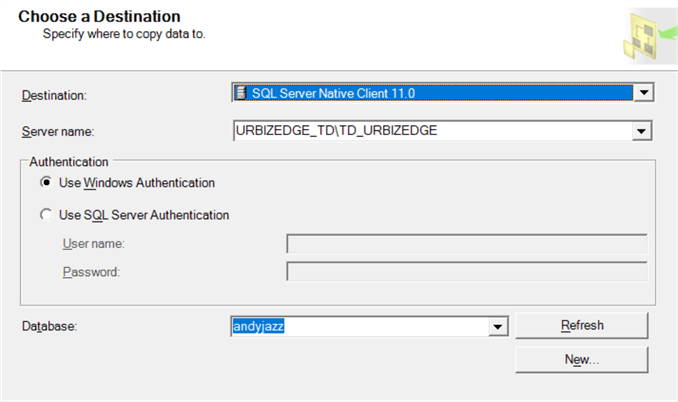
For the destination, change the dropdown to SQL Server Native Client 11.0. The authentication can be Windows since the data source is on an on-premises source.
The table and view are important parts of the entire data import process. Ensure the destination the data has been imported to is the right table.
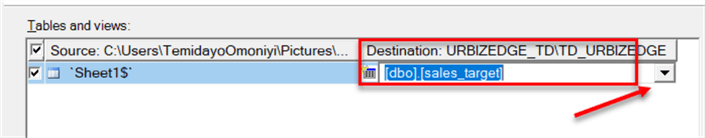
Click on Edit Mapping at the bottom right. In the new window, ensure each Destination has the right Data type.

Click on the Next tab until you get to the final process, with the message “The execution was successful.”
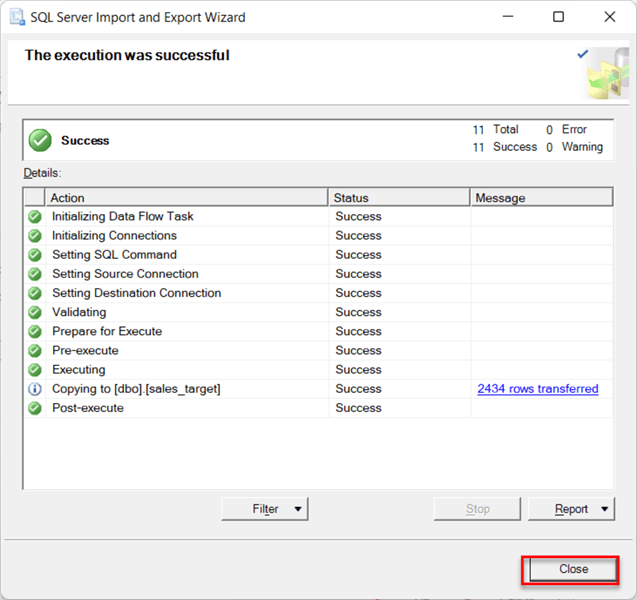
Run the select all query to check if the data was successfully inserted into the sales_target table.

Set Data Gateway
A data gateway acts as a bridge between an on-premises and cloud-based data source. It enables rapid and safe data transfer between several Microsoft cloud services and on-premises data.
Step 1: Install and Setup Data Gateway. Microsoft provides two types of gateways: the personal and the standard gateway. For this article, we will be using the standard gateway.
In our previous article on Power BI Data Gateway, we explained all you need to know on how to download the data gateway and configure it.
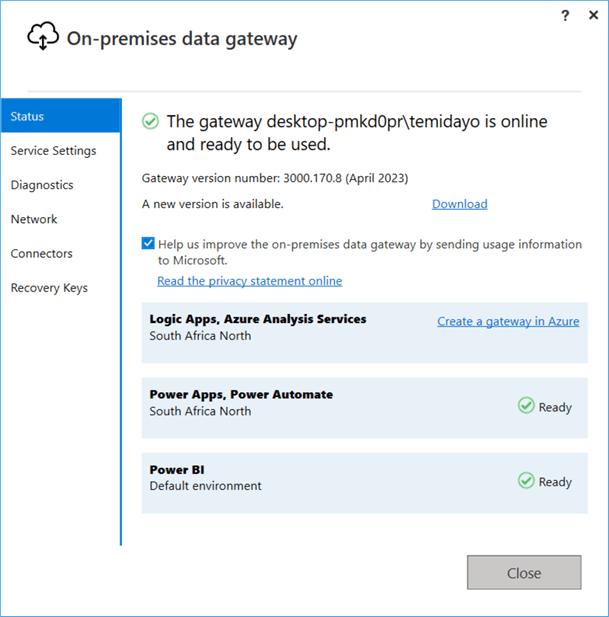
Your data gateway should be up and running at the end of your configuration.
Note: Leave the data gateway location at the default location for this project.
Step 2: Add a New Connection. We need to add a new connection to our Power BI service that will be used in connecting to the SQL Server.
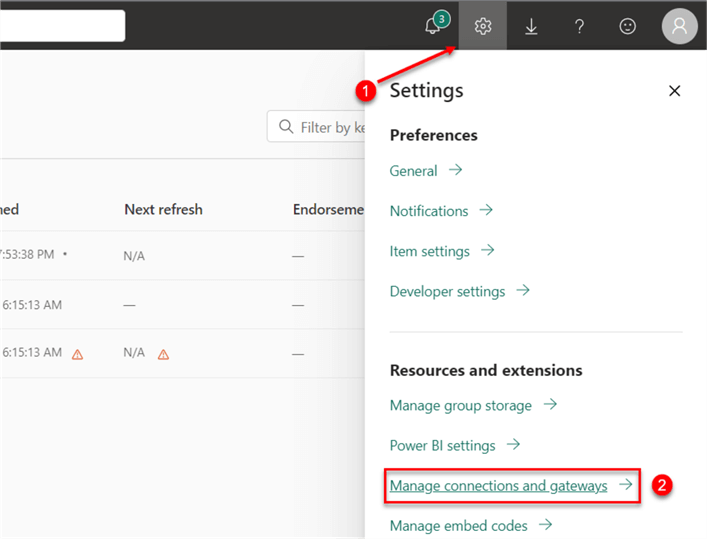
In your Power BI service, click the top right corner gear icon and select Manage connections and gateways. This will take you to another window.
Step 3: Configure New Connection. Before configuring the connection, go to your SQL Server and navigate to the Connection Properties. This was also explained in our previous article, Power BI Data Gateway.
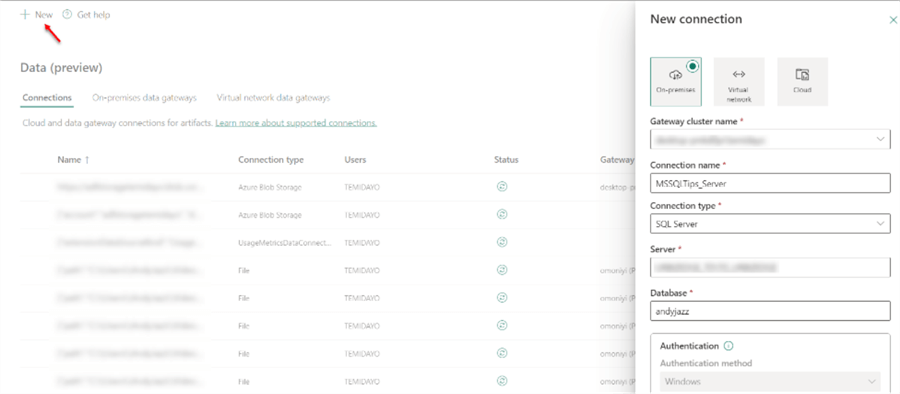
In the manage connection environment, click on the New icon at the top left corn and fill in the following information:
- Gateway Cluster Name: Click on the dropdown and select your data cluster currently running.
- Connection Name: Provide your new connection with a name to easily identify the connection.
- Server: The Server is from the Connection Properties in your SQL Server.
- Database: This is the database in which our table is located.
- Authentication Method: We will be using Windows Authenticator for the authentication method.
- Username: You can get the username from your connection properties or Command prompt using the command whoami.
- Password: Provide it with your SQL Server login password.
- Single Sign-on: Use the direct and import query.
- Privacy Level: For this, I am using Organizational and clicking on Create.
Get SQL Server Data
Now, let's connect our Power BI Dataflow to SQL Server. In your dataflows, click Add Tables and search for SQL Server database.
The following set below will be used in configuring the database:
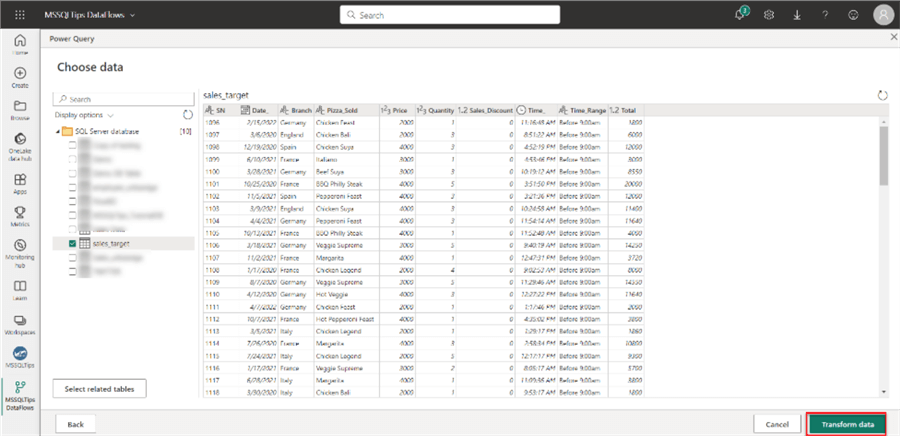
Step 1: Connection Settings. In the Connection Settings, you must provide the following settings from the image below, then click Next.

In your Power Query preview, select the table you want to use, the Sales_Taget Table, then Transform data.
Step 2: Data Transformation. Perform all necessary transformations in your Power Query Editor, then Save & close.
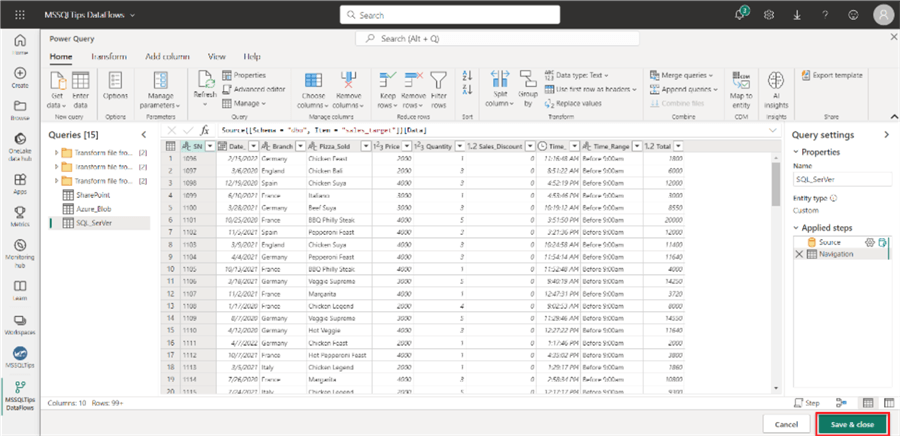
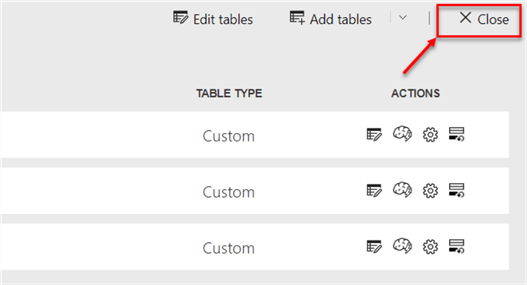
Step 3: Save Dataflow. Click on the Close button at the top right and save the file.
Create Report Using Dataflow in Power BI Desktop
Now that we are done creating the dataflow, let’s connect Power BI Desktop to dataflow.
Step 1: Get Dataflow Data
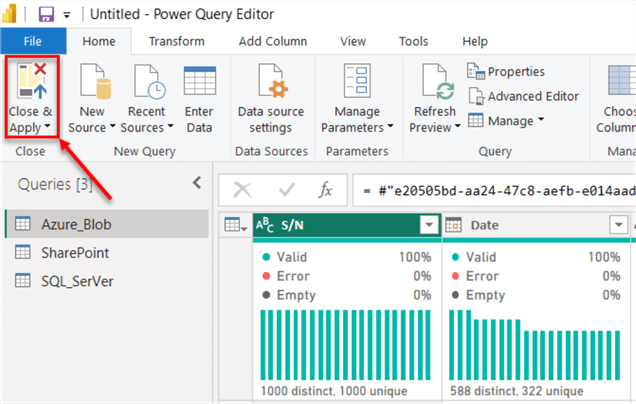
On your Power BI desktop, click Get Data and select Dataflows. Provide the same login credential as that of your Power BI Services.

In your Power Query editor, you will notice little or no transformation is required since the data has been transformed in Power BI Service dataflow, then click the Close & Apply button.
Step 2: Create a Report
In your Power BI Report, create a simple report in your report canvas.

Step 3: Publish Report to Power BI Workspace
To migrate the report from the Power BI desktop to the Power BI service, you must first create a Power BI workspace. Workspaces are Power BI service containers that house content such as datasets, reports, dashboards, and dataflows. You can check out our previous article on how to create a Power BI workspace.
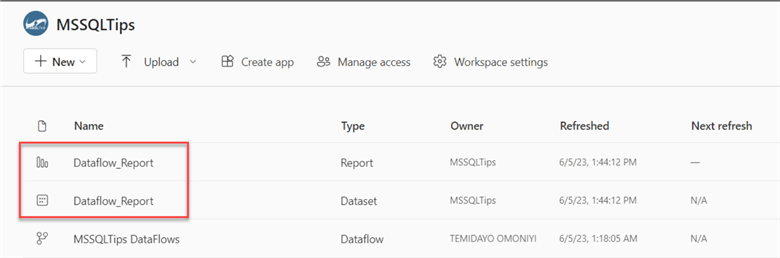
In your Home tab, click Publish and select the workspace where the report will be published.

In your Power BI service workspace, two new contents have been added: the Report and Dataset.
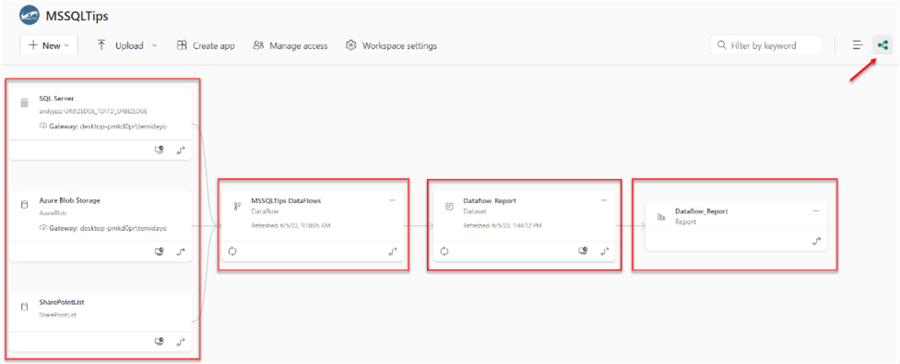
To better understand, let’s change the view from a list view to a data lineage view. The data lineage displays which data sources are utilized by which datasets, the transformations applied, and which are subsequently used by which reports.
Step 4: Refresh Dataflow
Refreshing the dataflow saves you the stress of refreshing the dataset due to the fact transformation is first carried out in the dataflow before going to the dataset.
Click refresh now to automatically refresh your datasets to the most recent one.
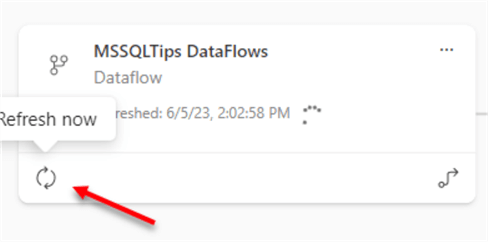
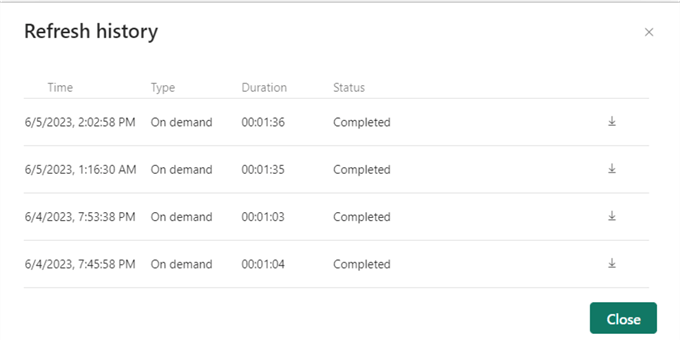
To track the refresh history of your dataflow, click on the refresh history.
Conclusion
This article taught us about Power BI dataflows, when to use it, and the different applications. We also covered how to get data using the dataflow from multiple data sources such as SQL Server, SharePoint, and Azure Blob Storage.
We further explained data gateway and a use case as our previous article on Microsoft Data Gateway.
Next Steps
- Creating a dataflow
- Introduction to Datamarts
- Check out related articles:

Temidayo Omoniyi is a Microsoft Certified Data Analyst, Microsoft Certified Trainer, Power Platform Developer, Azure Data Engineer, Content Creator, and Technical writer with over three years of experience.
Currently, he works as a data and business intelligence analyst for a training and consulting company in Lagos, Nigeria.
Temidayo enjoys creating educative content on YouTube, LinkedIn, Twitter, and other online platforms. He loves sharing his knowledge and writing about systems, applications, tools, and processes.
Apart from training, writing, and coding, you will find him watching and reading Anime. He is a big fan of DC Comics.
- MSSQLTips Awards: Trendsetter (25+ tips) – 2025 | Author of the Year – 2023, 2024


