Problem
In data analysis, rankings remain a critical tool for revealing top performers, identifying areas for improvement, and driving informed decision-making. But when ranking multiple columns, things can get tricky, especially when considering multiple columns from various tables in a Power BI model.
Solution
This tip will describe two approaches using DAX magic and modeling to conquer multi-column rankings in Power BI. For our purpose, I have leveraged a Power BI model with four dimension tables and one fact table, as seen in the image below.
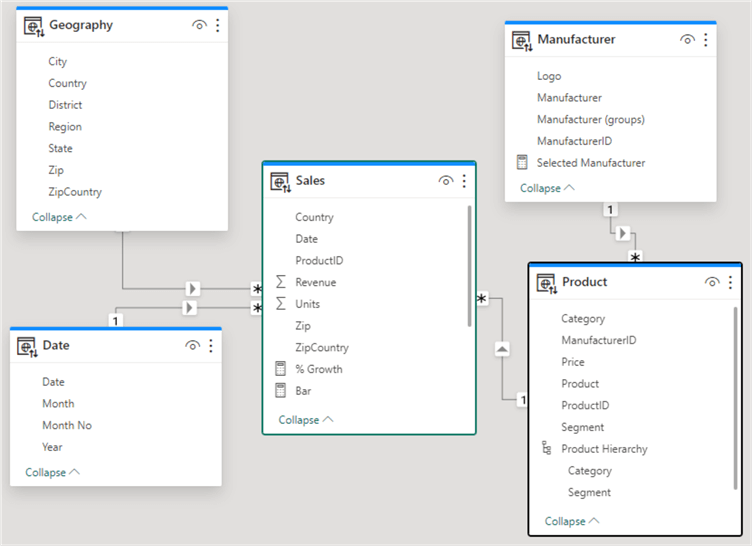
Let’s consider a practical example. Imagine you’re analyzing sales data stored in the Sales fact table and want to see how this information ranks based on Region and Manufacturer. The image above shows that the Geography table holds the Region details, while the Manufacturer table stores information relating to all manufacturers. To gain valuable insights, you want to rank Sales based on Region and Manufacturer at the same time.
Ranking Based on Single Column
The image below shows this ranking based on the Region column only.
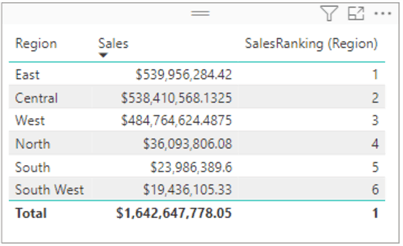
The DAX code below uses the DAX RANKX function to create the above ranking. I have not gone into many details on how this DAX ranking approach works here, and please don’t mind the totals for now; it’s not the purpose of this article.
SalesRanking (Region) =
RANKX(
    ALLSELECTED(Geography[Region]),
    [Sales], , DESC
)
It is the same when we rank the sales values based only on the Manufacturer column (shown below).
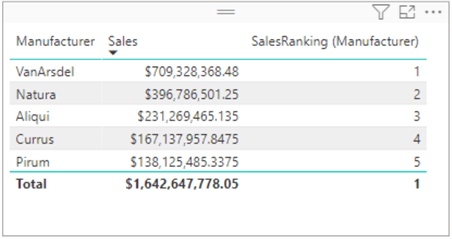
The DAX code used to create the above ranking based on the Manufacturer column is below.
 SalesRanking (Manufacturer) =
RANKX(
    ALLSELECTED(Manufacturer[Manufacturer]),
    [Sales], , DESC
)
Ranking Based on Multiple Columns
As you can see, it was easy to create, interpret, and understand the logic behind ranking based on single columns, but this is not true as it relates to ranking based on multiple columns. Let’s consider the practical scenario mentioned earlier, then try to use the first DAX code to rank the “Sales” value. At the same time, we have Region and Manufacturer on the same table visual as seen in the image below.
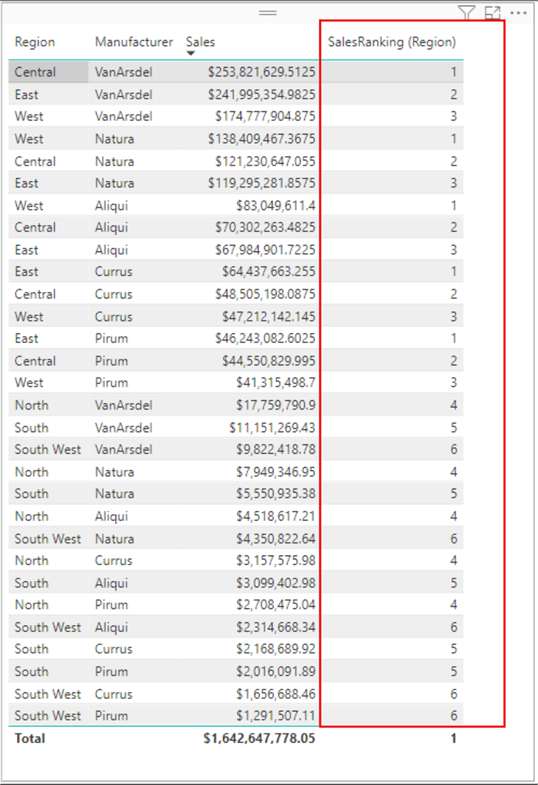
Now, the ranking is getting confusing. I am sure you would struggle to understand what it is doing. The same issue will arise if you try to rank the Sales value based on the two columns, but the DAX code still references a single column.
What’s the Answer?
So, what is the solution, you might ask? I will provide two approaches to resolve this problem. The first approach is pre-creating a column that combines the two columns (i.e., Region-Manufacturer) into a single column. The second approach is to use the CROSSJOIN DAX function.
Approach 1 – Combining Both Columns
This approach will only be possible if your mode of connection in Power BI is not “Live” connection mode. “Import” or “Direct Query” modes of connection should be okay. To demonstrate this, I will create two new calculated columns in my Sales table to include the Region and Manufacturer columns from their respective tables using the RELATED DAX function, as seen in the codes below.
Manufacturer_2 =
RELATED ( Manufacturer[Manufacturer] )

Region_2 =
RELATED(Geography[Region])
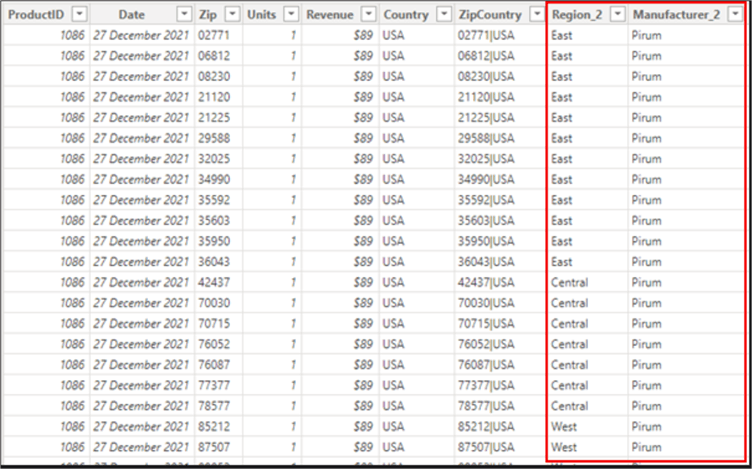
The image below is a snapshot of the outputs on the table from both calculated column codes above.
Next, the columns “Region_2” and “Manufacturer_2” should now be concatenated as a new calculated column in the Sales fact table, as in the DAX code below.
 Region-Manufacturer =
Sales[Region_2]&"-"&Sales[Manufacturer_2]
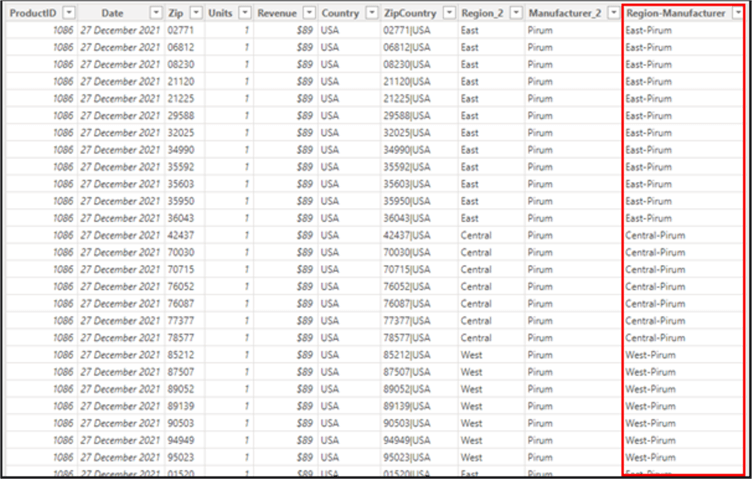
Note: You can use any delimiter in the DAX code you prefer. I have used a “–” in this case. The output of the above DAX code is below.
The new concatenated column (“Region-Manufacturer“) could be used in the ranking measure.
 Sales Rank =
RANKX(
    ALLSELECTED(Sales[Region-Manufacturer]),
    [Sales], , DESC
)
If we apply this new measure to the table visual from earlier, you can see that the ranking is now accurate and based on both the Region and Manufacturer columns, as seen below.

Approach 2 – Leveraging the DAX CROSSJOIN Function
This is my preferred approach. It takes less time to create and works irrespective of the connection mode used.
The approach uses the DAX CROSSJOIN function, which returns a table with the Cartesian product of all rows from the Geography (Region) table and the Manufacturer (Manufacturer) table. The DAX code below shows how the magic is done using this approach.
Sales Rank 2 =
RANKX (
    CROSSJOIN (
        ALLSELECTED ( Geography[Region] ),
        ALLSELECTED ( Manufacturer[Manufacturer] )
    ),
    Sales[Sales],
    ,
    DESC
)
When the above measure is used in the table visual, the output should look like the image below. Note that I have used the Region and Manufacturer tables independently from their respective tables.

Approach Considerations
- Before implementing Approach 1, ensure that there is a relationship between the dimension tables and the fact table being used.
- Ensure you are not using a “Live” connection when implementing Approach 1.
- Consider the performance implications of creating additional columns if you choose to apply Approach 1.
In summary, it is possible to rank a value in Power BI based on more than one column from more than one table. However, to ensure Approach 1 works, you must first ensure the considerations listed in this blog are in place. This scenario was like a real business problem I was asked to help resolve (although the data is different). So, I‘m sure other business users can use information to help solve this common and practical business problem.
Next Steps
- Read more about the DAX CROSSJOIN function.
- Read more about the DAX ALLSELECTED function.
- Read more about the DAX RELATED function.
- Read more about the DAX RANKX function.
- Read my other tips.

Kenneth A. Omorodion is a Microsoft Certified Solutions Associate (MCSA) with 12+ years of enterprise application experience in Power BI, DAX, Microsoft Fabric, Business Intelligence, data warehousing, SSRS, T-SQL, and Azure. Beyond his technical skills, Kenneth has expertise working with stakeholders’ and business leaders to help them better understand key insights. He has a great track record of successfully delivering full life cycle Business Intelligence and data solutions to organizations with measurable business impact.
- MSSQLTips Awards
- Achiever Award (75+ Tips) – 2025
- Author of the Year-2021
- Author Contender-2022/2023/2024


Thanks for sharing the trick