Problem
On-premises to cloud migration projects are at the forefront of every organization’s digital transformation agenda at various stages of their data and analytics maturity curve. Interestingly, migrating to the cloud does not always equate to lowered cost. Several organizations that have built their modern infrastructure on cloud platforms, like Azure, are beginning to see their cloud costs skyrocket. This can be attributed to various factors, including increased compute costs for high-volume data processing, increased frequency of data refreshes or loads, unstructured data processing of images, voice, and video files, and advanced analytics AI/ML compute usage. The granularity of these costs is often hard to capture at a ‘per pipeline’ or ‘per compute’ level. Organizations must understand this for many reasons, including cost reduction initiatives such as optimizing or enhancing pipelines, altering infrastructure components, or sharing costs with other departments. Organizations have been seeking a way to gain insight into these granular cloud costs.
Solution
Within Azure, the Cost Management capability has helped to give insights into the costs of resources deployed within subscriptions through cost alerts, budgets, analytics, and more. These costs, however, were visible at an accumulated level until recently. With the new cost analysis experience, there are now ways to analyze granular cloud costs. While this feature applies to all Azure resources, Azure Data Factory (ADF) has historically been a high-cost resource with limited insight into the per-pipeline billing granularity. This has been problematic for organizations with hundreds of ADF pipelines for loading EDWs, data marts, and transactional systems integrating data from multiple sources on near real-time orchestration schedules. The new capabilities of Azure’s Cost Analysis now allow for reporting ADF billing by pipelines. In this article, you will learn how to configure per-pipeline billing in ADF and how to view and analyze these per-pipeline costs within Cost Analysis.
Enable Billing by Pipeline in ADF
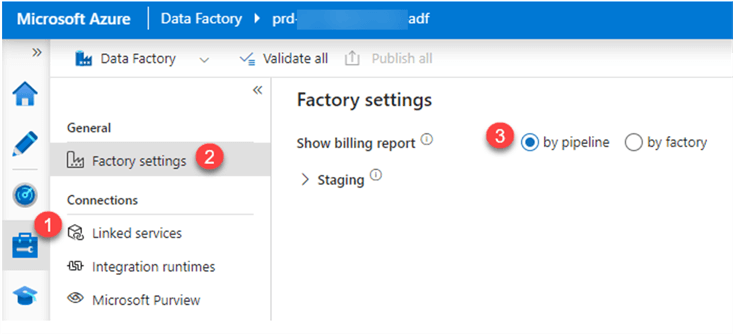
In ADF, navigate to the General Factory Settings under the Manage tab. Ensure that ‘by pipeline’ is selected to show the billing report. This allows pipeline-level billing data to begin aggregating for reporting. This is the only step needed within your ADF instance to create and analyze pipeline-level billing details. You need to repeat this exercise for each ADF instance within your subscription(s) that needs to have pipeline-level billing tracked.
Configure and View Cost Analysis Features
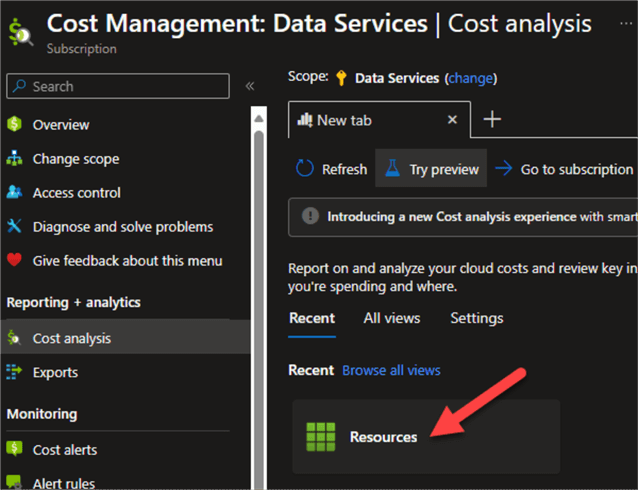
Within Azure Cost Management, navigate to the Cost analysis tab under Reporting + analytics and click Try preview. This will give you access to a more granular view for tracking pipeline-level billing details.

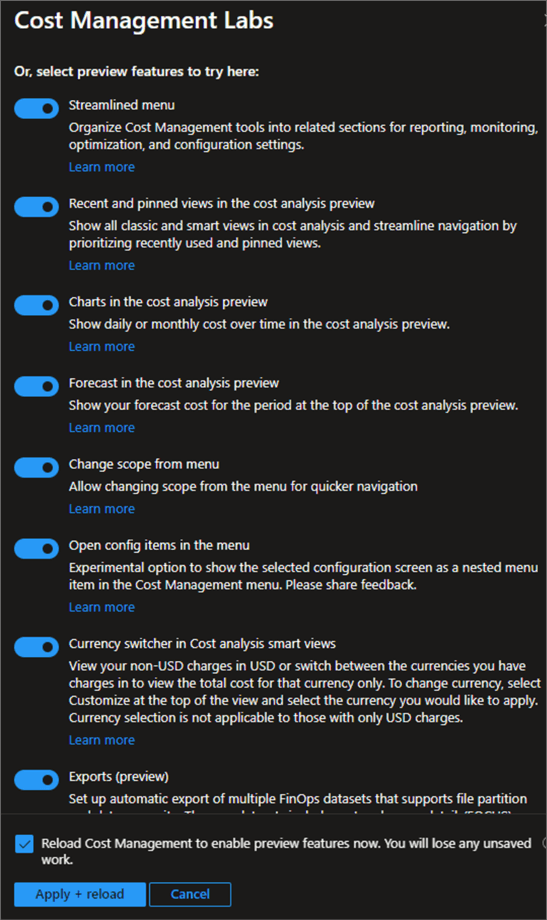
Enable the preview features. Click Apply + reload to register the changes.
Now, you are ready to dive into analyzing your detailed costs. Click Resources to begin.
This page shows a visual capturing detailed spending across all resources within the scope of the selected subscription by day per month and by aggregated resource per month. Within the aggregated resource billing view, you can expand the resource to see more detail (e.g., per ADF pipeline billing). Remember to ‘change’ the scope of the subscription, which you need to analyze if you have multiple subscriptions. You can add filters, such as ADF resource name, to find your resource. You can also create a budget to track and compare actual versus budgeted spend. The month display lets you navigate to different months as needed. You will also have the option to customize the view or download the data.

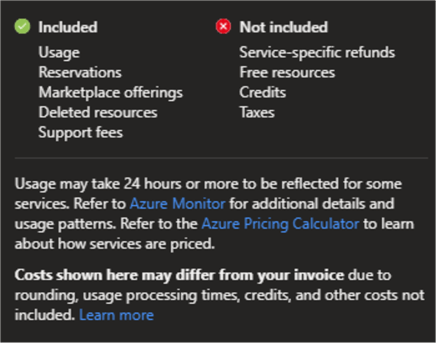
The following image shows the data points included and not included in these reports. When first enabling per pipeline billing, waiting (e.g., about 24 hours) is advised to allow for the most accurate reporting.
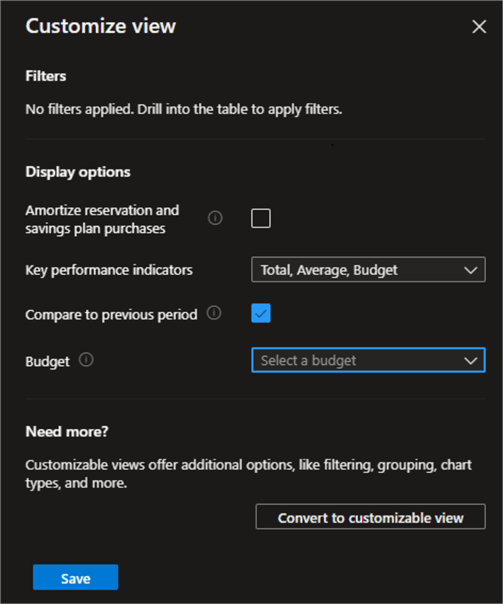
You can also customize the view by adding options such as filtering, grouping, chart types, and more.
View and Download ADF Pipeline Billing Details
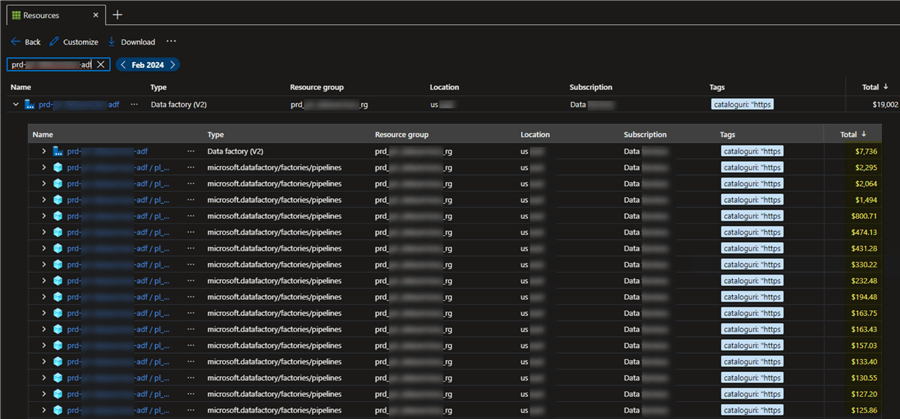
The image below shows how to expand your ADF pipeline and view the cost per pipeline.
This data can be downloaded in either Excel or CSV file format.
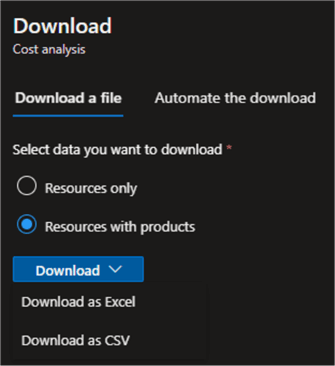
By selecting the Resources with products option, you will also see the ServiceName, ServiceTier, ProductName, and Meter details exported within the data. This data is beneficial if you need to know what your highest cost per pipeline is related to. For ADF, you could determine if high cost is attributed to Data Flow vCores, Managed VNET External Pipeline Activity, Read Write Ops, Orchestration Activity Runs, Pipeline Activity, VNET Data movement, Self-Hosted Movements / Activities, and more. This is a critical step in identifying opportunities for enhancements and optimizations that lead to cost reductions.

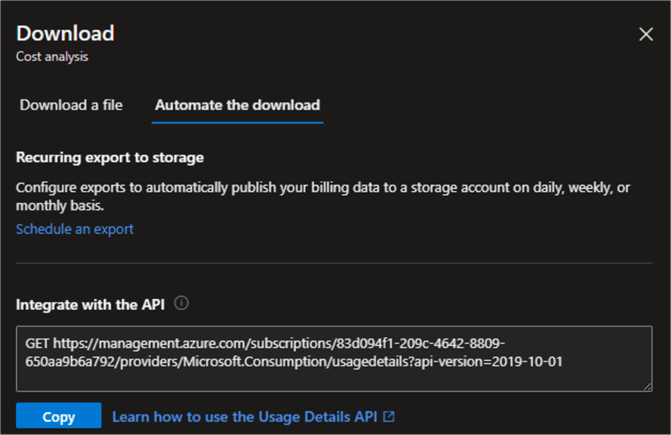
In addition to the downloading and scheduling ‘export to storage’ options, you can integrate this data with the Usage Details API. This provides easier cross-platform, real-time reporting and development time for new custom reports with access to REST API sources.
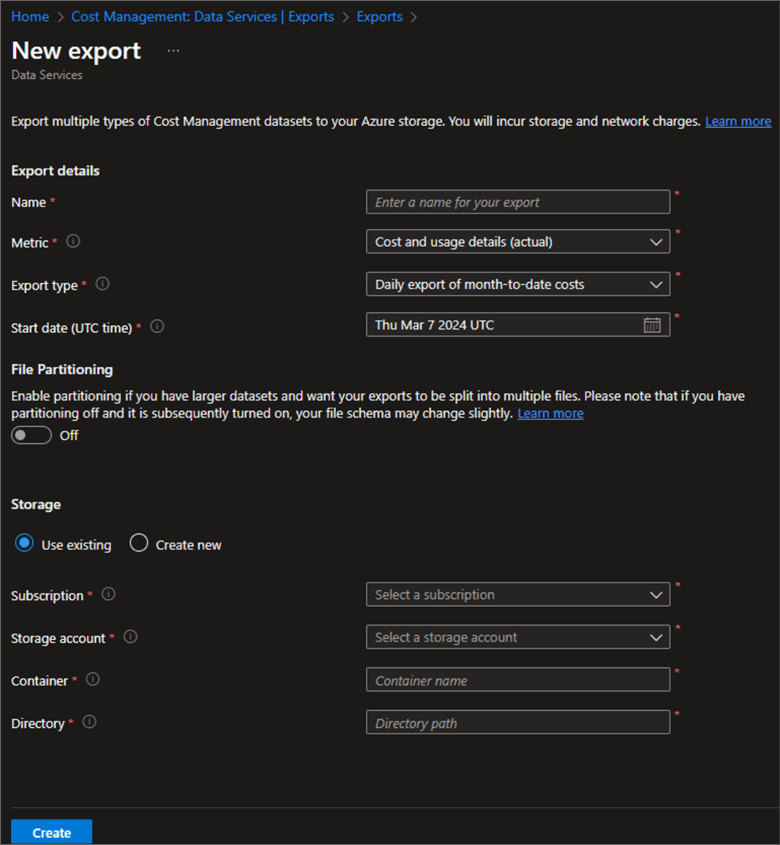
You could also set up recurring automated data exports to a configured storage account daily, weekly, or monthly. This is useful for many insights and analytics scenarios where a Power BI report could be built for multi-department consumption. For example, organizations that need to share per-pipeline ADF billing reports to bill various departments could export this billing data to their storage account and then create Power BI reports that allow multiple departments to filter their department’s costs each month. The data could be tagged with the department name at the pipeline level to allow this type of granular department-level filtering of ADF per-pipeline billing.
Next Steps
- Understand the known limitations for ADF per pipeline billing reports: Granular Billing for Azure Data Factory (microsoft.com)
- Read more about how to Plan to manage costs for Azure Data Factory – Azure Data Factory | Microsoft Learn
- Read about how and why to Enable preview features in Cost Management Labs – Microsoft Cost Management | Microsoft Learn
- Learn more about the Usage Details – List – REST API (Azure Consumption) | Microsoft Learn

Ron C. L’Esteve is a Data and AI Leader and professional Author residing in Chicago, IL, USA. He is well-known for his impactful books and article publications on Azure Data & AI Architecture, Engineering, and Leadership. Ron holds a Master of Business Administration (M.B.A.) and Master of Science in Corporate Finance (M.S.F.) from Loyola University Chicago. Ron possesses deep technical skills and experience in designing, implementing, leading, and delivering modern Azure Data & AI projects for numerous clients around the world. He is a Motorola Certified Six Sigma Green Belt, a Microsoft Global Challenger, and also holds numerous additional Microsoft, Snowflake, and Databricks professional certifications in Big Data Engineering, Artificial Intelligence, Apache Spark and Data Platform Architecture.
- MSSQLTips Awards: Champion (100+ tips) – 2023 | Author of the Year – 2020-2021 | Rookie of the Year – 2019