Problem
Data comes in different forms and types during the ETL/ELT process. The ability to spot and get instance notifications of failed pipeline runs is essential for all data professionals. Making all necessary changes before moving your pipelines from test to production would save the organization from unnecessary expenses.
Solution
As a data engineer, your primary responsibility is to migrate data from multiple sources, perform the necessary transformation, and load it to a storage location. If there is a failure in this process, you are expected to have a quick response to solve this. Microsoft Azure has multiple resources and other third-party tools to manage such situations.
Project Architecture
This article is a continuation of our previous article, Creating a Modern Data Production Pipeline using Azure Databricks and Azure Data Factory. We plan to make this modern data pipeline fully automated, and part of the automation required is to send failure notifications instantly for quick response and fixes. Think of it as building a different micro-service consisting of several tiny, autonomous service components that comprise an entire system.
To demonstrate, we will connect our Azure Data Factory (ADF) Pipeline to multiple services for quick pipeline failure response. Specifically, we will use Azure Monitor (Alerts & Metrics), a built-in notification system in Azure Data Factory, and the Azure Logic App to send a customized email notification with web activities, log the failure to an Azure Storage Table, and send a message to Microsoft Teams and Slack communication channels.

Azure Data Factory/Synapse Monitor
The Azure Data Factory Monitor is an effective tool for monitoring and managing the functionality, state, and execution of your data pipelines. Monitoring is essential for learning how your data workflows are being executed, seeing potential problems, and enhancing the overall effectiveness of your data integration procedures.
Components of Azure Data Factory/Synapse Monitor
Azure Monitor is made up of three major components with other sub-functions.
Runs
- Pipeline Run Monitor: Monitors how your data pipelines are running by providing information on the start, stop, and length of each pipeline run.
- Trigger Run Monitor: This refers to the execution of a trigger that starts a pipeline run.
- Change Data Capture (CDC) Monitor: The CDC is an immensely powerful feature in ADF that captures incremental changes made in the source, and vice versa applied to the target destination.
Runtime and Session
- Integration Runtime Monitor: It’s the compute infrastructure that powers data movement and transformations within Azure Data Factory/Synapse. It provides information such as Type, Subtype, Status, Region, and Creation Date.
- Data flow debug: When developing and debugging pipelines, data flow debug in Azure Data Factory/Synapse Monitor is essential for testing and troubleshooting your data transformations and giving the possible outputs.
Notification
- Alert & Metrics: These are two key features in data pipeline monitoring used to send notifications in advance regarding any problems or occurrences in your data pipelines.
- Metrics Alert: Triggered when a predetermined threshold is crossed by a given indicator (such as pipeline duration or the number of activity failures).
- Log Alert: Activated in response to the discovery of a specific pattern or term in the pipeline logs, suggesting issues.
This article will focus on the notification aspect of Azure Data Factory/Synapse Analytic Pipeline.
Note: I will create a scenario where the pipeline will fail by tempering with some pipeline activities that are needed to help us get the necessary notifications/alerts.
Setting Up the Configuration
The following steps are needed to set up the configuration.
Step 1: Create an Execute Pipeline
Firstly, let’s add a new pipeline. In the new pipeline, add the Execute Activity. Execute Activity is a powerful tool in ADF that allows the user to trigger the execution of an existing pipeline in ADF/Synapse within another pipeline.

In the ADF canvas pipeline, click on the Execute Activity, then select the Settings tab. In the Invoked pipeline, search for the Pipeline you want to use.

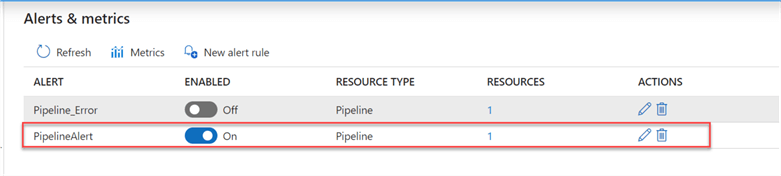
Step 2: Create Pipeline Alert & Metrics
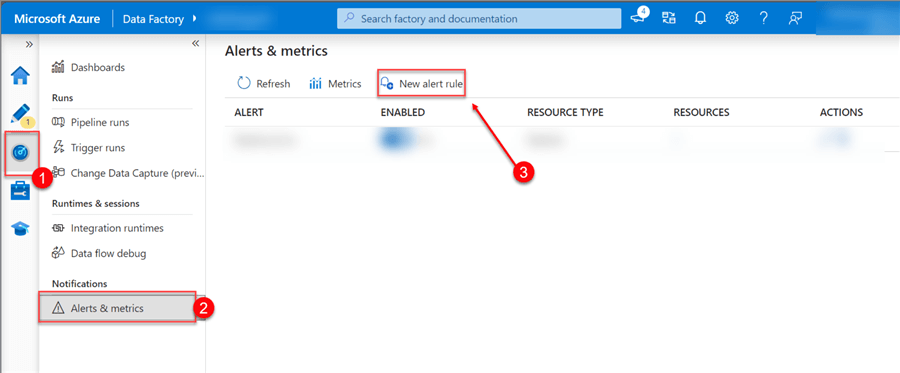
In the ADF/Synapse environment, click on the Monitor pane, then select Alert & metrics. Click on the New alert rule at the top, and a new window in the right corner will appear.
Step 3: Alert Rule Configuration
In the new window, fill in the following information.
Alert Rule Name. This is compulsory. You are expected to give the alert a name that can be used for easy monitoring in future use cases.
Severity. Severity is a critical parameter that establishes the priority and urgency of the alert-triggered notice. It helps differentiate between the diverse types of pipeline failure and indicates to the receiver how soon they should reply.
The table below provides a better understanding of the different severities and when to use them.
| Severity Level | Description | Examples |
|---|---|---|
| Sev 0 (Critical) | An important matter that needs to be addressed right now | Data loss and pipeline failure. |
| Sev 1 (Warning) | A problem that requires examination. | Reduced efficiency and mistakes |
| Sev 2 (Information) | Notable occurrence; no need for a quick response | The pipeline ran successfully; the configuration changed |
| Sev 3 (Verbose) | Comprehensive guidance on debugging and troubleshooting | Every aspect of the pipeline run, even the successes |
For this article, we will use Severity 0 (Critical), which is needed to get a quick email response when there is a failure in the pipeline.
Target Criteria. This refers to the specific conditions that set off/trigger the alert. It outlines the aspects you wish to keep an eye on and when to sound the alarm.
In the Target Criteria, select the Failed Pipeline Run Metrics. This should open another window where you are expected to configure the alert logic you want to use.
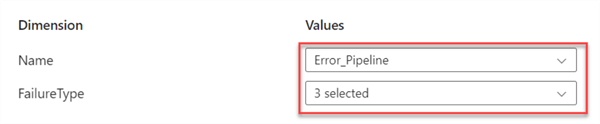
- Dimension Name: This is the pipeline you want to monitor in our ADF/Synapse, in this case, Error_Pipeline.
- Failure Type: This refers to the different failure types we can monitor. For this article, we will select all failure types.
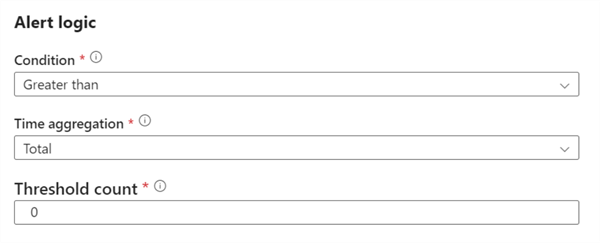
- Alert Logic Condition: You can provide the logic you want your trigger to be based on.
- Time Aggregation: Define the aggregation function applied to data points in aggregation granularity.
- Threshold Count: Specify the threshold number on which you want to base your trigger.
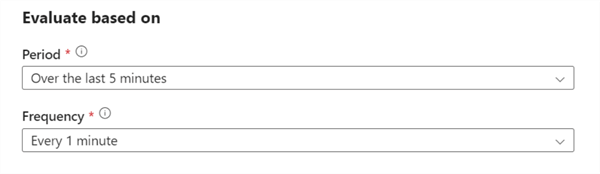
- Evaluate based on the Period: Defines the interval at which data points are grouped.
- Frequency: Frequency at which alert rules should run.
Click on Add Criteria when you are done with the different logic.
Configure Email/SMS/Push/Voice Notification
These features allow you to set up alerts to be sent when specific requirements are satisfied. This enables you to take appropriate action and receive timely information regarding problems with your data pipelines.
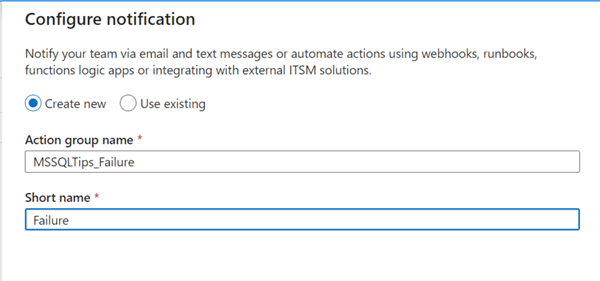
Click on the Configure notification. In the new window, provide the notification with an Action Group name and a short name, then click + Add Notification.
Note: Ensure the short name is not the same length as the Action group name.
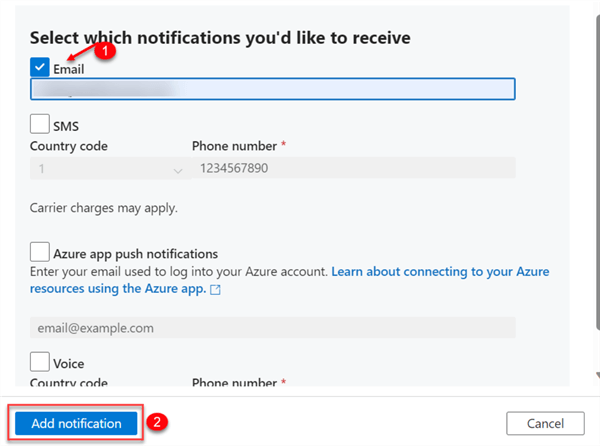
I want an email notification only, so I will check the notification box, fill in the mail I want to use, and then click Add notification.
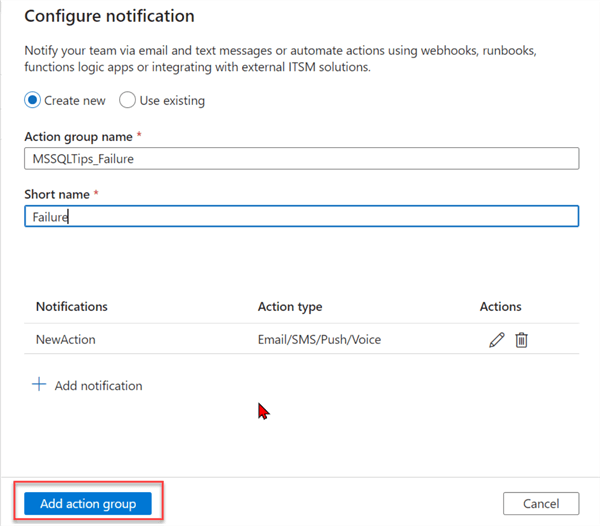
Now click Add action group. If configured properly, you should receive an email stating, “You’ve been added to an Azure Monitor action group” with your subscription ID.
To complete the entire process, click Create alert rule.
Evaluate Pipeline Failure Trigger
We must evaluate the pipeline and see if the entire configuration works as expected. Head back to your author tab. Select the pipeline you want to run and click Add trigger > Trigger now. This should open a windowpane to the right. Click OK.
Note: The notification/alert works only for Triggers (event base or schedule) or Tumbling trigger, not Debug mode.

After triggering your pipeline, getting a failed pipeline run notification to the email used while configuring should take a few minutes.

Azure Logic Apps Pipeline Failure Notification
The Azure Data Factory/Synapse alert notification can be quite complex and challenging to understand. Let’s create a custom email notification using the Azure Logic App to avoid this.
Note: Regarding budget limit issues, this entire process with Azure Logic Apps can also be done using Microsoft Power Automate.
What is the Azure Logic App?
The Azure Logic App is a cloud-based platform as a service (PaaS) that allows users to automate workflow with little or no coding knowledge. It enables users to design and implement automated workflows for the integration of systems, apps, and services.
Create Azure Logic App Resource
The following steps are required to create an Azure Logic App resource:
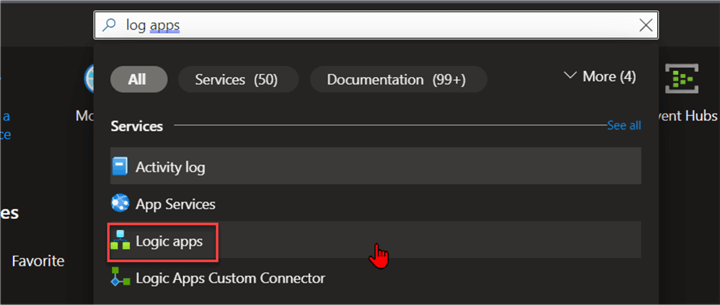
Step 1: Search for Azure Logic App Resource
In your Azure portal, search for Logic App in the search bar, then click on Logic Apps.
In the new window, click Add. This should open another window.
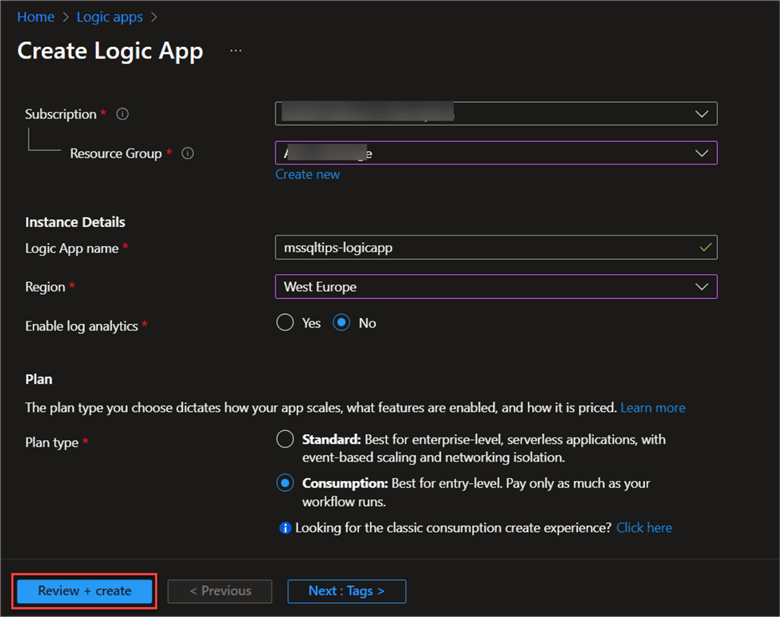
Step 2: Set Logic Apps Configuration
In the Logic Apps settings, fill in the following information:
- Subscription: Select the subscription you want to be charged for.
- Resource Group: For your Azure solution, a resource group serves as a logical container that houses associated resources. Select the resource group you want to use.
- Logic App Name: Create a unique name for your app.
- Region: Select the region where you want your resources hosted. For this article, we will be using West Europe.
- Plan Type: I will use Consumption, which is best for entry-level.
Leave the other settings at default and click Review + create. This might take a couple of minutes for your resource to be provided, but when you’re done, click Go to Resource.
Setting Up Custom Notification
Let’s create a flow to run the entire process of sending notifications based on a pipeline failure.
Step 1: Create a Flow Trigger
Triggers in most flows are the starting point for most automated workflows. It functions as a switch that, upon the occurrence of a particular event or circumstance, activates the flow.
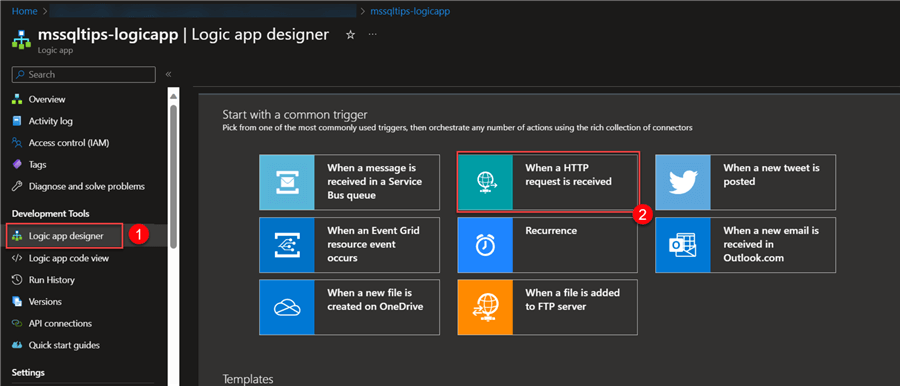
In your Logic App, click on Logic app designer and select a trigger.
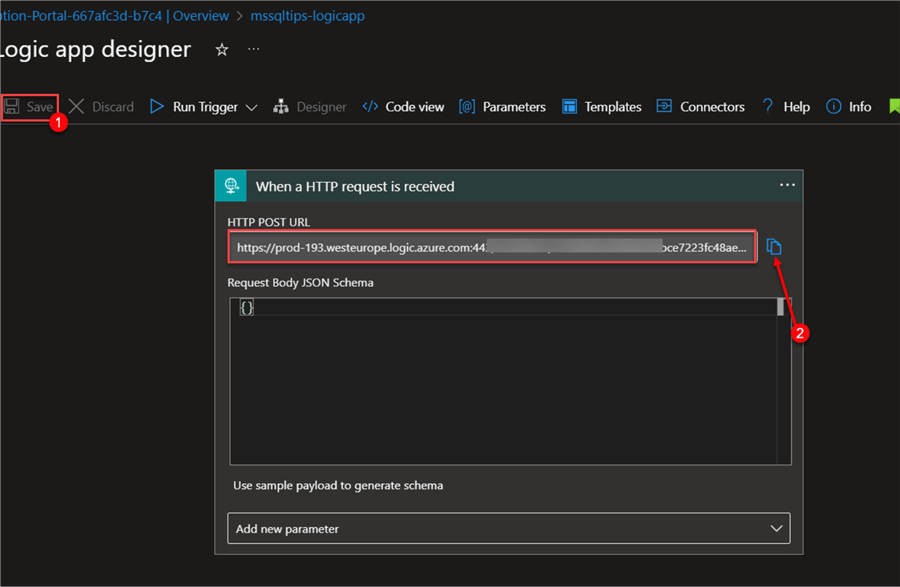
For our flow, we will use the When an HTTP request is received as our trigger. This trigger enables the user to create a web endpoint that the Logic App listens to. An HTTP request made to this endpoint serves as a trigger, starting the logic application’s stated workflow to run.
Step 2: Get HTTP POST URL
After selecting the trigger, the Logic App design canvas opens. This is where all the design will be done. The HTTP POST URL is a specific type of URL used in web requests using the Post method.
To get the HTTP POST URL, click Save at the top left corner, and the URL will appear on your trigger.
Step 3: Configure Web Activities
Head back to your Azure Synapse or Data Factory pipeline. Search for Web activity and drag it to the pipeline design canvas.
You will notice the Execution Path in Azure Pipeline Activities consists of four outputs:
- On Skip: Triggered when an activity is purposefully skipped through the pipeline interface or conditional phrases in your code.
- On Success: Enabled upon the successful completion of an activity without any faults or warnings.
- On Fail: Called when an error occurs that prevents an action from continuing.
- On Completion: This is a distinctive feature that executes regardless of the activity’s final status (success, failure, or skipped).
We will use the On Fail path for our web activity.

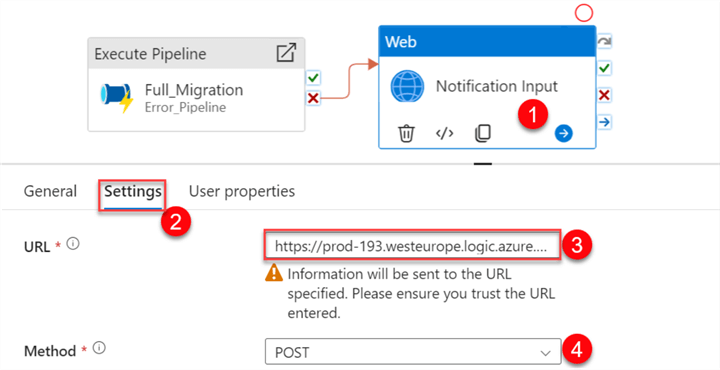
Click on the Web activity and, in the Settings tab, paste the HTTP POST URL gotten from the Logic App in the URL section.
In the Method area, click on the dropdown and select POST.
For the Body, click on Dynamic Content. This should open another window where you can enter the following dynamic expressions.
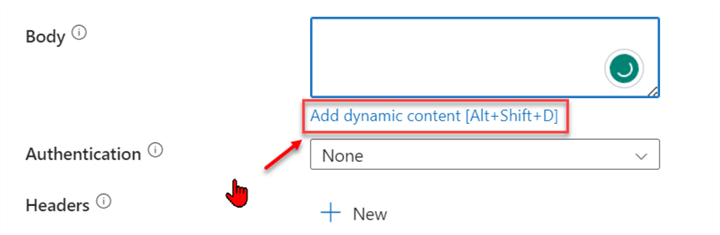
In the dynamic content, you’re expected to fill in the information you want to see:
{
   "Title":"MSSQLTips Pipeline Modern Pipeline Run Fail",
    "Message":"The Full Migration Pipeline Failed",
    "Color":"RED",
    "DataFactoryName":"@{pipeline().DataFactory}",
    "PipelineName":"@{pipeline().Pipeline}",
    "PipelineRunID":"@{pipeline().RunId}",
    "Time":"@{formatDateTime(addHours(utcNow(),1),'yyyy-MM-dd')}"
}
Step 4: Configure Logic App Request
Head back to the Azure Logic App. We need to configure the Request trigger to read the information that will be posted by Azure Data Factory/Synapse Pipeline Web activity.
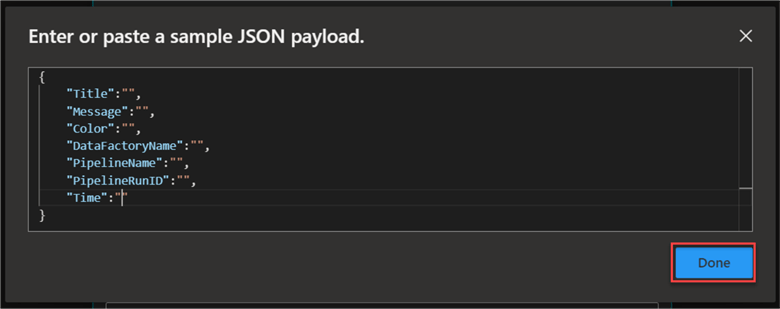
In your Azure Logic App, click Use sample payload to generate schema, which should open a new window.

In the window, paste in the template used for the ADF/Synapse Pipeline Web activity body without any value in it. Click Done.
Step 5: Initialize Variable
One of the most important components of Logic Apps for organizing and saving data in your workflows is the “Initialize variable” action. We need to add an action that will help read the values from the JSON file payload and send them to the required bodies as a readable email message.
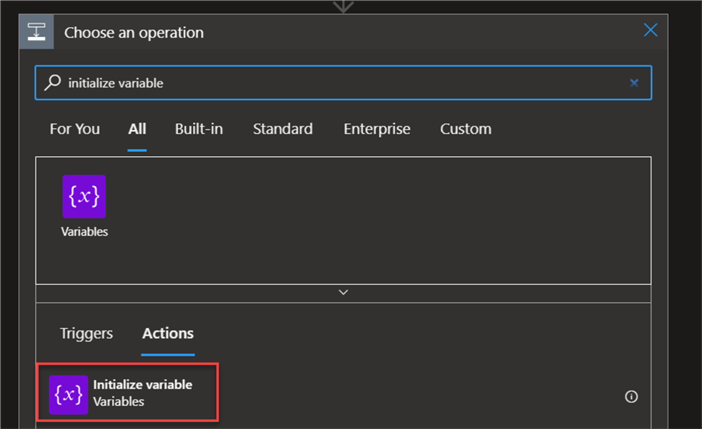
Click on New step and search for Initialize variable. Then click Action.
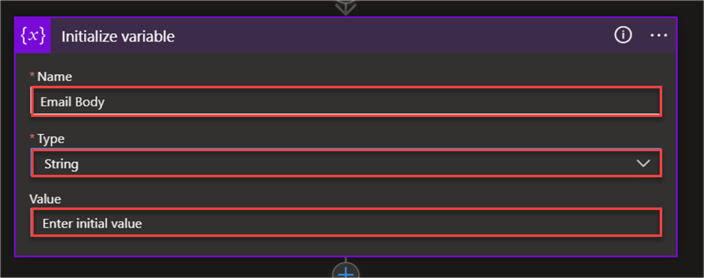
For Initialize variable, you are expected to fill in the following:
- Name: Provide the variable name you want to use.
- Type: We will use a string type for the variable.
- Value: For the value, I will provide a GitHub resource. These are the values you want to capture from the JSON payload from the received HTTP trigger.
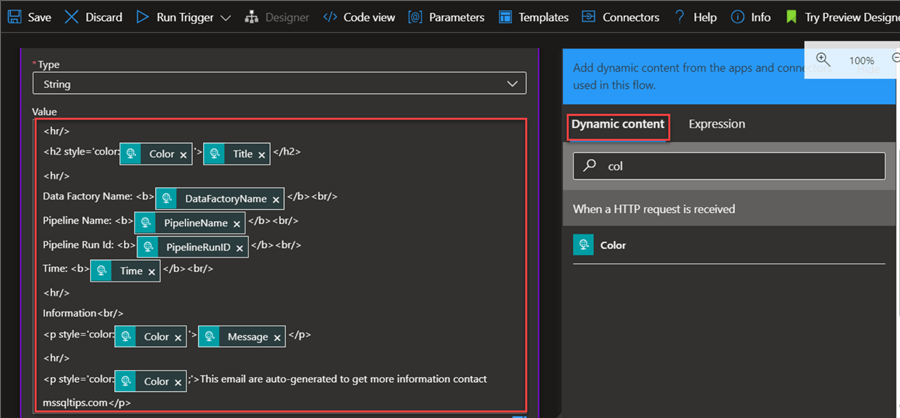
https://github.com/MarczakIO/azure4everyone-samples/blob/master/azure-data-factory-send-email-notifications/03-logic-app-email-template.htmlThe HTML table template that we will use is below.
<hr/>
<h2 style='color:____color_add____'>____title_here____</h2>
<hr/>
Data Factory Name: <b>____name_add____</b><br/>
Pipeline Name: <b>____name_add____</b><br/>
Pipeline Run Id: <b>____id_add____</b><br/>
Time: <b>____time_add____</b><br/>
<hr/>
Information<br/>
<p style='color:____color_add____'>____message_add____</p>
<hr/>
<p style='color:__color_add__;'>This email is auto generated to get more information contact mssqltips.com</p>
In the Initial variable value, use the Dynamic content from the Logic App to fill in the following information.
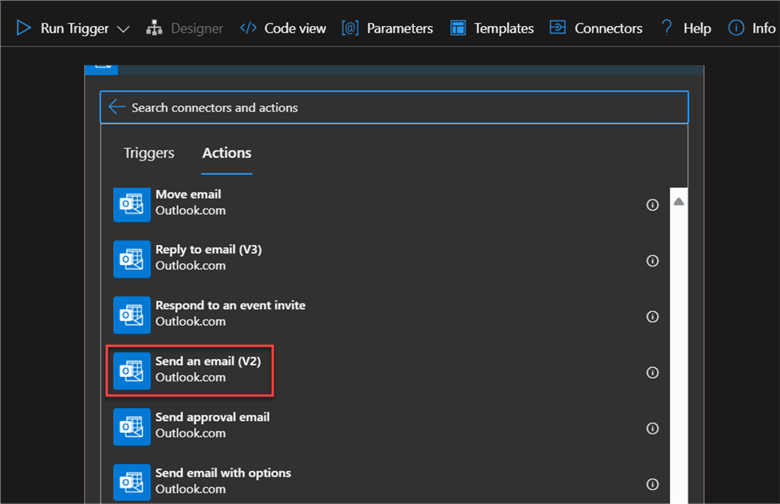
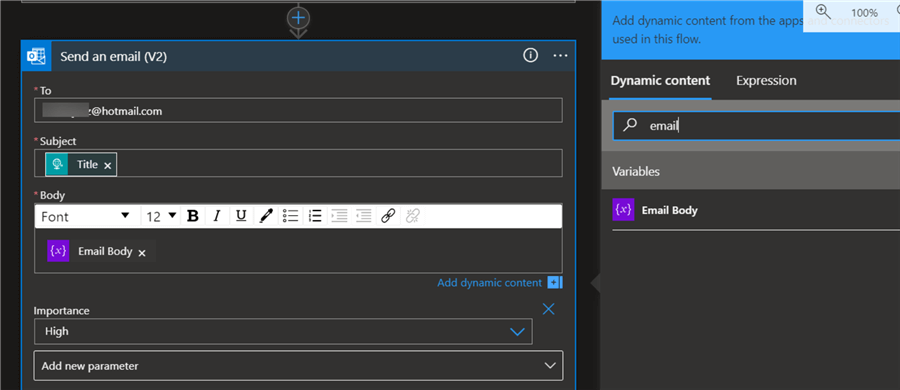
Step 6: Add Send Email Action
A new step needs to be added that will capture all the information and send it to a user. Click New step, search for Outlook, and select the action Send an email (V2). Sign in with the appropriate credentials.
As seen in the image below, you are expected to fill in the email address to whom it should be sent to, a Subject, and a Body of the email.
Ensure you save your flow in the Logic App after you are done and satisfied with all configurations.
Evaluate and Debug
Let’s head back to your ADF/Synapse pipeline. Click Publish All to save all changes made, then click Debug to run the pipeline. This should take a couple of minutes.

Slack For Pipeline Failure Notification
Slack is a business messaging platform that helps users find the information they require. It is popular and used as the primary means of communication by most start-up organizations.
Azure Logic App provides a Slack connector, which allows users to send messages from the Logic App to the Slack Channel.
Configure Slack Connector in Azure Logic App
We will use the same flow used previously in the messaging notification. The following step provides a guide on how to proceed.
Step 1: Add & Configure Slack Connector
In your flow, click on the Add Step and search for Slack. Then, select the action Post message (V2).
You are expected to select the Slack you want to use.

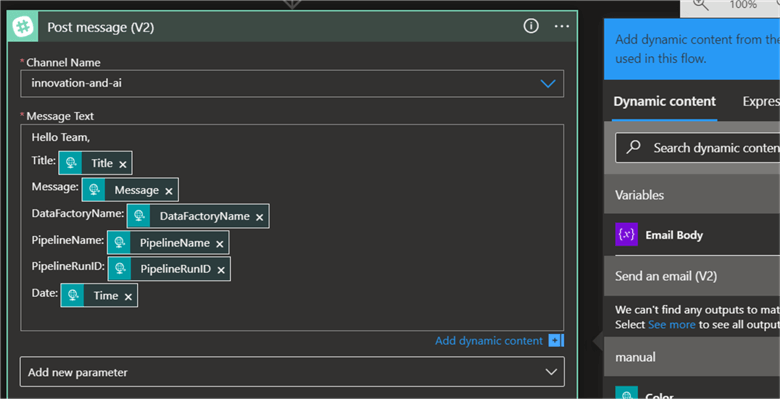
Step 2: Fill Post Message Action
In the Post message, fill in the required information, such as the Channel Name and Message Text. In the message text, use Dynamic Content for the information you want to send.
Step 3: Test & Debug
Let’s evaluate to see if what we created will work as expected. Head back to your ADF/Synapse Pipeline. Click Debug and wait for the pipeline to run.

The image above shows that the notification worked as expected. This approach allows information to be received faster and treated with great urgency.
Microsoft Teams For Pipeline Failure Notification
Microsoft created Teams as a collaboration platform with the goal of centralizing file sharing, meetings, communication, and app integration inside a company. It also offers other features such as chat, video conferencing, file sharing, and integration with other Microsoft and third-party applications.
Microsoft Teams is widely used by big organizations as their primary means of communication, so integrating Azure Data Factory/Synapse Pipeline notification based on pipeline runs will be of great advantage.
Configure Azure Data Factory Connector in Microsoft Teams
We need to configure ADF in Teams to achieve the pipeline failure notification system.
The following steps should be followed to achieve this:
Step 1: Add Incoming Webhook Connector
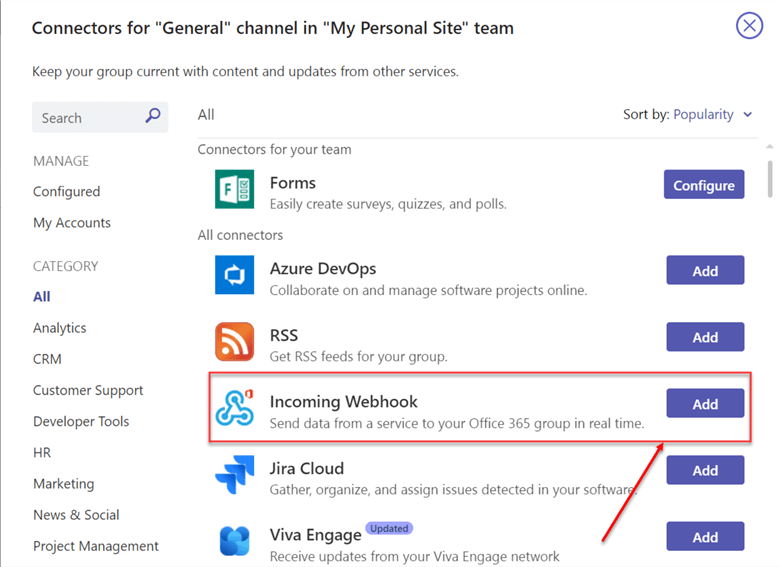
Open the Microsoft Teams app or Teams on the web. Pick the team you want to use, click the three dots, and select Connectors.

In the Connector, search for Incoming Webhook, then click Add.
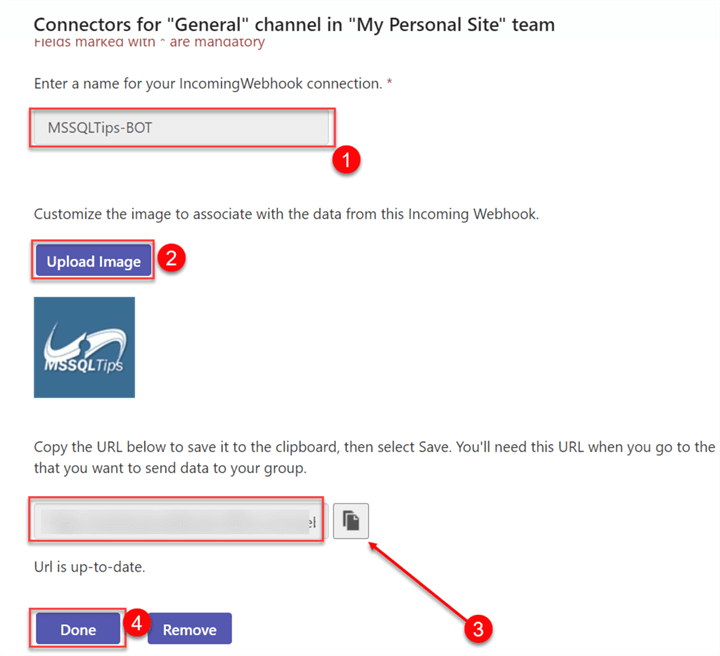
Step 2: Configure Webhook
Next, we need to configure the Webhook. Click the configure button. This should open a new window.
In the new window, fill in the following information:
- Name: Give the Webhook a name for easy identification.
- Upload Image: This is optional, but you can use it to better personalize your connector.
- URL: Copy the URL that will be needed in the ADF/Synapse pipeline.
Set Webhook Connector to Pipeline
Now that we have created the Webhook connector, head to Azure Data Factory, where we will add the necessary activities.
Step 1: Add Web Activity
Since we need to send a signal of a failed pipeline to Microsoft Teams, we need to add a web activity to our pipeline and join it to the failed path.

Step 2: Configure Web Activity
Click on Web activity and select Settings. Here, paste in the URL link you got from Team Webhook Connector and change the Method to POST.
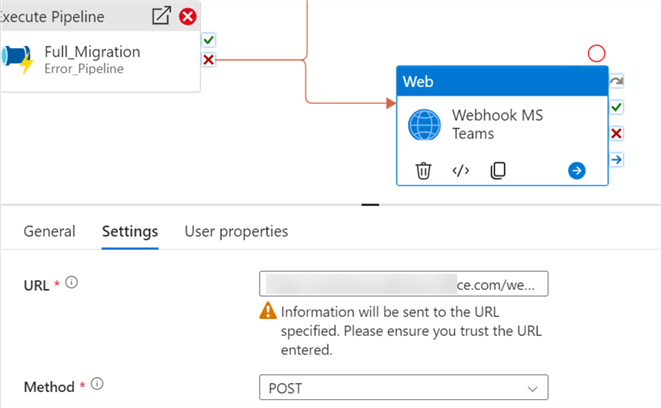
In the Body, paste the message you want to send to Microsoft Teams.

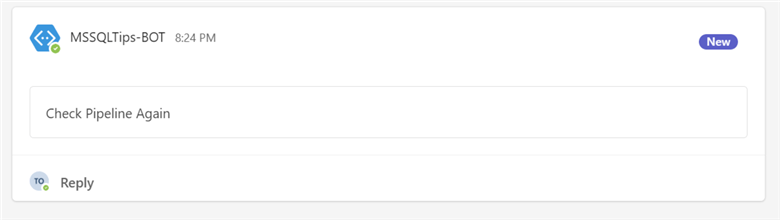
{"summary":"Pipeline Failed","text":"Check Pipeline Again"}Step 3: Test Pipeline
Click Debug and head to Microsoft Teams to confirm if the pipeline ran successfully.
You will see the BOT message in your Microsoft Team Channel. You can improve the message further by adding more parameters and dynamic content.
Conclusion
This article continues the modern data pipeline. We have learned the importance of quick response to pipeline failure and how it helps improve the overall data migration. Also, we covered aspects like creating notifications on Azure Data Factory Monitor. We created a customized email notification using Azure Logic Apps and included the Slack action in the notification flow. Lastly, we discussed how to send failed notifications to Microsoft Teams.
Next Steps
- Send notifications to a Microsoft Teams channel from an Azure Data Factory or Synapse Analytics pipeline
- azure-data-factory-send-email-notifications
- Workflow Orchestration with Azure Logic Apps to Move Data.
- Overview of Azure Analysis Services and Logic App Tasks

Temidayo Omoniyi is a Microsoft Certified Data Analyst, Microsoft Certified Trainer, Power Platform Developer, Azure Data Engineer, Content Creator, and Technical writer with over three years of experience.
Currently, he works as a data and business intelligence analyst for a training and consulting company in Lagos, Nigeria.
Temidayo enjoys creating educative content on YouTube, LinkedIn, Twitter, and other online platforms. He loves sharing his knowledge and writing about systems, applications, tools, and processes.
Apart from training, writing, and coding, you will find him watching and reading Anime. He is a big fan of DC Comics.
- MSSQLTips Awards: Trendsetter (25+ tips) – 2025 | Author of the Year – 2023, 2024