Problem
In today’s world, data comes from a variety of sources, both cloud and on-premises. A scalable and reliable workflow for data processing, transformation, and analysis is of top importance. Choosing the right technology for ETL is more crucial than even the actual ETL process. Companies have always sought the best ETL tool that provides a modern data pipeline for their organization’s needs. In this article, we look at how to use Azure Databricks and Azure Data Factory to reach these goals.
Solution
Microsoft Services such as Azure Data Factory and Azure Databricks were introduced to solve the ever-increasing demands for data professionals from ingesting, transforming, and storing.
Azure Data Factory provides a centralized orchestration platform for data pipelines, and Databricks is a unified analytic platform for data professionals. It provides a suitable platform for data analysts, scientists, and engineers to collaborate easily.
Project Architecture
Let’s assume you have been tasked by your head of data to create a modern data pipeline that takes data from multiple sources that come in daily, transforms the data, and stores it in an Azure SQL database. The stored data in the Azure SQL database should be connected to Power BI for analysis by the business intelligence team. Lastly, you are expected to create a best practice solution using version control software and have the entire process automated.

Prerequisite
To follow along with this article, you are expected to have a basic knowledge of the following tools and have read some of these previous articles:
- Tools
- Azure Data Factory
- Azure Databricks
- Azure Data Lake Gen 2
- Articles
You are advised to read the above article before you start this project. The above links cover topics like mounting Azure Data Storage to Databricks, creating the necessary resources, and data transformation using Databricks.
Setting Up Git Notebook
In our previous article, we explained Git Integration Repo in Databricks Workspaces for Developer Collaboration For this article, we will use three notebooks in our Git Repository. The notebook for this project will also be available at the end of this article.
The following steps are used to transform and load the JSON file.
We will read data from Azure Data Lake Gen 2, transform it, create an external table, and load it as a parquet format to the silver container.
Note: You are not expected to run the line of code below in your Azure Databricks notebook using the all-purpose cluster. Write down the line of code and save it. We will run the entire process using the Databricks Workflow Job cluster.
Step 1: Set Data Schema. Setting the data schema restricts the data type and prevents schema evolution during data processing.
Start by importing all necessary libraries used for the schema:
from pyspark.sql.types import StructType, StructField, Integer Type, StringType, DoubleType, DateType, FloatType
Create a structure type and set all necessary schema for each field.
sales_schema = StructType(fields=[StructField("CustomerID", IntegerType(), True),
                                    StructField("LocationID", IntegerType(), True),
                                    StructField("ProductID", IntegerType(), True),
                                    StructField("SaleAmount", FloatType(), True),
                                    StructField("SaleDate", DateType(), True),
                                    StructField("SaleID", IntegerType(), True)
])
Step 2: Read Raw Data. Read the raw data from the Bronze Container in your Azure Data Lake Gen 2. It should be noted that the container had already been mounted before this process.
sales_bronze = spark.read. schema(sales_schema) .json("/mnt/snapnetadlg2/testfolder/raw_bronze_folder/full_sales.json")

Step 3: Write to Silver Table and Container. We will perform an incremental load to the external table and save the format as Parquet.
Parquet is an open-source columnar storage format for data. It is frequently used in big data processing and is made to be effective for both data storage and retrieval.
Set External Location. We need to set the external location where the parquet format will be stored in the Azure Data Lake after transformation.
#Set External Location Storage
sales_silver_location = "/mnt/snapnetadlg2/testfolder/silver_folder/sales_folder/"
The mode was set to OVERWRITE, which removes and replaces any previously existing data. We also saved the transformed data as a Table in Databricks Hive Metastore, which makes it easy for the Data Analyst to analyze the transformed data using SQL commands.
# Add the mergeSchema option - This will help with the data structure
sales_bronze.write.format("parquet")            .option("mergeSchema", "true")            .mode("OVERWRITE")            .option("path", f"{sales_silver_location}")           .saveAsTable("hive_metastore.silverdb.processed_sales")
Step 4: Repeat the Same Process for Other Notebooks. Recall that we have multiple notebooks. You must repeat the same transformation and loading process for each notebook.
Merge Dev-Branch to the Main Branch
After you are satisfied with the code in your Notebook, you are expected to create a pull request and merge the code with the main branch. This should be done for all the notebooks.
Step 1: Create a Pull Request. In your Databricks notebook, click on the Dev_branch Git icon. This should take you to another window.

Step 2: Commit & Push. Select the entire notebook since we plan to commit it all.

Step 3: Compare & Pull Request. Now, go to your GitHub Repo created in your account and create a Pull request. Click on the Compare & pull request icon to open another window.

In the new window, click on Create pull request.

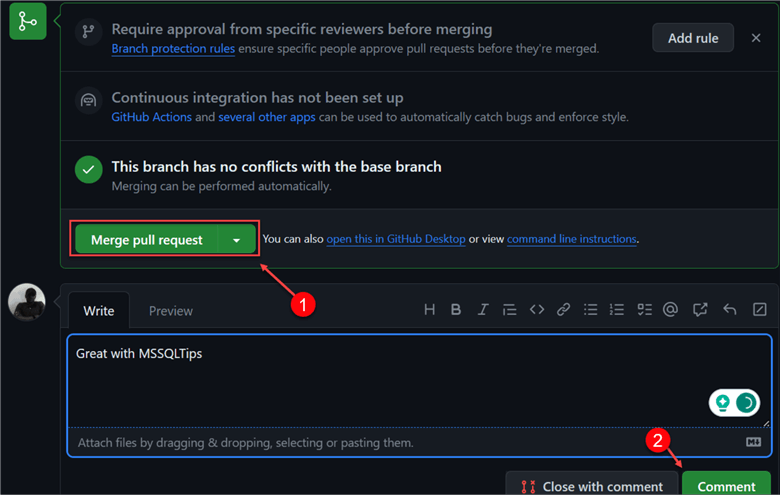
Step 4: Merge Pull Request. This is the last step. At this point, you need to merge the pull request with the main branch. Note: This step should only be taken if the code passes all requirements and the tech lead is satisfied with the entire process.
Start by clicking Merge Pull Request. This compares with the dev branch. Confirm the merge and add all necessary comments if there is no issue.
What is the Databricks Workflow?
The Databricks workflow is a fully managed, unified orchestration service introduced to help simplify the process for data analysts, scientists, and engineers using the Databricks Lakehouse Platform. It includes one-time Jobs and creating dependable and maintainable ETL pipelines using Delta Live Tables.
Databricks Jobs
Databricks Jobs allow users to process and analyze applications in the Databricks workspace. Your job may consist of a lone task or a sizable workflow with numerous tasks and intricate dependencies.
Creating a Databricks Workflow
Click the Workflows icon in the Azure Databricks portal and select Create job.

Step 1: Workflow Configuration. In the new window, fill in the following configuration settings:
- Task Name: A unique name for the task (Notebook) you want to run.
- Type: For the type, click the dropdown and select the type you want to run. For this demo, use the Notebook type.
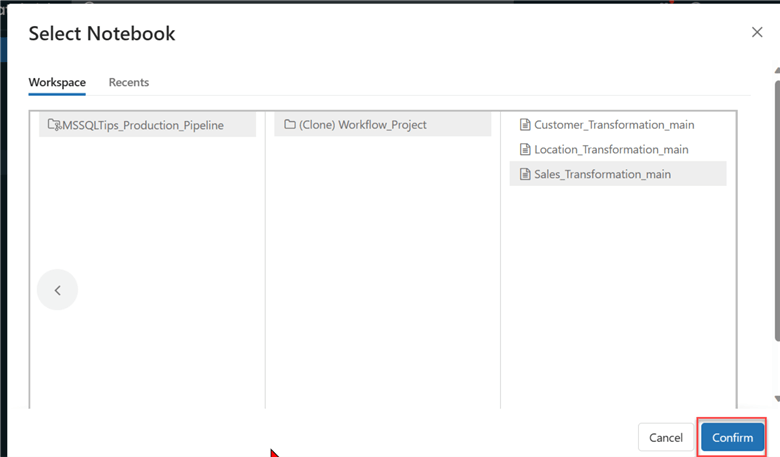
- Source: Choose from Workspace or the Git provider. Select the Notebook from the main branch since we have integrated our Databricks workspace with GitHub.
- Path: Provide the path to the notebook on your local notebook or Git repository. Follow the path in your Git Repo and select the notebook.
- Cluster: Configure the Job cluster you want to use for this task. Due to my subscription plan, I had to make some changes to the cluster configuration.
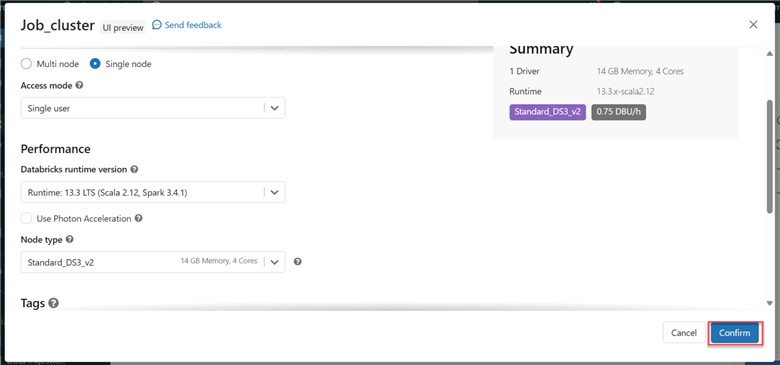
- Dependent libraries: These are optional. Dependent libraries are automatically attached upon cluster launch.
The other configurations are optional. When you are satisfied, click Create.

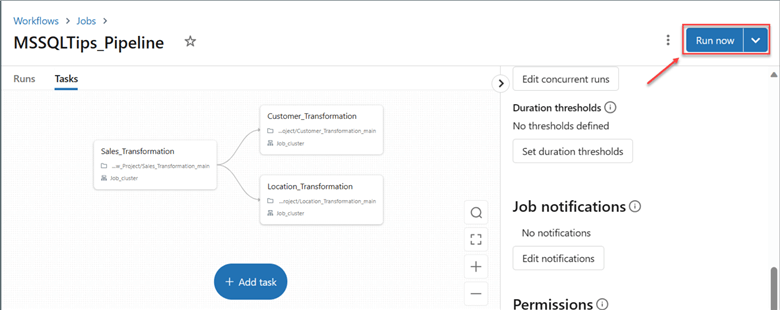
Step 2: Repeat Process. In your Databricks Workflow, click Add Task and repeat the process for the Customer and Location notebook.
Step 3: Run Job. After adding all necessary notebooks, click Run Now at the top right corner to perform an instant run. Note: You can also set triggers to run Jobs, such as the Scheduled Trigger and Event-based trigger (Storage).
We will use the manual trigger for this demo to start the entire process.
Step 4: Monitor Job. After several runs, the cluster ran successfully. If you are doing this for the first time, you might encounter a couple of errors, usually from the cluster configuration or your notebook code. Always double-check the code to ensure the elimination of any form of errors.

Azure SQL Database
The Azure SQL Database is a fully managed relational database service that supports the latest version of the Microsoft SQL Server and serves as our data warehouse that our data scientists and analysts will use to create their final reports.
Read our previous article on creating an Azure SQL Database in the Azure Portal.
Create Tables
In Azure SQL, create a table for all the different files we are working with:
CREATE TABLE processed_sales (
 CustomerID INT,
 LocationID INT,
 ProductID INT,
 SaleAmount Float,
 SaleDate Date,
 SaleID INT
)

GO

CREATE TABLE processed_location (
   City VARCHAR(50),
   Country VARCHAR(50),
   LocationID INT,
   State VARCHAR(50)
)

GO

CREATE TABLE processed_customer (
   CustomerID INT,
   Email VARCHAR(50),
   FirstName VARCHAR(50),
   LastName VARCHAR(50),
   Phone VARCHAR(30)
);
Now that we have successfully created the individual table in our Azure SQL Database, let’s go to Azure Data Factory.
Azure Data Factory
Azure Data Factory (ADF) is a fully managed cloud data integration platform that allows users to perform ETL processes using data-driven workflows or pipelines. Pipelines in ADF are a group of activities that perform a task. Check out our previous article to learn more about the components of a pipe link in ADF.
Copy Activity
Let’s start by performing a copy activity that involves moving data from Azure Data Lake Gen 2 to the Azure SQL Database.
A pipeline in ADF is comprised of five major components: source dataset, source linked service, sink dataset, sink linked service, and activity.

Create Linked Service
This linked service acts as a connection to an external data source or destination. Let’s start by creating the different linked services.
Source Linked Service. In ADF, click the Manage tab at the left corner and select Linked Services. In Linked Services, select New and search for Azure Data Lake Gen 2 in the Data store.
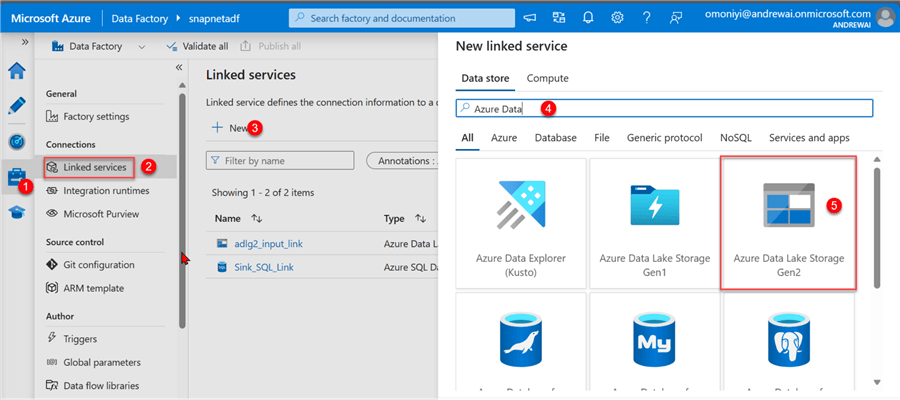
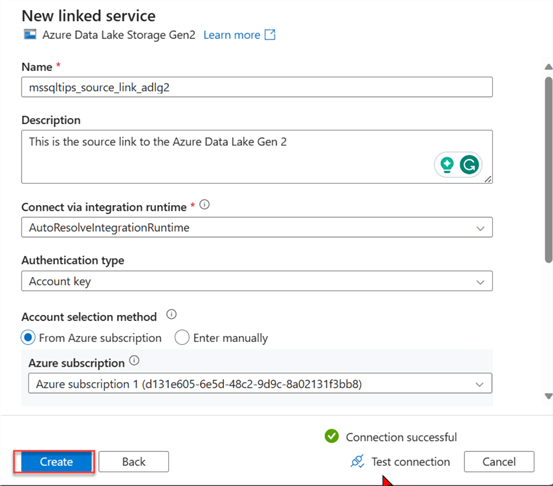
Complete the necessary configuration for the Azure Data Lake in the new window. Click Create.
Sink Linked Service. The exact process will be repeated for the sink link, but we will select the Azure SQL Database for the Data store this time. For the configuration, provide your username and password when connecting.

Create Dataset
The Dataset represents data that are stored in an external data source. It can be used as the source or sink of a data pipeline and defines the schema and location of the data.
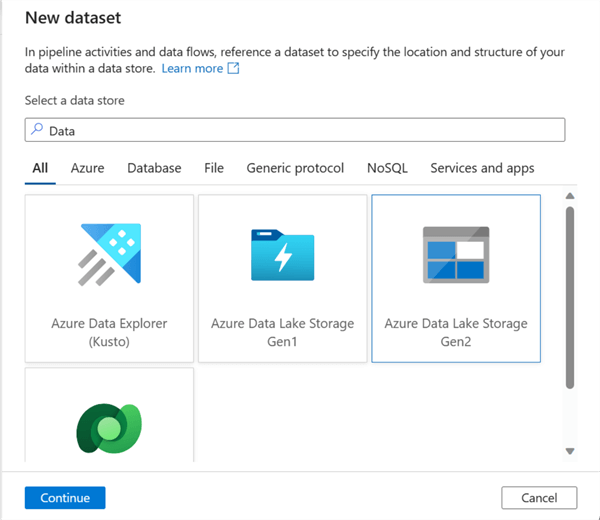
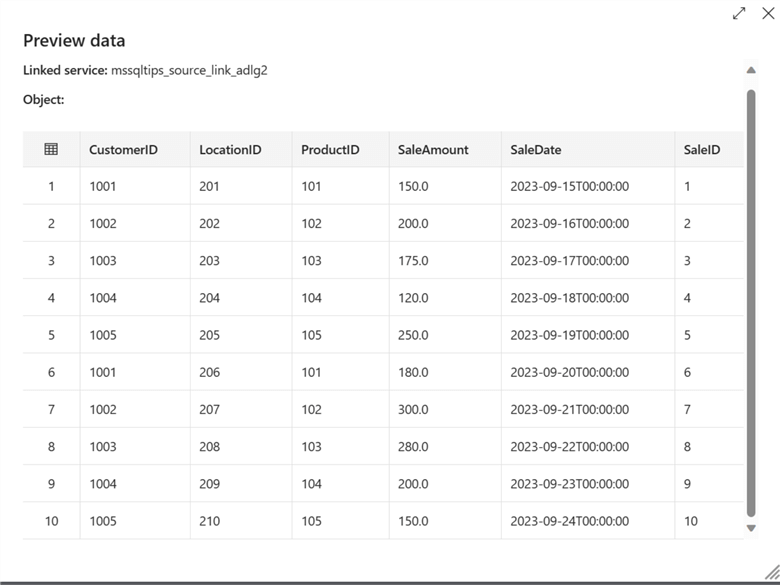
Create Source Dataset. The source dataset will be created as a new dataset by searching the data storage, Azure Data Lake Gen 2, and selecting the data type, a Parquet file.
After selecting the data type, we need to set the data configuration. For the File path, navigate to the folder where the Parquet files were loaded with Databricks and select the folder. This process will capture all the parquet files in that directory.

You can preview the data you want to migrate in your source data.
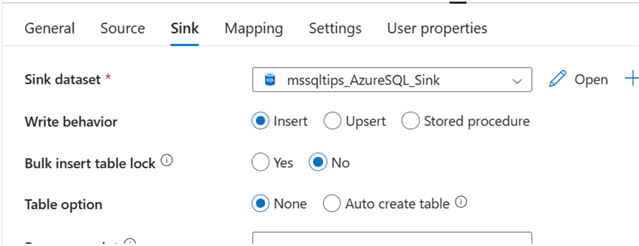
Create a Sink Dataset. In the Sink Dataset, fill in the following:
- Name: A unique name for the table.
- Linked Service: This is the Linked Service created for the SQL database.
- Table Name: This is the data table created in the Azure SQL database.

Copy Activities
Using the copy activity in ADF pipeline creation, we will move the data from the Azure Data Lake Gen 2 Silver folder to the Azure SQL Database.
Drag the copy activity to the pipeline design canvas before starting the configuration.
To achieve this, the following configuration should be conducted:
Source Configuration. This is the first configuration setting for the copy activity.
- Source Dataset: This is the source dataset we created earlier for the parquet file.
- File Path Type: We will use the wildcard to achieve this.

Sink Configuration. This is the SQL storage the data is loaded into, and the following settings are needed:
- Sink Dataset: Select the sink dataset we created earlier.
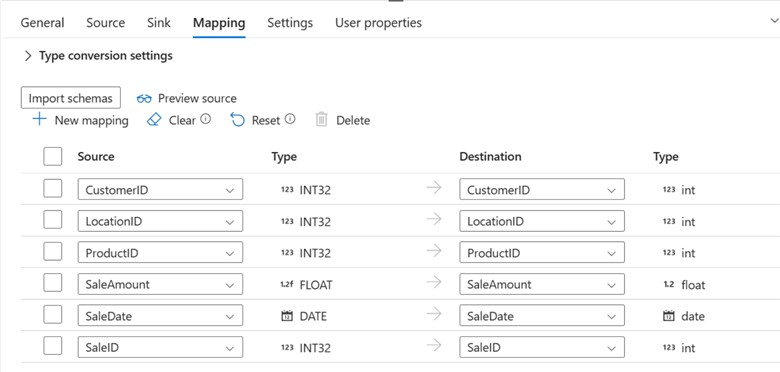
Mapping Configuration. This process involves defining how data is copied from source to destination. The appropriate columns between the source and destination datasets must be specified.
Publish All, Validate, and Debug. This is the final stage; when you are satisfied with the entire process, complete the following.
- Publish all in ADF is a way to publish all the changes made to the dataset. In other words, it simply means saving the entire process.
- Validate allows users to validate all processes conducted in ADF. This can be helpful to confirm that the dataset’s data satisfies specific requirements.
- Debug involves running your pipeline manually in your ADF. After manual debugging, you will observe the copy activity ran successfully.


Outcome
After debugging, we must observe the data copied to the Azure SQL Database. Go to your Azure Portal and select the database resource created.
Azure Data Studio. Azure Data Studio is a free, open-source, cross-platform data management and development tool that connects to well-known on-premises and cloud databases.
I will query the database in Azure Data Studio rather than using Azure Portal SQL Preview Query Editor.

You will also notice a total of 30 rows were copied into the database table.

Incremental Load
For this demo, data is expected in batches. We must perform an incremental load to take in new data and append it to the target system.
Incremental Load in Databricks
First, we need to perform the transformation and loading of new data to the silver container using Azure Databricks.
With the previous code, make the following changes:
Step 1: Change the Read Directory. Since the data will be received in batches, we need to change the directory to capture the newly uploaded data, sales_full_3.
sales_bronze = spark.read. schema(sales_schema) .json("/mnt/snapnetadlg2/testfolder/raw_bronze_folder/sales_full_3.json")
Step 2: Change the Load Mode. For the load mode, change it to APPEND, which will be used in adding new data into the target data.
# Add the mergeSchema option this will help with the data structure
sales_bronze.write.format("parquet")            .option("mergeSchema", "true")            .mode("APPEND")            .option("path", f"{sales_silver_location}")           .saveAsTable("hive_metastore.silverdb.processed_sales")
Step 3: Run the Notebook. Repeat the same changes for the other notebook and run the notebook in the Databricks workflow. The new parquet file has been added to the silver container, as seen in the image below.

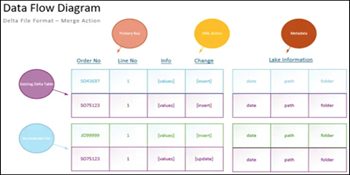
Azure Data Flow Comparison
Now that the new batch of transformed data has successfully moved to the silver container, let’s return to ADF to perform some transformation.
What is Azure Data Flow? The Azure Data Flow is a fully managed, cloud-based data transformation service that enables users to build and operate data pipelines without writing code. It offers a visual interface for creating data flows, which are directed acyclic graphs (DAGs) of data transformations.
Data Flow Transformation. We will use ADF to capture changes made to the source data and load it into the target (sink) data using different techniques in Data Flow.
Follow these steps to capture changes in the source data:
Step 1: Add Source Data. Fill in the following information:
- Output Stream name: Provide a unique name
- Dataset: Select the dataset created earlier.
- Projection: Check if the data are all in the correct format.
Step 2: Add Sink Data. The sink data will be used for comparison. Repeat the same process as Step 1, but the sink data will be Azure SQL Database this time.
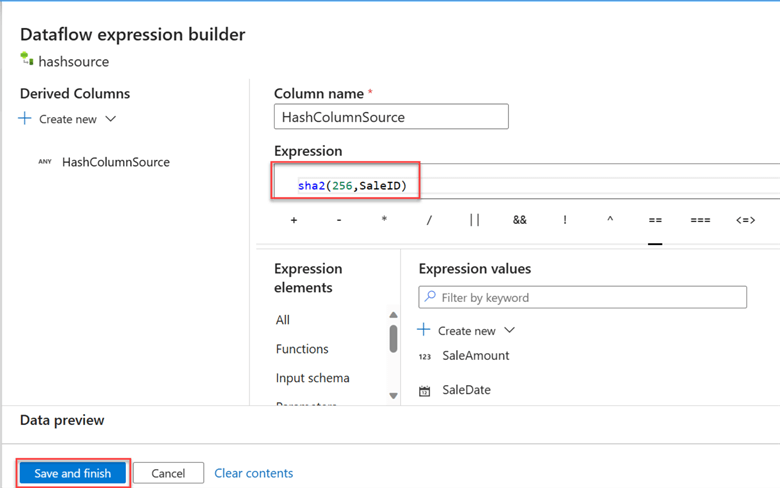
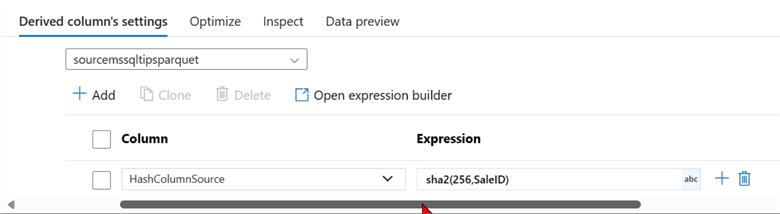
Step 3: Derived Column Source. Click the + (plus) icon and select the derived column. The derived column will be used for comparison with the sink data. We will add a Hash as a new column name.
The Derived Column setting needs a specific configuration. In the column name area, provide the new name you want the column to be called. For the expression builder, we will use SHA-2 (256,SaleID) on the Sales ID column since the Sales ID acts as a unique identifier for each record.
Step 4: Derived Column Sink. Repeat the same process for the Sink data source by adding another derived column and using the Sha2(256,SaleID) command.
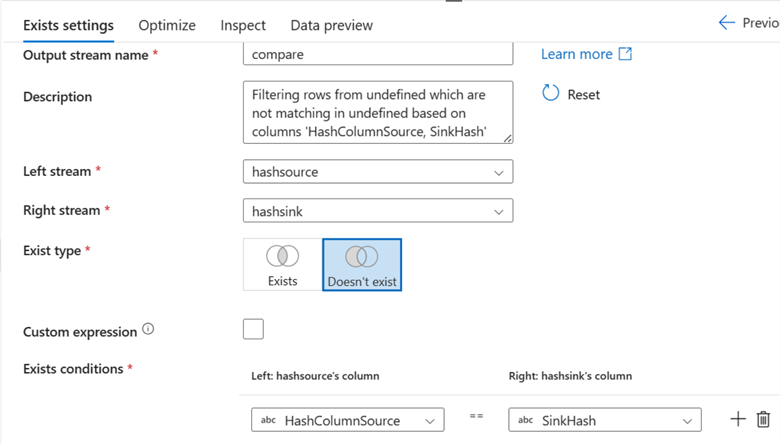
Step 5: Exist Transformation. The Exist transformation checks whether a row exists in another data stream. We will use it to compare the Source Hash column and the Sink Hash Column.
The following Existing settings are required:
- Left Stream: The source data-derived column will be your left stream.
- Right Stream: The right stream will be your target-derived data.
- Exist Type: Select Doesn’t Exist.
- Exists Condition: Equal the source hash column to the target hash column.
Step 6: Alter Row. Using the Alter Row step in Azure Data Flow, you can set insert, update, remove, and upsert rules on rows. Click on the + (plus) icon and select alter row.

Step 7: Add Sink. This is the last step; it is where we plan to load all the data into our Azure SQL Database.

For the Settings tab, ensure the following settings in the image below are completed:

Check the mapping to ensure each column is mapped to the appropriate fields:

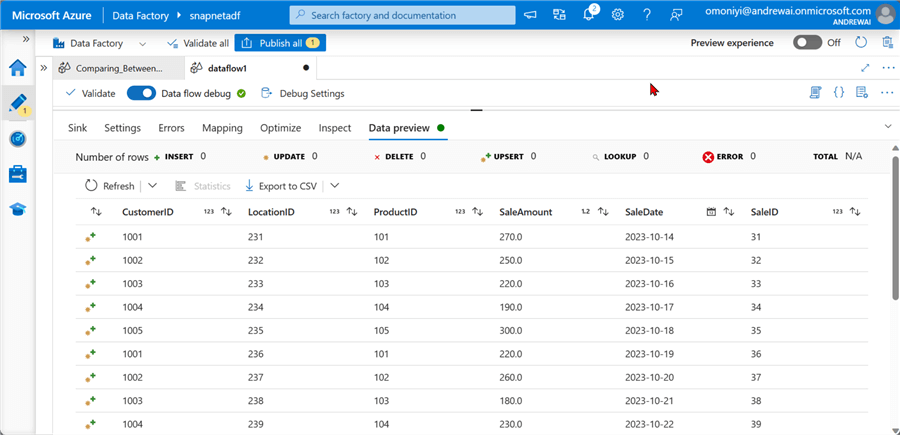
Data Preview
To use the Data Preview in Data Flow, click Data flow debug at the top left corner of your ADF. The data flow preview is used to debug your data flow, ensuring the data is processed correctly.
Debug Data Flow Pipeline
This is the final stage. When you are satisfied with creating the entire pipeline, the data flow in our pipeline must be run. Below is an image of the whole data flow pipeline.

Select the Author tab and add a new pipeline. In the activities, select Data flow and pipe the data flow just created. You are expected to debug to run the entire process.

Observe Changes
To observe the changes in the Upsert action to our Azure SQL Database, go back to Azure Data Studio and run the SELECT command.

To get the new total number of rows, use the count command.

Connect Power BI to Azure SQL Database
Microsoft Power BI is the world’s leading data visualization and analysis tool used by most data professionals to conduct descriptive analysis.
Connect Power BI to Azure SQL Database using the following steps:
Step 1: Get the Server Name
To get the server name, return to the Azure Portal and select the Azure SQL Database resource. At the Overview tab, copy the server name.

Step 2: Get Data
Click Get Data at the top left corner on the Power BI Desktop and search for Azure SQL Database. This will open another window where you must fill in the following information.
Step 3: Credential Login
In the new window, select the Database, provide credentials, and click Connect.

In the Power Query Navigation, select the tables you want to work with and click Transform. This should take you to Power Query Editor, where you can do further transformations in Power BI.

Conclusion
This article taught how to create a modern data pipeline using multiple platforms. We covered some of the best practices using Databricks Git integration and data orchestration using Databricks workflows for most data professionals. Also covered was how to perform incremental load using the comparison feature in Data Factory Data flows and loading of data into Azure SQL Database. Lastly, a walk-through was given to connect Power BI Desktop to Azure SQL Database.
Next Steps
- Change data capture in Azure Data Factory and Azure Synapse Analytics.
- Source control in Azure Data Factory.
- Continuous integration and delivery in Azure Data Factory
- Check out related articles:

Temidayo Omoniyi is a Microsoft Certified Data Analyst, Microsoft Certified Trainer, Power Platform Developer, Azure Data Engineer, Content Creator, and Technical writer with over three years of experience.
Currently, he works as a data and business intelligence analyst for a training and consulting company in Lagos, Nigeria.
Temidayo enjoys creating educative content on YouTube, LinkedIn, Twitter, and other online platforms. He loves sharing his knowledge and writing about systems, applications, tools, and processes.
Apart from training, writing, and coding, you will find him watching and reading Anime. He is a big fan of DC Comics.
- MSSQLTips Awards: Trendsetter (25+ tips) – 2025 | Author of the Year – 2023, 2024