Problem
When querying terabytes or petabytes of big data for analytics using Apache Spark, having optimized querying speeds is critical. There are a few available optimization commands within Databricks that can be used to speed up queries and make them more efficient. Seeing that Z-Ordering and Data Skipping are optimization features that are available within Databricks, how can we get started with testing and using them in Databricks Notebooks?
Solution
Z-Ordering is a method used by Apache Spark to combine related information in the same files. This is automatically used by Delta Lake on Databricks data-skipping algorithms to dramatically reduce the amount of data that needs to be read. The OPTIMIZE command can achieve this compaction on its own without Z-Ordering, however Z-Ordering allows us to specify the column to compact and optimize on, which will impact querying speeds if the specified column is in a Where clause and has high cardinality. Additionally, data skipping is an automatic feature of the optimize command and works well when combined with Z-Ordering. In this article, we will explore a few practical examples of optimizations with Z-Ordering and Data Skipping which will help with understanding the performance improvements along with how to explore these changes in the delta_logs and Spark UI.
Z-Ordering
We can begin the process by loading the airlines databricks-dataset into a data frame using the following script. Note that databricks-datasets are available for use within Databricks.
flights = spark.read.format("csv") .option("header", "true") .option("inferSchema", "true") .load("/databricks-datasets/asa/airlines/2008.csv")

Once the data is loaded into the flights data frame, we can run a display command to quickly visualize the structure of the data.
display(flights)

Next, the following script will create a mount point to an Azure Data Lake Storage Gen2 account where the data will be persisted. We’ll need to ensure that the access key is replaced in the script below.
spark.conf.set(
  "fs.azure.account.key.rl001adls2.dfs.core.windows.net",
  "ENTER-ACCESS_KEY_HERE"
)

The next code block will write the flights data frame to the data lake folder in delta format and partition by the Origin column.
(
  flights
  .write
  .partitionBy("Origin")
  .format("delta")
  .mode("overwrite")
  .save("abfss://data@rl001adls2.dfs.core.windows.net/raw/delta/flights_delta")
)

Once the command completes running, we can see from the image below that the flight data has been partitioned and persisted in ADLS gen2. There are over 300 folders partitioned by ‘Origin’.

Upon navigating to the delta_log, we can see the initial log files, primarily represented by the *.json files.

After downloading the initial delta_log json file and opening it with Visual Studio code, we can see that over 2310 new files were added to the 300+ folders.

Now that we have some data persisted in ADLS2, we can create a Hive table using the delta location with the following script.
spark.sql("CREATE TABLE flights USING DELTA LOCATION 'abfss://data@rl001adls2.dfs.core.windows.net/raw/delta/flights_delta/'")

After creating the Hive table, we can run the following SQL count script to 1) ensure that the Hive table has been created as desired, and 2) verify the total count of the dataset. As we can see, this is a fairly big dataset with over 7 million records.
%sql
SELECT Count(*) from flights

Next, we can run a more complex query that will apply a filter to the flights table on a non-partitioned column, DayofMonth. From the results display in the image below, we can see that the query took over 2 minutes to complete. This time allows us to set the initial benchmark for the time to compare after we run the Z-Order command.
%sql
SELECT count(*) as Flights, Dest, Month from flights WHERE DayofMonth = 5 GROUP BY Month, Dest

Next, we can run the following OPTIMZE combined with Z-ORDER command on the column that we want to filter, which is DayofMonth. Note that Z-Order optimizations work best on columns that have high cardinality.
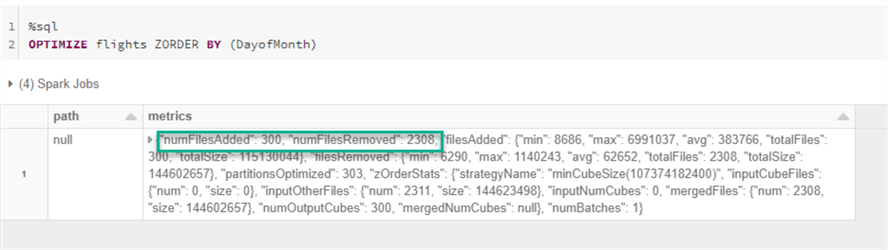
Based on the results, 2308 files were removed and 300 files were added as part of the Z-ORDER OPTIMIZE process.
%sql
OPTIMIZE flights ZORDER BY (DayofMonth)
Within the delta_log, there is now a new json file that we can download and open to review the results.

As expected, we can see the actions performed in these logs based on the removal and addition lines in the json file.

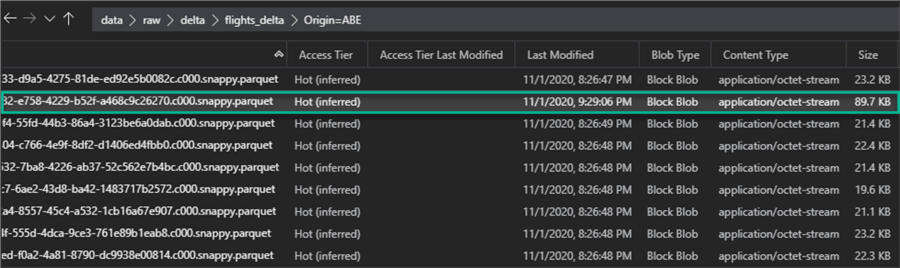
As further confirmation, upon navigating to within one of the partition folders, a new file has been created. While the Z-Order command can customize the compaction size, it typically targets around 1GB per file when possible.
Now when the same query is run again, this time we can see that it only took approximately 39 seconds to complete, which is around a 70% improvement in the optimized query speed.

Data Skipping
The previous demonstration described how to improve query performance by applying the Z-Order command on a column that is used in the Where clause of a query within the data set. In this next sample, we will deep dive in to understanding the concept of Data Skipping a little clearer.
Data skipping does not need to be configured and is collected and applied automatically when we write data into a Delta table. Delta Lake on Databricks takes advantage of these minimum and maximum range values at query time to speed up queries. Data skipping is most effective when combined with Z-Ordering.
Let’s explore a demo that is specific to Data Skipping and we will use the NYC Taxi Databricks data set for the demonstration.
Firstly, the following code will infer the schema and load a data frame with the 2019 yellow trip data.
Data = "/databricks-datasets/nyctaxi/tripdata/yellow/yellow_tripdata_2019-*"
SchemaDF = spark.read.format("csv")   .option("header", "true")   .option("inferSchema", "true")   .load("/databricks-datasets/nyctaxi/tripdata/yellow/yellow_tripdata_2019-02.csv.gz")
nyctaxiDF = spark.read.format("csv")   .option("header", "true")   .schema(SchemaDF.schema)   .load(Data)

This next code block will add few partition fields to the existing data frame for Year, Year_Month, and Year_Month_Day. These additional columns will be based on the Datetime stamp and will help with both partitioning, data skipping, Z-ordering and ultimately more performant querying speeds.
from pyspark.sql.functions import *
nyctaxiDF = nyctaxiDF.withColumn('Year', year(col("tpep_pickup_datetime")))
nyctaxiDF = nyctaxiDF.withColumn('Year_Month', date_format(col("tpep_pickup_datetime"),"yyyyMM"))
nyctaxiDF = nyctaxiDF.withColumn('Year_Month_Day', date_format(col("tpep_pickup_datetime"),"yyyyMMdd"))

After running a quick display of the data frame, we can see that the new columns have been added to the data frame.
display(nyctaxiDF)

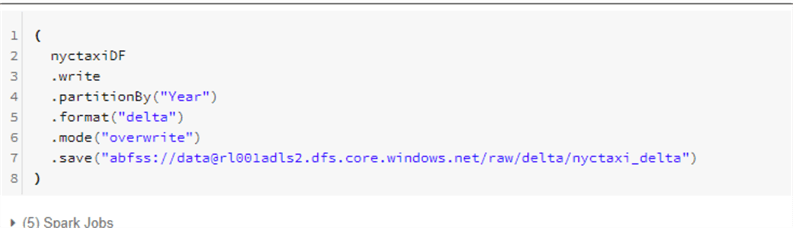
This next block of code will persist the data frame to a disk in delta format and partitioned by Year.
(
nyctaxiDF
 .write
 .partitionBy("Year")
 .format("delta")
 .mode("overwrite")
 .save("abfss://data@rl001adls2.dfs.core.windows.net/raw/delta/nyctaxi_delta")
)
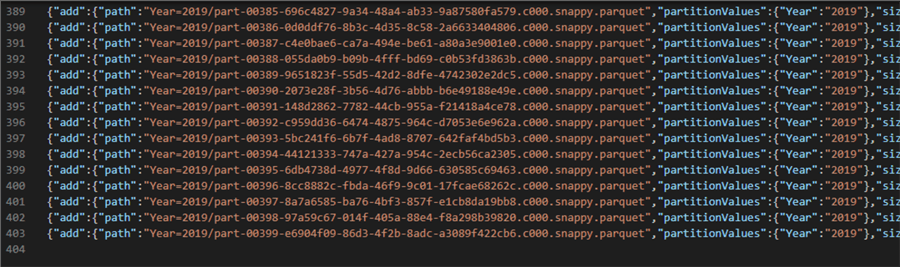
As we can see from the delta_log json file, there were ~400 new files added.
Next, we can create a Hive table using the ADLS2 delta path.
spark.sql("CREATE TABLE nyctaxi USING DELTA LOCATION 'abfss://data@rl001adls2.dfs.core.windows.net/raw/delta/nyctaxi_delta/'")

After running a query on the newly created Hive table, we can see that there are ~84 million records in this table.
%sql
SELECT count(*) FROM nyctaxi

Now its time to apply Z-Ordering to the table on the Year_Month_Day by running the following SQL code.
%sql
OPTIMIZE nyctaxi ZORDER BY (Year_Month_Day)
As we can see from the image below, the 400 files were removed and only 10 new files were added. Also, keep in mind that this is a logical removal and addition. For physical removal of files, the VACCUM command will need to be run.

To confirm that we only have 10 files being read in a query, let’s run the following query and then check the query plan.
%sql
SELECT Year_Month_Day, count(*) from nyctaxi GROUP BY Year_Month_Day

Since there are no where conditions applied to this query, the SQL query plan indicates that 10 files were read, as expected.

Now we can add a where clause on the column that was Z-ORDER optimized.
%sql
SELECT Year_Month_Day, count(*) from nyctaxi WHERE Year_Month_Day = '20191219' GROUP BY Year_Month_Day

Based on the SQL Query plan, we can now see that only 5 files were read which confirms that Data Skipping was applied at runtime.

Summary
It is important to note that Z-Ordering can be applied to multiple columns, however it is recommended to take caution with this approach since there will be a cost to adding too many Z-Order columns. There is also an AUTO OPTIMIZE feature that can be applied; however, the AUTO OPTIMIZE feature will not apply Z-Ordering since this will need to be done manually. Given the significant amount of time it takes to run the Z-Order command the first time, it would be recommended to consider running Z-ordering sparingly and as part of a maintenance strategy (ie: weekly etc.). Also, important to note that Optimize and Z-Ordering can be run during normal business hours and does not need to only run as an offline task. Z-Ordering can be applied incrementally to partitions and queries after the initial run, which would take much less time and would be a good practice as an on-going maintenance effort.
Next Steps
- Read more about Processing Petabytes of Data in Seconds with Databricks Delta.
- Read more about how to Optimize performance with file management.
- Take a look at more Optimization Samples from Databricks.
- Explore the feature and use cases for Auto Optimize.

Ron C. L’Esteve is a Data and AI Leader and professional Author residing in Chicago, IL, USA. He is well-known for his impactful books and article publications on Azure Data & AI Architecture, Engineering, and Leadership. Ron holds a Master of Business Administration (M.B.A.) and Master of Science in Corporate Finance (M.S.F.) from Loyola University Chicago. Ron possesses deep technical skills and experience in designing, implementing, leading, and delivering modern Azure Data & AI projects for numerous clients around the world. He is a Motorola Certified Six Sigma Green Belt, a Microsoft Global Challenger, and also holds numerous additional Microsoft, Snowflake, and Databricks professional certifications in Big Data Engineering, Artificial Intelligence, Apache Spark and Data Platform Architecture.
- MSSQLTips Awards: Champion (100+ tips) – 2023 | Author of the Year – 2020-2021 | Rookie of the Year – 2019


I appreciate your article, how can you tell how much of the performance enhancement was because of Zorder and how much was it because of compaction of the files into less and larger files? If you compacted the files first and queried, then added zorder and ran the query again I think it would have been a more exact comparison of “apples” to “apples”. I still liked the article and your explanations are crystal clear. Thanks
Very well explained, I was looking for this kind of demo on databricks website but found none.