Problem
In this article, we look at how to visualize time-series data using Excel with a walkthrough of how this is done with a sample dataset.
Solution
To visualize the time series data using Excel, we will take a look at radiation related data and use this as our dataset.
Time-Series Data Set
The radiation dose rate, measured in nanosieverts per hour (nSv/h), is a crucial parameter to quantify the amount of ionizing radiation in a specific environment. It indicates the rate at which radiation energy is deposited per unit of time, typically per hour, in a given area. Ionizing radiation can come from natural and artificial sources, including cosmic rays, terrestrial materials, medical procedures, and nuclear facilities. Monitoring radiation dose rates is essential for assessing environmental safety, radiation protection, and public health.
In this tip, we will try to answer the following questions:
- Correlation with Temperature:
- Does the radiation dose rate (nSv/h) exhibit any patterns or trends with temperature?
- Are there any instances where temperature variations coincide with changes in radiation dose rates?
- Effect of Rain Level:
- Does the presence of rain or varying rain levels impact radiation dose rates (nSv/h)?
- Is there any observed connection between rain events and fluctuations in radiation levels?
- Patterns:
- Are there any noticeable patterns in the radiation dose rate data over time?
- Do radiation levels tend to follow specific trends during certain seasons, and if so, can you identify the reasons behind these patterns?
Excel Data Set
This tip will work with an exported data set that’s in a tabular format and consists of the following columns:
- Measurement time (Datetime)
- Radiation Dose rate (Numeric, Unit: nSv/h)
- Temperature (Numeric, Unit: C)
- Rain level (Numeric, Unit: mm/h)
Visualizing Radiation Dose Rate
Inserting First Line Chart
We will start our tutorial by adding a new worksheet to our Microsoft Excel workbook. Click the plus (+) next to the Radiation Data tab, and name the new tab “Dose Rate.”

Navigate to the “Dose Rate” worksheet. Go to Insert, and click on the 2-D line chart in the Charts item group.

A blank chart will be added to your worksheet. Right-click on the line chart and choose “Select Data” to change the chart’s data source.

In the Select Data Source window, click in the “Chart data range” field, go to the Radiation Data worksheet, and select the whole table. Or, write the following value and click Tab: =Table1[#All]
Now, uncheck both the “Temperature” and “Rain Level” columns from the Series group.

Click OK and expand your line chart to fit on the visible area of the worksheet.

Improving the Chart’s Readability
As you can see, it is very difficult to read or visually extract the chart’s pattern in its current form. The main reason is that our chart has a zero-based Y-axis, while the values range from 40 to 70.
To customize the Y-axis, right-click on any value and click “Format Axis.”

Now, you can change the axis bounds as shown in the screenshot below:

Now, the chart is more readable.

Add Elements
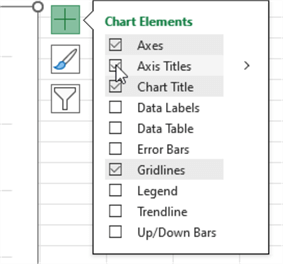
The next step is to add more elements to our chart. Click on the line chart, and a small “+” icon will appear in the top-right corner.

Now, review the “Axis Titles” checkbox.
Let’s edit the Chart Title to make it more informative by double-clicking it. Rename it “Radiation dose rate variation between Aug. 2015 and Aug. 2018”. Then, let’s edit the Y-axis title to “Dose Rate (nS/h)” and the X-axis title to “Measurement time“.

Moreover, we need to change the font size of the axis titles to 12pt and make all titles bold.

Congrats on your first line chart!
Time Series Analysis and Patterns
After visualizing the radiation dose rate variation, a pattern can be revealed from the first look. Still, it is not clear if it is a seasonality or cyclic pattern, and whether or not it has a trend. Besides, some outliers are causing some noise in the visualized values.
Trends
To check if these values have an overall trend, we need to add a linear trendline to our line chart.
Go to the Add Elements dialog, click on the arrow next to the Trendline checkbox, and click on “Linear”.

A dotted line will be added to the line chart, as shown below.

To make it clearer, let’s adjust the chart color. First, right-click on the series line and click “Format Data Series”.

Now, change the line color to orange.

Next, right-click on the trendline, and click “Format Trendline.”

Change the dash type to “Solid.”


Seasonality Pattern
To minimize the effect of visualizing outliers in our data series, we can add a new trendline by repeating the previous steps. But, this time, change the trendline type to “Moving Average” and the period from 2 days to 10 days.
The moving average trendline helps us minimize the noise caused by outliers.

Next, we can change the color of the trendline to “Dark Blue” and the dash type to “Solid”.

The trendline makes it clearer that each year the radiation dose rate increases from the end of October until the end of March and decreases until the following October.

Even if this pattern has an almost fixed period, it is not clear if it is a seasonality or cyclic pattern as we do not know its main cause. This is why we should investigate further and check the other facts in our dataset.
Visualizing Temperature and Rain Level
Since visually analyzing the radiation dose rate was not sufficient, we will now visualize both temperature and rain level data.
We need to create a new Excel worksheet named “Temperature + Rain level” and add a new line chart. This time, we need to select both the Temperature and Rain Level columns in the “Select Data” dialog.

As we are plotting two data series, we need to first add a legend to our chart. This can be done from the “Add elements” dialog.


Since the values’ distribution differs between Rain Level and Temperature, we can note that it is difficult to analyze rain level values if they are not shown correctly on the chart.
To solve this issue, we need to add a secondary Y-axis where we can adjust the axis boundaries. To do so, select the rain level line, right-click, and choose “Format Data Series”.

Now, select to plot the data series on a secondary axis.

Before we continue, let’s add the axis titles and edit them beside the chart title.
- Primary Y-Axis: Temperature (C)
- Secondary Y-Axis: Rain Level (mm/h)
- X-Axis: Measurement time
- Chart Title: Temperature and Rain Level Variation from Aug. 2015 till Aug. 2018

From this chart, we can see the seasonal pattern of the temperature and how it relates to the rain level.

Plotting All Data Together
The final step in this tutorial is to plot all the data series on the same chart. Maybe we should conclude with a correlation between different series.
Since the radiation dose rate is the most important data we have, we will plot both temperature and rain level on a secondary Y-axis. Next, we will customize the Primary Y-axis boundaries as [40-75]. (All steps are explained previously).
Before we continue, let’s add the axis titles and edit them beside the chart title.
- Primary Y-Axis: Dose Rate (nS/h)
- Secondary Y-Axis: Delete the title since it is related to two data series
- X-Axis: Measurement time
- Chart Title: Radiation, Temperature, and Rain Level between Aug. 2015 and Aug. 2018
We should add an annotation that mentions that the temperature and rain level values are plotted on the secondary Y-axis since the user may not be aware. Under Insert, click on Illustrations > Shapes > Textbox.

Now, move this text box to the top-right corner of the chart and write “The Temperature and Rain Level values are plotted on the secondary Y-Axis)” in red. Our line chart should look like the following:

From visually analyzing the chart, we can conclude that radiation dose rate values follow a seasonality pattern: when the temperature goes up, and the rain level goes down, the rate slightly goes down. (Remember that the radiation is measured with a tiny unit.) In contrast, when temperatures start to fall and the rain level increases, the radiation dose rate slightly increases.
Next Steps
- Learn how to preprocess data in Excel: Learn how to use Power Query in Excel to Transform Data
- Learn how to visualize time-series data using Python: Visualize Application Log Data with Python Matplotlib Charts

Hadi Fadlallah is an SQL Server professional with more than 10 years of experience. His main expertise is in data integration. He’s one of Stackoverflow.com’s top ETL and SQL Server Integration Services contributors. Also, he is a university lecturer and writes scientific and technical articles on several blogs. On the academic level, he holds a Ph.D. degree in data science focusing on context-aware big data quality and two master’s degrees in computer science and business computing.
- MSSQLTips Awards: Trendsetter (25+ tips) – 2025 | Author of the Year Contender – 2023 | Rookie of the Year – 2022