Problem
Microsoft Excel is one of the most famous self-service BI tools (Ehrenmueller-Jensen, 2020). When using Excel, users may need to use Power Query to extract data from various sources and reshape it as required. Then, the tool can perform data analysis and build reports. This way, business users can discover insights into the data without the help of IT. However, some domain experts may have little IT background and need assistance using Power Query. These experts may want to get their hands dirty and do some exercises showing the data preparation process. By practicing, they become familiar with Power Query. Then, they can independently perform data analysis.
Solution
Learning by doing is essential for developing many skills in the digital age (Bates, 2019). One of the most well-known ancient Chinese proverbs says: “I hear, and I forget. I see, and I remember. I do, and I understand.” The learning-by-doing approach is always an effective method for studying a data analysis tool. After people (especially those with little background in IT) practice data analysis techniques, they know what the desired data set should look like, remember how to prepare for such a data set, and understand why they should apply those data preparation steps. Then, they become comfortable giving computer instructions and independently working on data analysis projects.
In this tip, we give practice in the use of Power Query to handle a real business problem. For example, when evaluating sales performance, sales managers want to know detailed information about the salesperson who made the highest monthly sales and how much the top performers contribute to the total monthly sales. For demonstration purposes, the tip uses data from the Microsoft sample database “AdventureWorks2019,” a transactional database used by a fictitious multinational manufacturing company called Adventure Works Cycles. The report is created using Microsoft® Excel® for Microsoft 365 MSO (Version 2303 Build 16.0.16227.20202) 32-bit. The final report should look like Figure 1.
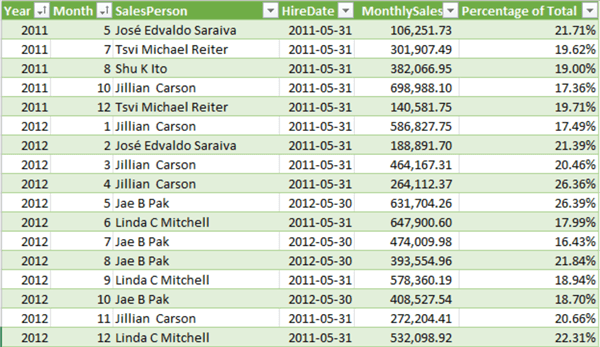
Figure 1 The top performers and their contributions to the monthly total sales
When generating a report, you should analyze business requirements and discover where to find all the required information. In this exercise, the data in this report are from the three database tables [Person].[Person], [Sales].[SalesOrderHeader], and [HumanResources].[Employee]. Then, you can use Power Query (a built-in feature for Excel 2016 or later for Windows and Microsoft 365) to read data from these tables, perform data transformation, and load data into an Excel spreadsheet. While walking through the process of using Power Query to prepare data, you explore the following techniques:
- Extracting data from a Microsoft SQL server database
- Choosing and removing columns
- Extracting date or time elements from date columns
- Data profiling and cleansing
- Grouping and summarizing rows
- Adding custom columns
- Previewing and expanding structured columns
- Merging queries
- Merging text columns
- Creating calculated columns
- Reordering columns
- Loading data to an Excel workbook
To get started, open Excel and go to the Data tab. The Get & Transform Data section should look like Figure 2. Then, you are ready to manipulate data.
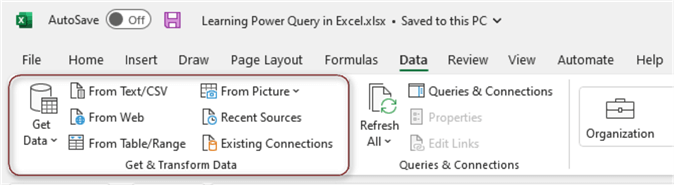
Figure 2 The Get & Transform Data group of the Data tab in an Excel File
1 – Extracting Data from a Microsoft SQL Server Database
Power Query can easily connect to various data sources (Alexander, 2022). For example, the tool allows you to explore a SQL server database without writing SQL scripts. Furthermore, the processes of connecting different data sources and loading data into the Power Query Editor are similar (Shruti, 2023). The following steps walk you through the basic steps of connecting a SQL server database. Note that other data sources may use different authentication types.
1.1 Select the Get Data Command
The first step in every version of the Power Query tool is to select Get Data in the Get & Transform Data group on the Data tab (Janicijevic, 2021). The pull-down menu appears, as illustrated in Figure 3. Power Query can import data from many data sources. In this exercise, select From Database and then from SQL Server Database.

Figure 3 A wide variety of connectors
1.2 Connect to the SQL Server Database
In the SQL Server database dialog box that appears, enter the SQL server instance name and the database name. Then, expand the Advanced options and make sure the Include relationship columns checkbox is unchecked. The dialog should look like Figure 4.
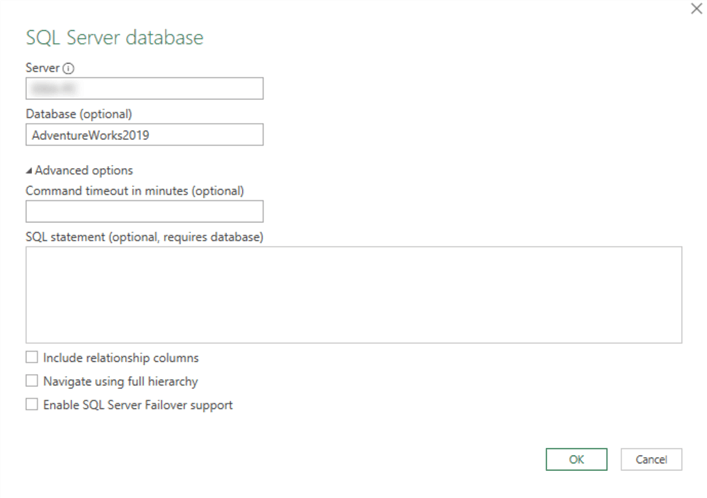
Figure 4 Creating a database connection
Next, click the OK button to open another dialog, as shown in Figure 5. In this dialog, specify the database authentication method. Then, click on the Connect button to connect to the database.

Figure 5 Specifying the authentication method
You may not know this information for establishing a database connection. You can copy these dialogs to database administrators (DBA) and ask them to help fill these dialog boxes.
1.3 Select the Three SQL Server Database Tables
After you connect to the database successfully, the Navigator dialog opens (see Figure 6). First, check the checkbox to select multiple items on the left pane. Then, select the three database tables:
- [Person].[Person]
- [Sales].[SalesOrderHeader]
- [HumanResources].[Employee]
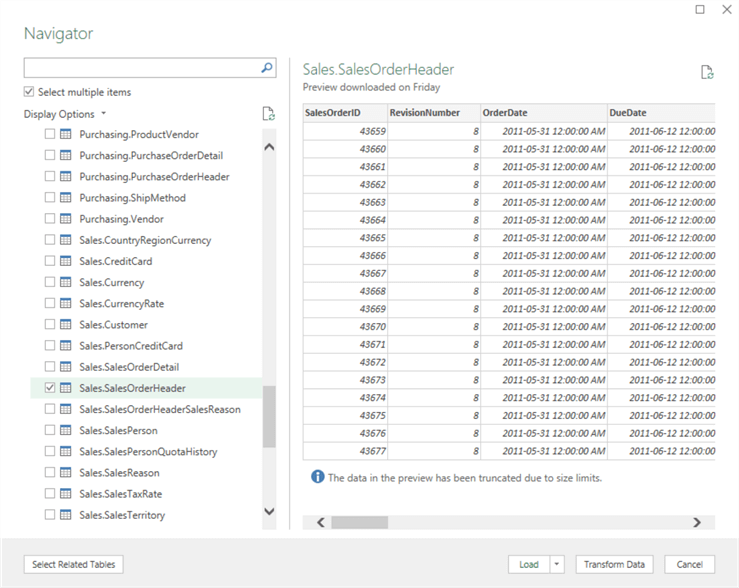
Figure 6 Selecting the tables in the Navigator dialog
When selecting a database table, you can preview data in the right pane of the dialog. You should choose all data tables required by the report, no more and no less.
1.4 Load Data into the Power Query Editor
Click on the Transform Data button in the Navigator to open the Power Query Editor, where you can perform data transformations. As illustrated in Figure 7, the Power Query Editor interface consists of the following major components (Raviv, 2018):
- The Ribbon: provides several ribbon tabs to add transformation steps or perform other actions to complete various tasks. If a button on the Ribbon has a downward pointing arrow underneath it, click that arrow to see other similar commands.
- Formula bar: shows the M code of the current transformation step. You can edit the M code in the formula bar.
- Queries pane: lists all the queries in the current editor. You can select, edit, or create queries in this pane.
- Data Preview pane: displays a preview of the data for your query. You can access many transformation commands from the arrow icons in the column headings or with a right-click on any element in the table.
- Query Settings pane: provides a view of the currently selected query with relevant information, such as query name, a chronological list of all the transformation steps applied to the data, and various indicators. You can modify the query here.

Figure 7 Loading data into the Power Query Editor
When you select a query in the Queries pane, the Query Setting pane displays the query’s properties (for example, name). This way, you can edit the Name text box in the Properties section to rename the query. Next, press the Enter key to confirm the rename operation. You use this method to rename the three queries:
- Person Person -> Person
- Sales SalesOrderHeader -> SalesOrderHeader
- HumanResources Employee -> Employee
2 – Choosing and Removing Columns
You loaded all data from the three database tables to the Power Query Editor. However, the report does not need all the information from these tables. Therefore, you can use Choose Columns or Remove Columns commands to specify what columns your table needs to keep and which ones it needs to remove. This section explores three methods to remove unneeded columns. It would help if you kept BusinessEntityID and SalesPersonID columns to merge the three queries later.
2.1 Use Choose Columns Command to Keep Columns
In the Queries pane, select the query Person. Next, select Choose Columns in the Manage Columns group on the Home tab. Then, the Choose Columns dialog box appears and contains all the available columns in the query. You need to select four columns, as shown in Figure 8. When selecting a few columns, you can uncheck the (Select All Columns) checkbox to clear the selection and then choose columns.
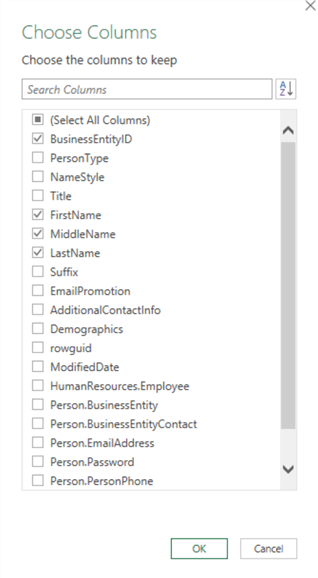
Figure 8 The Choose Columns dialog
Next, click on the OK button to close the Choose Columns dialog. The query has four columns, as shown in Figure 9. In the Query Setting pane, a new query step (Removed Other Columns) was appended in the Applied Steps box. You can select the x icon next to the step to delete the step. You can also click on the gear icon to reconfigure the step. In addition, the Formula bar displays the M code of the newly generated query step. The power query editor records and converts all your transformations into the M code (MacDougall, 2018).

Figure 9 Removing columns from the Person query
2.2 Use Remove Columns Command to Remove Columns
In the Queries pane, select the query Employee. Next, press and hold the CTRL key. Then, click on the column headings in the Data Preview pane to choose multiple columns. You use this method to select all columns except for BusinessEntityID, and HireDate columns, as illustrated in Figure 10.
Figure 10 Selecting multiple columns
Then, on the Home tab, select Remove Columns in the Manage Columns group. The command removes all selected columns. As shown in Figure 11, the query has two columns in the query: BusinessEntityID and HireDate. You can also observe the new query step added in the Query Settings pane and the M formula in the Formula bar. Since the code corresponds to each step, you can try to understand the code and build confidence in learning a computer programming language (Infante, 2020).

Figure 11 Removing multiple columns
2.3 Use Remove Other Columns Command to Keep Selected Columns
In the Queries pane, select the query SalesOrderHeader. Next, select multiple columns in the Data Preview pane in this order: SubTotal, SalesPersonID, and OrderDate. Then, select the Remove Columns > Remove Other Columns command on the Home tab, as shown in Figure 12. The command re-arranges the column order according to your selection sequence.
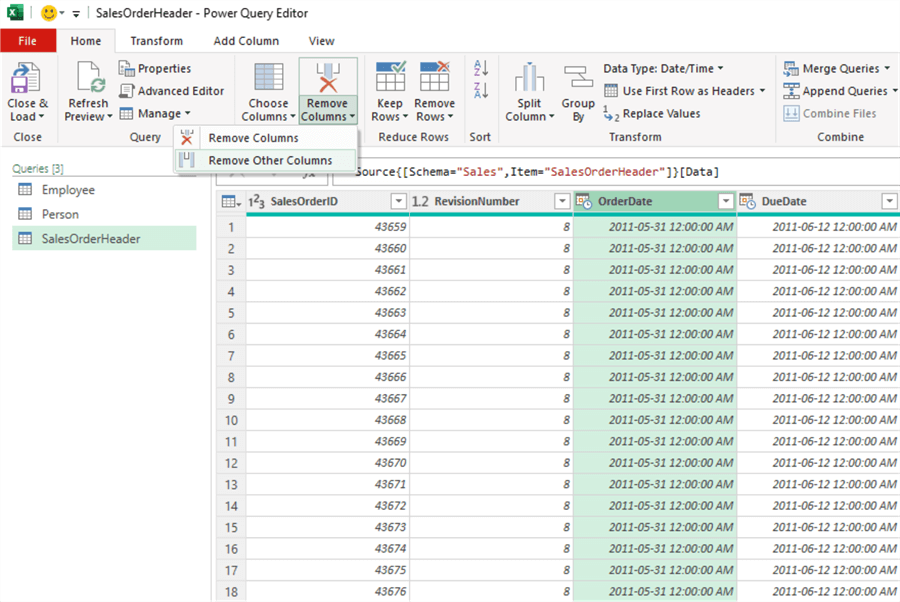
Figure 12 The Remove Other Columns command
After selecting the Remove Other Columns command, the SalesOrderHeader query only contains the SubTotal, SalesPersonID, and OrderDate columns, as shown in Figure 13.
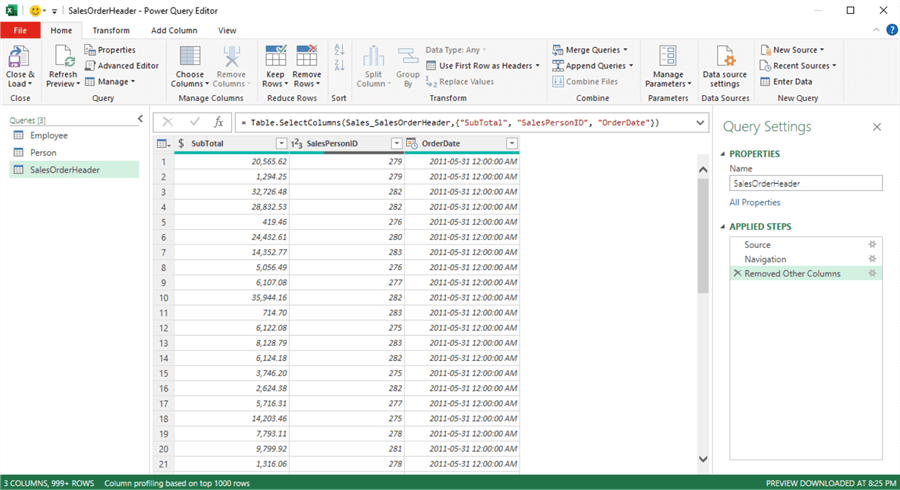
Figure 13 Removing the unselected columns
3 – Extracting Date Elements from Date Columns
Since the report needs to calculate the monthly sales, you must extract years and months elements from the OrderDate column in the SaleOrderHeader query. The Add Column and Transform tabs have a Date button and a down arrow underneath the button. Click that arrow to see many other date commands (for example, the Year and Month commands). There are several ways to obtain date and time elements from date columns. In this exercise, you use the Year and Month commands to pull years and months elements.
3.1 Extract the Years Element from the OrderDate Column to Create a New Column
In the Data Preview pane, click on the OrderDate column heading to select the column. Then, on the Add Column tab, in the From Date & Time group, select the Date > Year > Year command, as shown in Figure 14. After selecting the Year command, the command adds the Year column to the query.
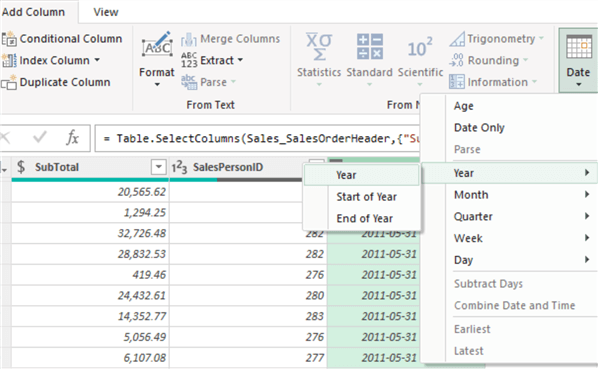
Figure 14 Extracting the years element as a new column
3.2 Transform the Date Column into a Month Column
In the Data Preview pane, click on the OrderDate column heading to select the column. Then, on the Transform tab, in the Date & Time group, select the Date > Month > Month command. The command transforms a Date column to a Month column containing only numeric month values. After renaming the OrderDate column to Month, the query preview should look like Figure 15.
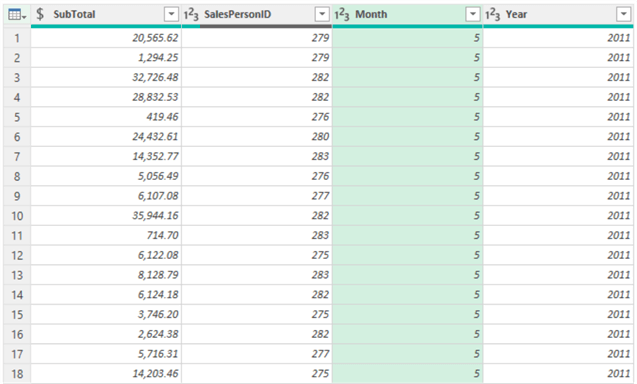
Figure 15 Extracting years and months elements from the date column
4 – Performing Data Cleansing
The original data may contain some undesired records, such as incorrect, incomplete, duplicated, and irrelevant (Stedman, 2022). The data cleansing process identifies erroneous data items and corrects them. Unfortunately, the process usually consumes countless hours for experienced data analysts (Microsoft Learning, 2023). In this tip, you use the Column Profile command to discover and investigate data quality issues in the SalesPersonID column and the Remove Empty command to clean data.
4.1 Column Profile
Select the SalesOrderHeader query in the Queries pane. Then, select the SalesPersonID column in the Data Preview pane. Next, select the Column profile command in the Data Preview group on the View tab, as shown in Figure 16.

Figure 16 Column profiling
By default, the Data Preview pane displays Column statistics and Value distribution based on the top 1000 rows. To change the profile to operate over the entire dataset, select the Column profiling based on the entire data set option in the lower-left corner of the editor, as illustrated in Figure 17. The whole data set has 27659 empty cells in the SalesPersonID column. The rows with empty SalesPersonID represent Internet sales; therefore, they are irrelevant to the report. You should remove them.
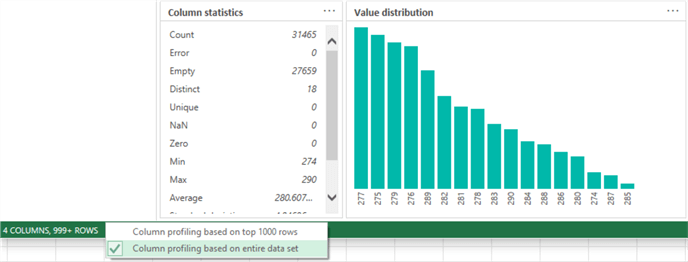
Figure 17 Column profiling based on the entire data set
Column profile is an excellent feature for understanding data and checking data quality. However, it is not recommended to enable this feature all the time because this feature may make the Power Query Editor slower. Therefore, disable the feature by unchecking the Column profile checkbox on the View tab soon after you have done data profiling.
4.2 Filter by Values in a Column
You see an icon with an inverse triangle in a column header. The Sort and Filter menu appears when you select this icon, as shown in Figure 18. With this menu, you select the Remove Empty command to remove all rows with an empty value in this column. So, you use this technique to remove all rows in the SalesOrderHeader query with an empty value of SalesPersonID. The menu indicates that you can define several filters. By and large, you can apply or remove any filters to or from the selected column (ptyx507 et al., 2008).
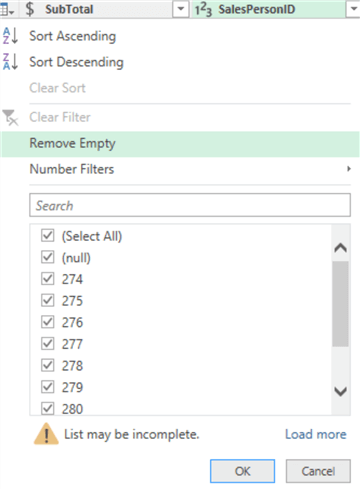
Figure 18 The Sort and Filter menu
5 – Grouping and Summarizing Rows
The SalesOrderHeader query contains sales transactions for every salesperson. However, the report wants to find who made the highest monthly sales and how much the top salesperson contributes to the total monthly sales. Therefore, you first need to summarize the customer order at the year-month and salesperson level. Then, you need to summarize every salesperson’s monthly sales volume at the year-month level.
5.1 Use an Aggregate Function to Group by Columns
Select the SalesOrderHeader query in the Queries pane. Then, select SalesPersonID, Month, and Year columns. Next, select Group By in the Table group on the Transform tab. In the Group By dialog that opens, enter MonthlySales as the new column name, select Sum from the Operation dropdown list, and select SubTotal from the Column dropdown list. The dialog should look like Figure 19.
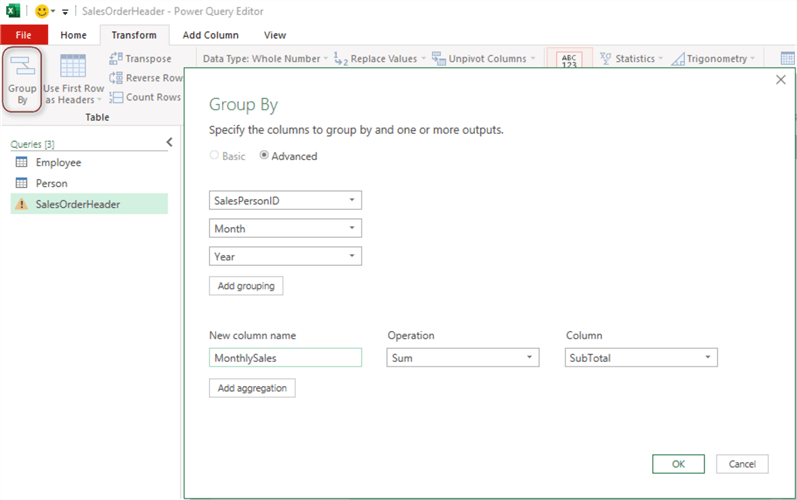
Figure 19 Grouping by multiple columns
The Group By command calculates the monthly sales for every salesperson. The preview of the SalesOrderHeader query should look like Figure 20.
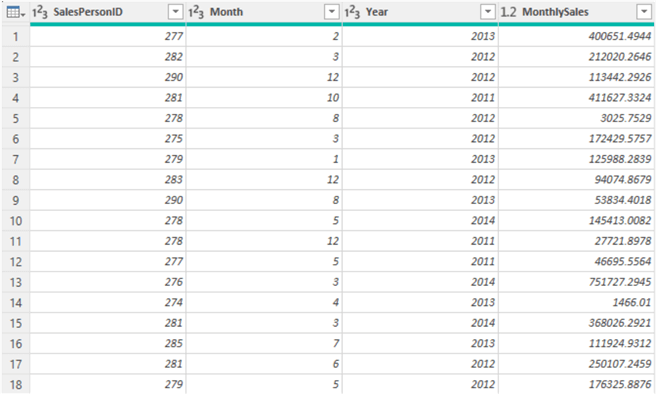
Figure 20 Every salesperson's monthly sales
Next, you select the Month and Year column and then select the Group By command again. Use the same technique in Step 5.1 to create a new column TotalMonthlySales. Next, add a new allRows column using the All Rows operation (Hansberry, 2020). The Group By dialog should look like Figure 21.
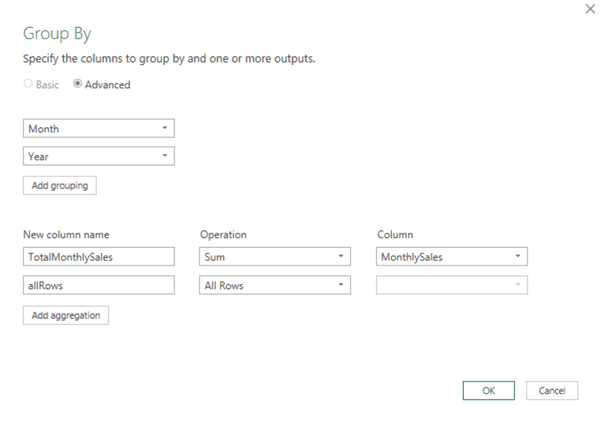
Figure 21 Creating two new columns when grouping
Click on the OK button to close the dialog. The Group By command creates two new columns. The allRow column is a Table structured column that stores a table. Each table value contains all the rows grouped by the Year and Month columns from the previous query. You can select the cell to see a preview of the table’s contents at the bottom of the dialog box, as shown in Figure 22. The figure illustrates that a table cell value indicates a many-to-one relationship with the current table.
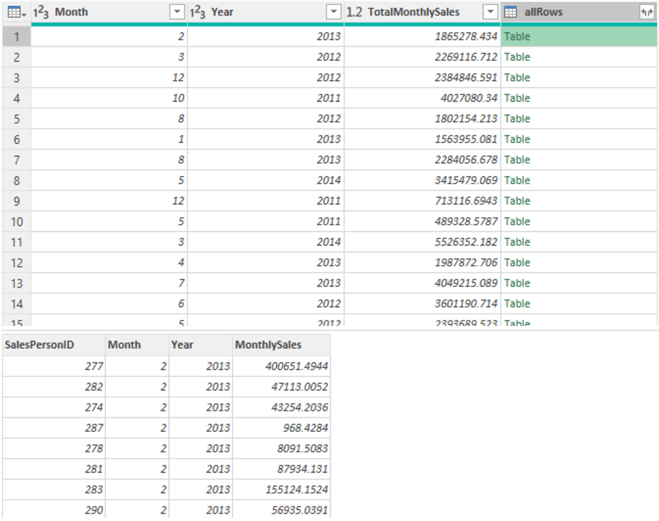
Figure 22 A preview of the contents of the Table structured cell
5.2 Add a Custom Column to Extract the Top Performer in Every Group
Select the Custom Column in the General group on the Add Column Tab. The Custom Column dialog appears as shown in Figure 23. Use the default name of the new column and enter the following formula in the Custom column formula box:
Table.Max([allRows],"MonthlySales")
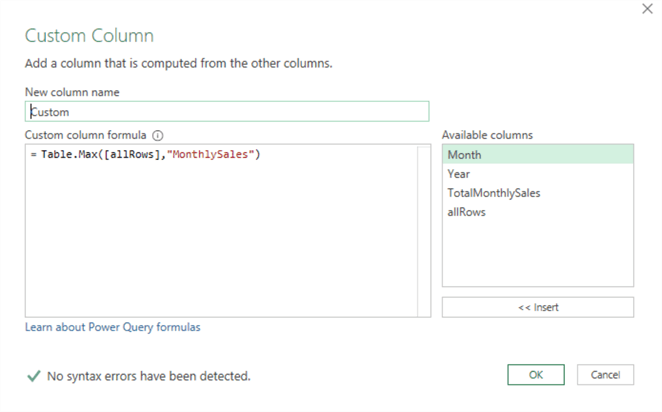
Figure 23 The Custom Column dialog
The Table.Max() function returns the largest row in a table. Therefore, the formula finds the maximum value for the MonthlySales column of each value in the allRows column. This way, the new column is a Record structured column, which indicates a one-to-one table relationship with the current query. You can select a value in the Record structured column to see a preview of the record's contents at the bottom of the dialog box, as shown in Figure 22.
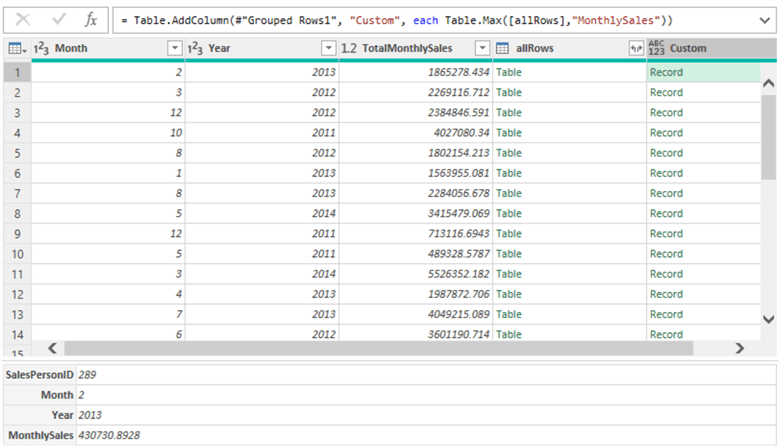
Figure 24 A preview of the contents of the Record structured cell
5.3 Expand a Record Structured Column
Next, click the expand icon in the column header of the Record structured column. Then, in the Column Name drop-down list that appears, select the columns you want. You can uncheck the Use original column name as prefix checkbox, as shown in Figure 25, since the column names are unique.
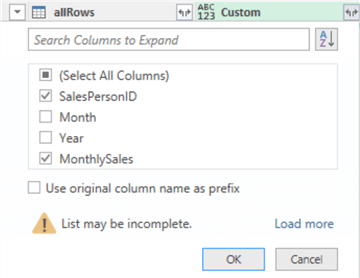
Figure 25 Expand a Record structured column
Then, click on the OK button to close the dialog. The Expand command adds two new columns to the SalesOrderHeader query. Remove the allRows column; the preview of the query should look like Figure 26.
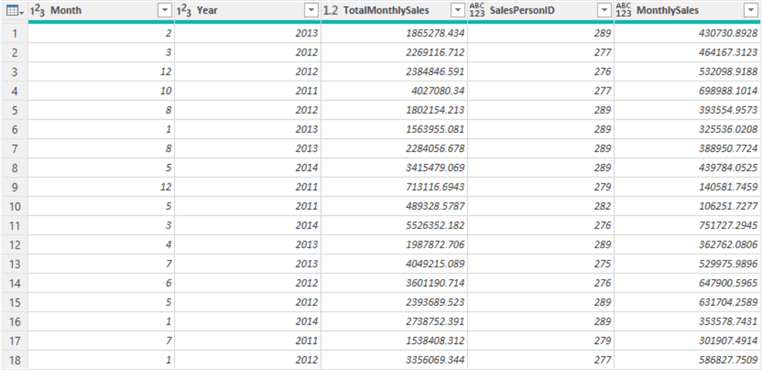
Figure 26 Each row representing the maximum value from one column when grouping
6 – Merging Queries
You created three queries, and each contains some information about salespersons. You can merge data horizontally to enrich the SalesOrderHeader query with columns from the Person and Employee queries. This way, you create a query containing detailed information about the top performers. You can use the Power Query Merge Queries command to join the records from one query to the records in another by matching on a unique identifier. The unique identifier could be one column or a composite of multiple columns. In this exercise, the unique identifier is the BusinessEntityID column. The SalesPersonID column represents the same unique identifier as the BusinessEntityID column.
6.1 Merge the Person Query into SalesOrderHeader Query
In the Queries pane, select the query SalesOrderHeader. Then, on the Home tab, in the Combine group, select the Merge Queries command. In the Merge dialog box that appears, select the SalesPersonID column and select the Person query from the drop-down list. Then, select the BusinessEntityID column in the Person query. Next, select Left Outer (all from first, matching from second) for the Join Kind field. The Merge dialog should look like Figure 27.

Figure 27 Left join two queries
After clicking the OK button, you can see a new column, Person, in the SalesOrderHeader query, as shown in Figure 28. The new column is a Table structured column.
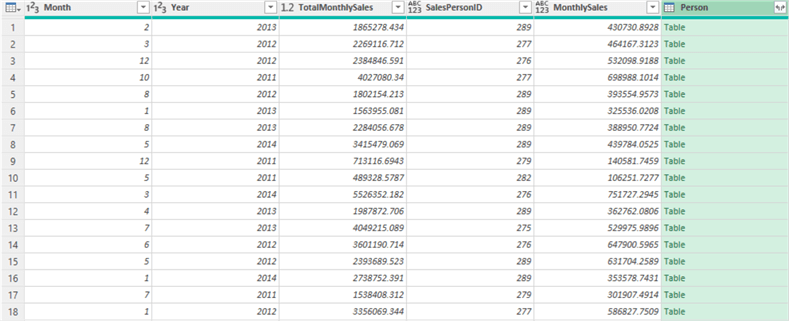
Figure 28 Adding a Table structured column
6.2 Expand a Table Structured Column
Click the expand icon in the column header of the Table structured column. Next, select the columns you want in the Column Name drop-down list that opens. Then, uncheck the Use original column name as prefix checkbox, as shown in Figure 29, since the column names are unique.
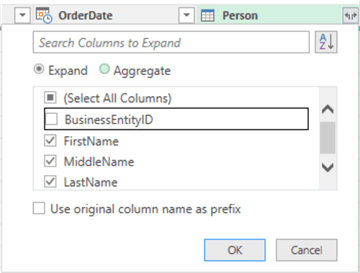
Figure 29 The Column Names drop-down list
Click on the OK button to close the dialog. The Expand command adds new columns to the SalesOrderHeader query, as illustrated in Figure 30.
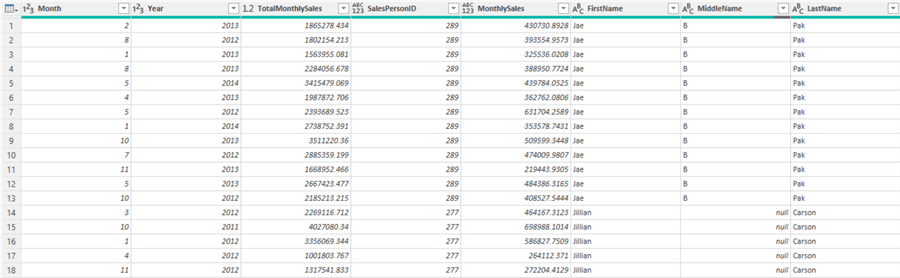
Figure 30 Expanding the Table structured column
6.3 Merge the Employee Query into SalesOrderHeader Query and Expand the Table Structured Column
Use the methods introduced in steps 6.1 and 6.2 to merge the Employee query into the SalesOrderHeader query. Then, remove the SalePersonID column. After you expand the Table structured column, the query preview should look like Figure 31.
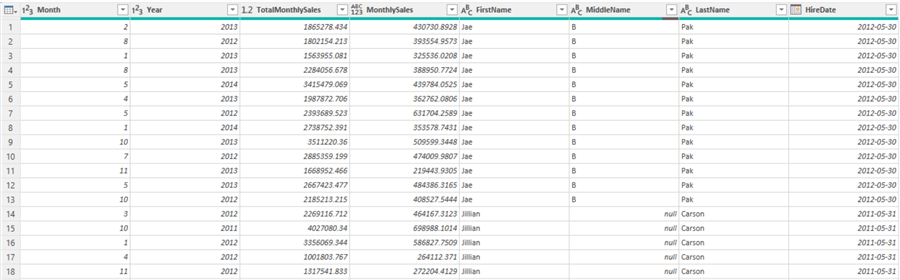
Figure 31 The merged three queries
7 – Merging Text Columns and Creating a Calculated Column
Salesperson names occupy three columns: FirstName, MiddleName, and LastName. The final report only needs the full name of each salesperson. Therefore, you should combine these three columns into one column. You can use Power Query to combine text columns to replace them with one column or create a new one adjacent to your merged columns (Higgins, 2022). Since the report does not need the original columns, you can use the newly merged column to replace the original three columns.
In addition, the report needs to show how much percentage the top performers contribute to the total monthly sales. The ratio can be found by dividing the values in the MonthlySales column by the value in the TotalMonthlySales column. Use the Standard->Divide command in the From Number group on the Add Column tab.
7.1 Merge Multiple Text Columns
In the Data Preview pane, click on the column headings to select the three columns: FirstName, MiddleName, and LastName. Then, on the Transform tab, in the Text Column group, select the Merge Columns command. The Merge Columns dialog appears. As shown in Figure 32, separate the text by space and name the new column SalesPerson.
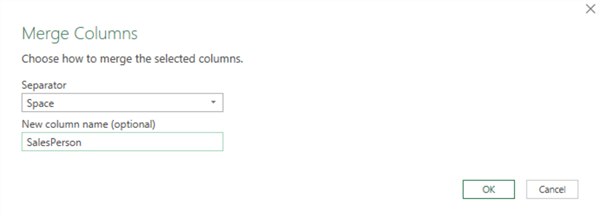
Figure 32 The Merge Columns dialog
Click on the OK button to close the dialog. The query preview should look like Figure 33.
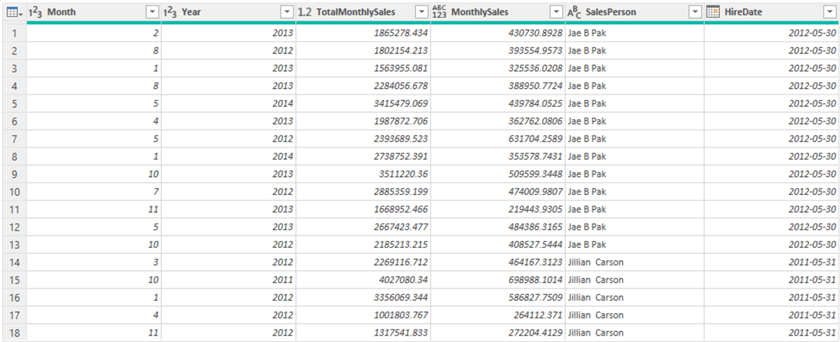
Figure 33 Merging the FirstName, MiddleName, and LastName columns into the SalesPerson column
7.2 Creating a Calculated Column
In the Data Preview pane, you first select the MonthlySales column, then select the TotalMonthlySales column. Next, you select the Standard > Divide command in the From Number group on the Add Column tab. The command creates a new column called Division. Rename the column to Percentage of Total. Then, delete the TotalMonthlySales column. The preview of the query should look like Figure 34.

Figure 34 The preview of the SalesOrderHeader query
8 – Reordering Columns
Reordering columns in a query is a typical process when preparing data. You can use the Move command or drag and drop columns to arrange columns. When you have dozens of columns or more, modifying the M function in the formula bar is another option (Acampora, 2021). The Move command provides four options: Left, Right, To Beginning, and To End. In this exercise, you arrange the columns of the query SalesOrderHeader in this order:
- Year
- Month
- SalesPerson
- HireDate
- MonthlySales
- Percentage of Total
8.1 Move the Year Column to the Beginning of the Table
In the Data Preview pane, click on the Year column heading to select the column. Then, on the Transform tab, in the Any Column group, select the Move > To Beginning command, as shown in Figure 35.
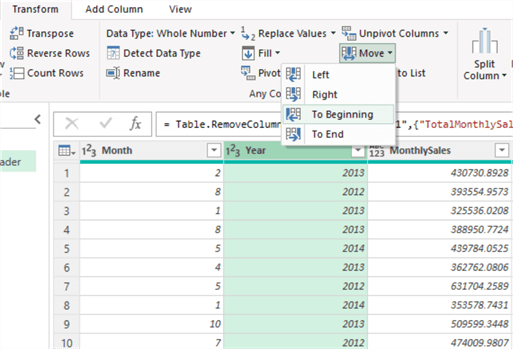
Figure 35 Moving the Year column to the beginning of the table
8.2 Drag the MonthlySales Column and Drop to the Left Side of the Percentage of Total Column
In the Data Preview pane, click and hold the MonthlySales column heading and drag the mouse to the left side of the Percentage of Total column. Then, release the mouse. The preview of the query should look like Figure 36.
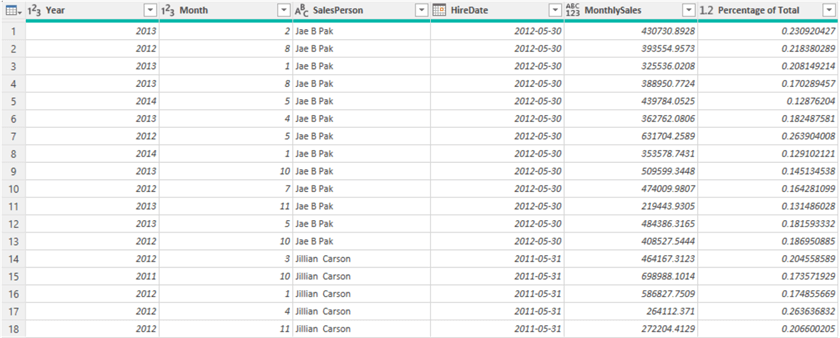
Figure 36 Arranging the columns
9 – Loading Data to Excel Workbook
The Close & Load button in the Close group on the Home tab has two options: Close & Load and Close & Load To, as shown in Figure 37. To load to a worksheet, select Home > Close & Load > Close & Load. If you want to load to a data model or create a connection early, select Home > Close & Load > Close & Load To.
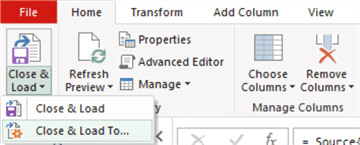
Figure 37 Load a query from the Power Query Editor to an Excel worksheet
If you select Home > Close & Load > Close & Load To command, the Import Data dialog opens, as shown in Figure 38. Since the queries Employee and Person are an intermediate step in the data preparation, you can select the Only Create Connection option. This way, the command creates connections with names the same as the query names. The connection only queries mean that there is no data output to the workbook, but you can still use this query in other queries.
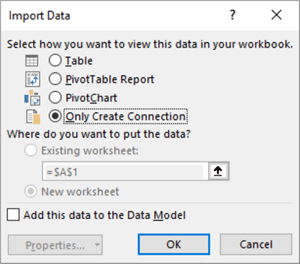
Figure 38 The Excel Import Data dialog
Click the OK button to close the Power Query Editor. Then, select the Queries & Connections command in the Queries & Connections group on the Data tab to show the Queries & Connections pane. Next, right-click the SalesOrderHeader query name in the Queries & Connections pane and select the Load To command from the context menu. The Import Data dialog opens. Select the Table option in the dialog and click on the OK button. After loading the data into a worksheet, you can use your Excel skills to format data and finalize the report, as shown in Figure 39.
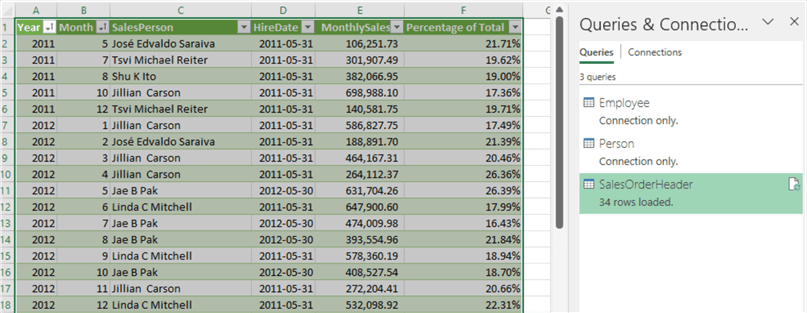
Figure 39 Load data to a table in your workbook
The report indicates that Shu K Ito made the highest monthly sales (i.e., $382066.95) in August 2011. This salesperson contributed 19% to the total monthly sales. You can also find out who are the top performers in other months. However, the data in May 2011 seems unreasonable because the salesperson joined the company on May 31, 2011. If the data is from an actual database, you should conduct further investigation.
Summary
Power Query is a business intelligence tool that allows you to import data from many sources and clean and transform data as needed. In this tip, you learned how to use Power Query to extract data from a SQL server database and perform data profiling, cleansing, and transformation. The article also explored the methods to load data to the Excel worksheet. According to the learning-by-doing approach, you should follow the steps in this article to create an Excel report. Such practice lets you familiarize yourself with the Power Query editor interface and these commands. Then, you can work on data analysis projects without assistance from IT.
Reference
Acampora, J. (2021). How to Reorder Multiple Columns in Power Query with Drag & Drop. https://www.excelcampus.com/powerquery/reorder-multiple-columns/.
Alexander, M. (2022). Excel Power Pivot & Power Query For Dummies, 2nd Edition. Hoboken, NJ: John Wiley & Sons.
Bates, A. W. (2019). Teaching in a Digital Age: Guidelines for designing teaching and learning. https://opentextbc.ca/teachinginadigitalage/
Ehrenmueller-Jensen, M. (2020). Self-Service AI with Power BI Desktop. New York, NY: Apress.
Hansberry, E. (2020). Return Row Based on Max Value From One Column when Grouping. https://www.ehansalytics.com/blog/2020/7/16/return-row-based-on-max-value-from-one-column-when-grouping.
Higgins, B. (2022). How To Use Power Query to Merge Columns. https://nexacu.com.au/insights-blog/how-to-use-power-query-to-merge-columns/
Infante, K. (2020). Why You Should Learn PowerQuery M as Your First Programming Language? https://medium.com/@kennethjhim/why-you-should-learn-powerquery-m-as-your-first-programming-language-5cb5c1ceb0ae
Janicijevic, A. (2021). Power Query Cookbook. Birmingham, UK: Packt Publishing.
MacDougall, J. (2018). The Complete Guide to Power Query. https://www.howtoexcel.org/the-complete-guide-to-power-query/.
Microsoft Learning. (2023). Automate data cleaning with Power Query. https://learn.microsoft.com/en-us/training/modules/automate-data-cleaning-power-query/.
ptyx507, Klopfenstein, D. & Howell. (2022). Filter by values in a column. https://learn.microsoft.com/en-us/power-query/filter-values.
Raviv, G. (2018). Collect, Combine, and Transform Data Using Power Query in Excel and Power BI, First Edition.
Shruti, M. (2023). Power Query in Excel: A Complete Guide. https://www.simplilearn.com/tutorials/excel-tutorial/power-query-in-excel
Stedman, C. (2022). DEFINITION: data cleansing (data cleaning, data scrubbing). https://www.techtarget.com/searchdatamanagement/definition/data-scrubbing.
Next Steps
- Power Query is a powerful tool for data-manipulating automation and is worth learning. The tool can save much time in repetitive data cleansing and transformation tasks. In addition, beginners can explore and manipulate data without coding anything. Business users unfamiliar with the Power Query editor should practice creating the report discussed in this article. To master these techniques, they should practice several times until they can prepare the data set themselves. Some methods (for example, merging queries) are challenging for beginners. They need to try some complicated data sets and implement different requirements. Additionally, the Power Query Editor is a user-friendly editor. The editor translates each step into the Power Query M language. Therefore, it is beneficial for beginners to learn the M language. Knowing the M language can help review the transformation process and remove unnecessary or duplicate steps.
- Check out these related tips:
- What is Power Query?
- Introduction to Power Query for Excel
- Query Folding in Power Query to Improve Performance
- Retrieve file sizes from the file system using Power Query
- Common Data Transformations in Power Query
- Create Calendar Table Using Power Query M Language
- Extracting a SharePoint List with Power Query
- Read API Data with Power BI using Power Query

Nai Biao Zhou has twenty years of experience in software development, with strong analytical skills and a broad range of computer expertise.
He has fifteen years of experience in development and maintenance of database applications on SQL Server in OLTP/OLAP/BI environments.
He has a master’s degree in Control Engineering and is pursuing a Master of Science degree in Predictive Analytics.
Knowledge/Skills
Advanced computer programming skills and well versed with C/C#, Java, ASP.NET, JavaScript, and SQL.
In depth knowledge of Solution Architecture, and Software Development Life Cycle (SDLC).
Microsoft Certified Application Developer (MCAD) since 2004.
- MSSQLTips Awards: Author of the Year – 2021 | Rising Star (50+ tips) – 2024 | Author Contender – 2020, 2023