Problem
Sometimes we get data from data sources (SQL Server, Excel, CSV file, OData, etc.) in formats which are not in a format that can be easily transformed using simple methods in Microsoft Power BI. This might be due to the complexity and structure of the dataset. Thus, it becomes a hectic task to write simple DAX calculations from the datasets or even use it in any form in Power BI development.
It is usually better to transform such datasets into forms which would require less complex DAX calculations with easily read and understood formats. This can be achieved within Power Query as described in this tutorial.
Solution
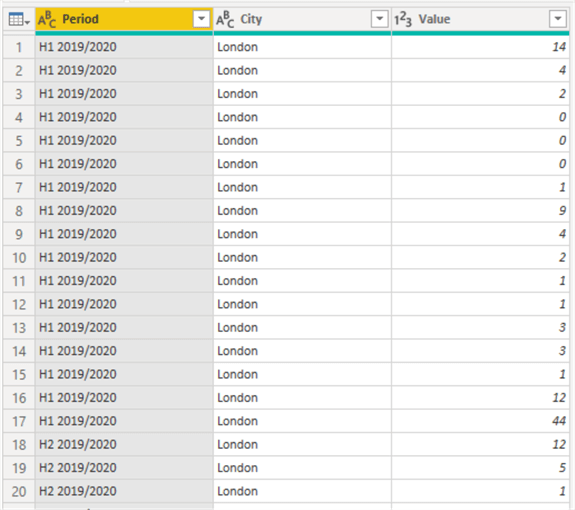
To demonstrate this process, we are going to transform the dataset as shown in the worksheet below from the current format into an easy to read format which would then make writing calculations and performing data analysis on it easier.

As you can see from the diagram, we have a table which is not so simple to read, quite complicated in nature. In this example, we have similar dataset formats for five cities of the United Kingdom to append into a single dataset in Power BI. There are other approaches to combining datasets in Power BI as demonstrated in this article, but due to the complexity of this dataset we would need to apply a different approach in this demonstration and come up in the end with the table as shown in the diagram below.
We would follow the steps below to transform the five datasets into a simple format as follows:
- Import data into Power BI from the source file (Microsoft Excel, SharePoint, CSV file, Text file, OData, etc.) or database (SQL Server, Azure, etc.)
- Fill Down the City names
- Move headers into first rows
- Transpose the table
- Promote first rows as headers
- Unpivot columns
- Cleanse the City Name column
- Rename columns appropriately
- Replace any special character values within the “Values” column with “0”
- Repeat the same transformations for each of the other datasets using M Query
- Combine the tables into one main table
- Disable table loads for other tables
STEP 1: Import the datasets into Power BI
Please check out this article on the approach on how you can import the datasets into Power BI with a new query. Once data importing is complete, you should be able to see the dataset like the screenshot below.

STEP 2: Fill Down the City names
As can be seen in the diagram above, the city name has a lot of “nulls” which would make the table a bit messy later, so we need to do a fill down to exclude the nulls. To do this, we need to right click on the “Column1” and then click on “Fill” and then “Down” as shown in the diagram below.
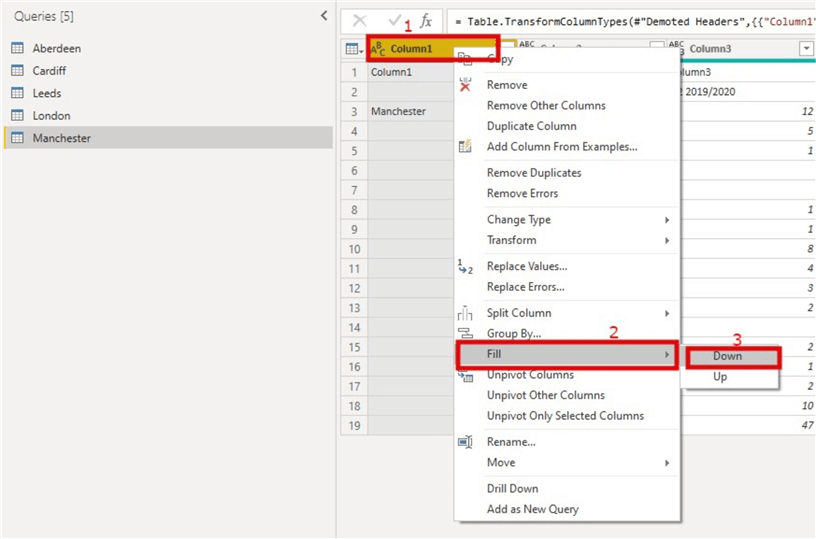
This would ensure each row with “nulls” under the city name is populated with the city name.

STEP 3: Move headers into first rows
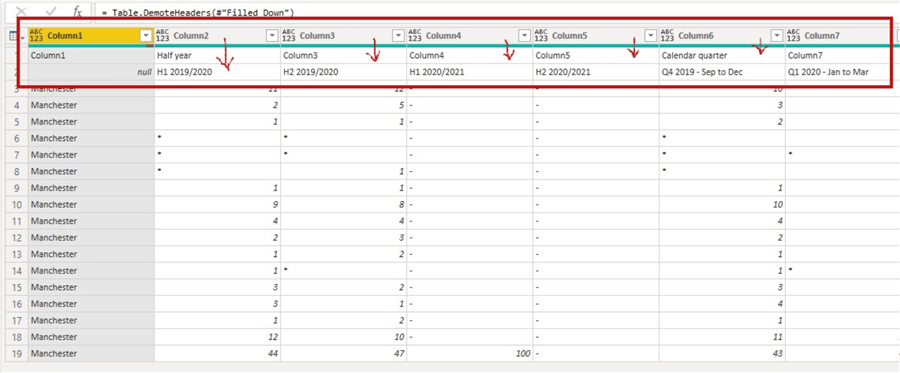
As you can see in the dataset, we have two rows that contain possible headers, we need to ensure this is in a less complex format by moving the “Half Year” and “Calendar Quarter” into columns. We also need to ensure the first-row values are in Columns too.
To do this, we first need to move the headers into first rows as seen in the diagram below. Within the “Home” ribbon click on the drop down on “Use First Rows as Headers” and select “Use Headers as First Row”
STEP 4: Transpose the table
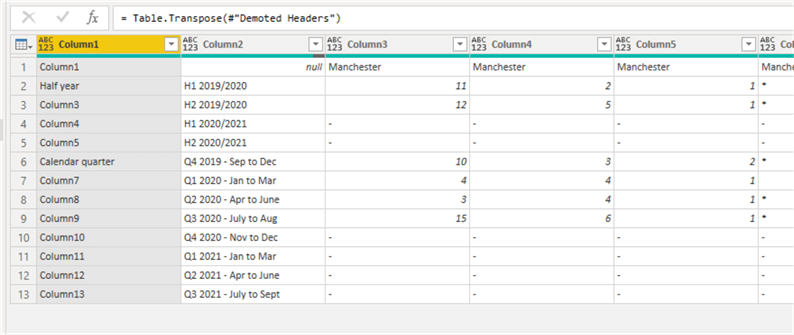
To do this click on “Column1”, then click on the “Transform” tab, then click on “Transpose” as seen in the diagram below.

You should now be able to see the table part as seen in the snapshot below.
And since we may not need “Column1” after all, we remove columns at this point.
STEP 5: Promote first rows as headers
Next, we need to promote the first rows as headers as seen in the diagram below.
To do this, we need go to the “Home” tab ribbon and select “Use First rows as Headers”.
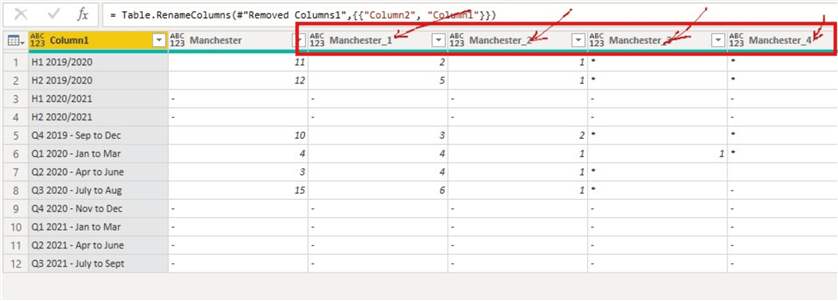
As you can see, there is some of the column headers city names having an attached underscore and a number. We will deal with this later.
STEP 6: Unpivot columns
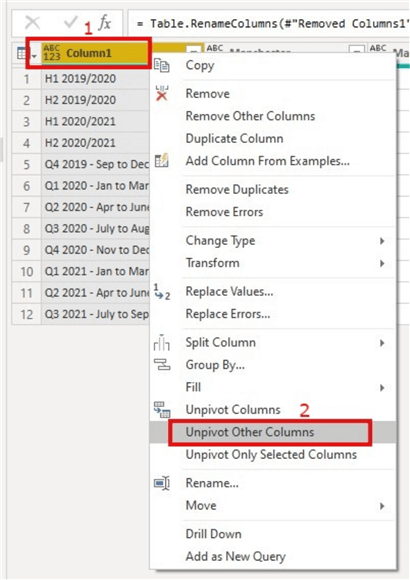
To do this, we need to right click on “Column1” and then select the “Unpivot Other Columns” as seen in the diagram below. Note that this column doesn’t contain numerical values.
This should transform the table into a more simplified three-column table as seen in the diagram below.
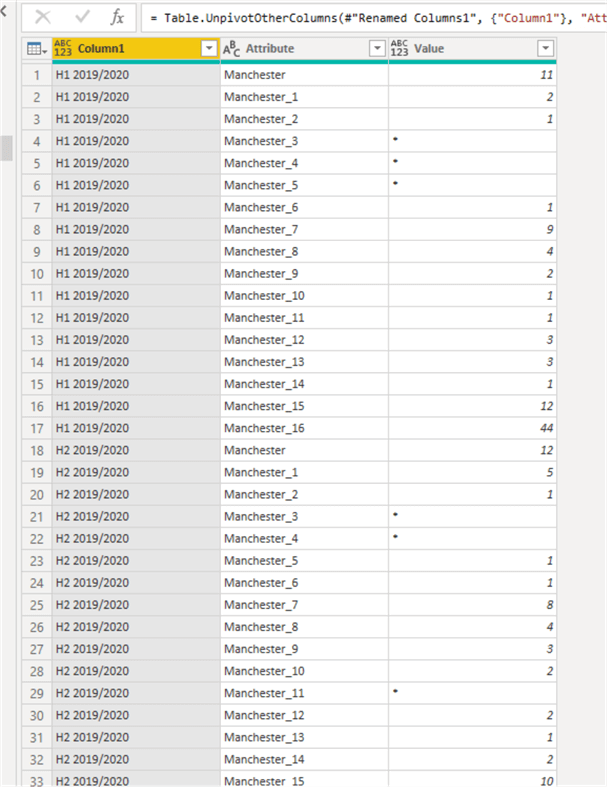
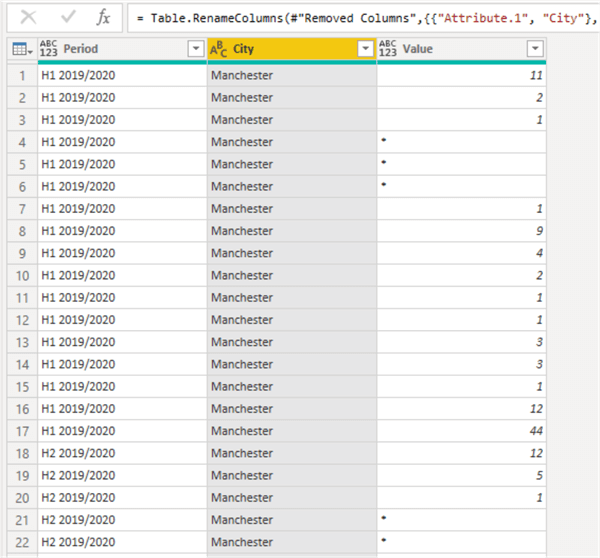
STEP 7: Cleanse the City Name Column
The column holding city names is currently having some values concatenated with underscore and a number as seen in the “Attribute” column above. We need to eliminate the underscore and number from the City Name, just leaving “Manchester” alone in this case.
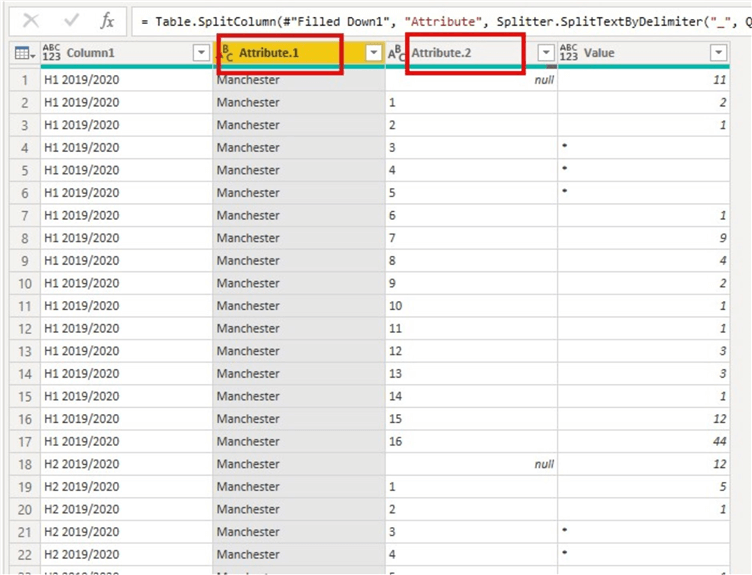
To do this, we need to click on the “Attribute” column, then on the “Home” tab click on the dropdown on “Split Column”, then select “By Delimiter” as shown in the diagram below.

Once this is done, “Attribute” column would split into two columns “Attribute.1” and “Attribute.2” as shown in the diagram below, we then need to delete “Attribute.2” as we don’t need it.
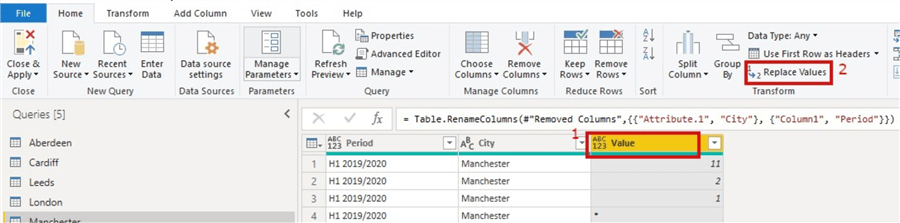
STEP 8: Rename columns appropriately
As you would observe the table has column names like “Column1” and “Attribute” which are not appropriate column names. So, we would rename “Column1” as “Period” and “Attribute.1” as “City” as shown in the diagram below.
STEP 9: Replace any special character values within the “Values” column with “0”
As can be seen in the “Values” column, we have some special characters like “*” and “- “both of which will throw errors on the cell when we try to correct the datatype of the “Values” column. To ensure this is corrected, we need to replace these special character values with a numerical value such as zero (“0”).
To do this, we click on the “Values” column, then within the “Home” tab and the transform section select “Replace Values” as seen in the diagram below.
The below dialog box will open, then just enter the values as seen in the diagram below.

Repeat same actions for replacing “- “with “0” as seen in the diagram below.

Then after these we can now change the datatypes of the columns appropriately too. The product of the first transformation is as seen below.

STEP 10: Repeat the same transformations for each of the other datasets using M Query
From here on it is that easy and simple to transform the other datasets using the M Language Query generated by the first transformation.
To find the generated M Language Query, within the “home” tab and among the Query section select “Advanced Editor” as seen in the diagram below.

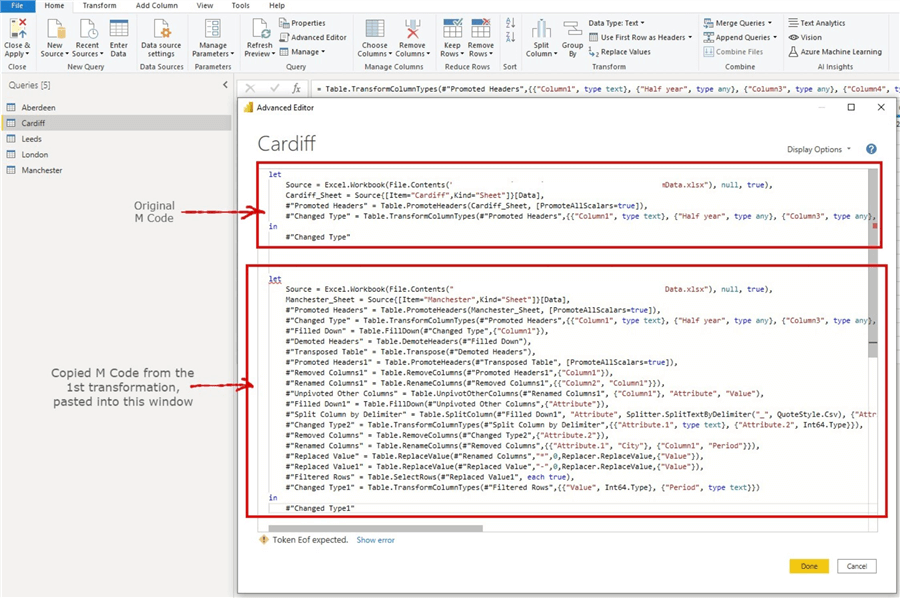
This should reveal the M Language Code generated for every step of the transformation for Manchester city dataset. Copy this query and click on the next dataset to transform. In this case, I would like to transform “Cardiff” dataset next.
Then, I would go to the “Advanced Editor” for this dataset also and below the original query for “Cardiff” I would paste the copied query from the other transformation as seen in the diagram below.
Next, let us copy the original query up to the 4th line excluding the “in #”Changed Type”” part of it.
Then, paste this copied part over the top four lines of the query at the bottom as seen in the diagram below.
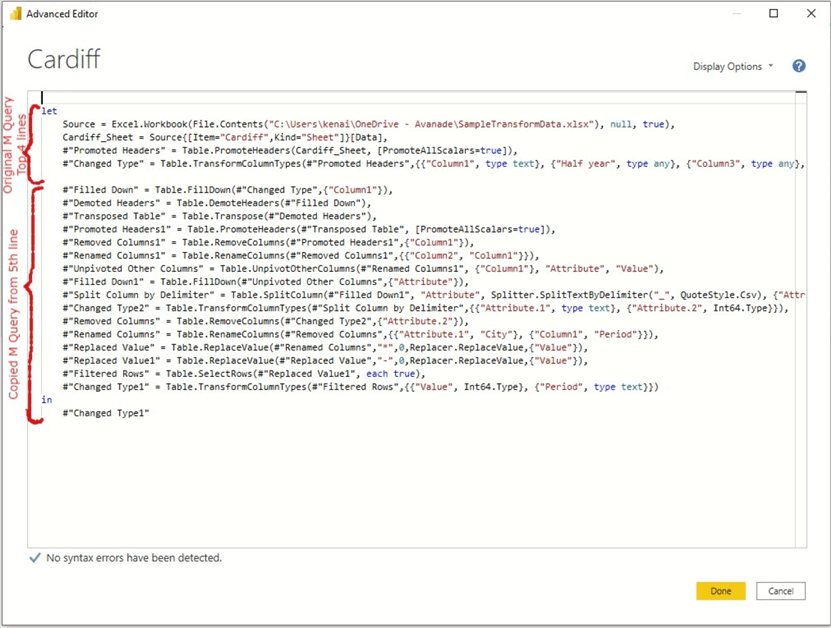
Once you click “Ok“, the magic will be done, all transformations would be applied to the “Cardiff” dataset.
Just repeat these actions for the remaining datasets and transformations would be completed in a flash.
STEP 11: Combine the tables into one main table
To combine all five tables into a single table you need to click on one of the tables, then on the “Home” tab you need to click on the drop down on the “Append Queries” and select “Append Queries as New” as shown in the diagram below.

Then, within the box that opens select “Three or more tables” as we have more than two tables to combine to transform data for the final report. Next, you need to double click on each table within the “Available tables” square to move them to the “Tables to append” square. Then when through click “Ok”.

Once you click on “Ok”, your tables would be appended into a single table. You would then need to rename this table appropriately. For this demonstration, I have left the name as “Append1”.
STEP 12: Disable table loads for other tables
After this, you can now disable load for the other tables except the new table “Append1”. To disable the tables, follow the steps below and see diagram below.
- Right click on the table to disable load on
- Select “Enable load” to disable load
- Repeat for each table
After these, only the “Append1” table would be loaded to Power BI data model as required.

In summary, in this article, we have successfully demonstrated how to transform a complicated dataset into a simple table and did this for five datasets. We later combined the tables into one using appending. We also demonstrated how to disable the load of tables we do not need in the model.
There are many different levels of complicity of datasets that can be transformed using Power Query, but understanding the steps demonstrated in this article would help you transform any dataset no matter how complicated it might be.
Next Steps
- Watch this YouTube vlog by Curbal on Transpose, Pivot and Unpivot in Power BI Desktop Pivot and Unpivot in Power BI Desktop.
- Try this tip out in your own data as business intelligence requirements dictate.
- Download the scripts and sample data for this article.

Kenneth A. Omorodion is a Microsoft Certified Solutions Associate (MCSA) with 12+ years of enterprise application experience in Power BI, DAX, Microsoft Fabric, Business Intelligence, data warehousing, SSRS, T-SQL, and Azure. Beyond his technical skills, Kenneth has expertise working with stakeholders’ and business leaders to help them better understand key insights. He has a great track record of successfully delivering full life cycle Business Intelligence and data solutions to organizations with measurable business impact.
- MSSQLTips Awards
- Achiever Award (75+ Tips) – 2025
- Author of the Year-2021
- Author Contender-2022/2023/2024


This article highlights a major point—clean and well-structured data through transformation is the backbone of any successful data-driven decision-making process.
1.How to remove duplicate data on basis of multiple criteria in power query
2. How to export large data (above 25 lakh rows) in multiple excel sheets
3. How to update month for (12 month period) 01/01/2021 to 01/02/2021 & 01/12/2020 to 01/01/2021 (for example)
Thanks for the feedback Oladotun, as you would agree with me this approach is not set on stones, there are several ways to take it further. But my approach to writting articles is to make it so easy for anyone to follow, they dont need to have excellent Data Analytics skills to understand my articles. My articles are written particularly to help the not so experienced, they can always take it further with time. Your ideas are appreciated nonetheless, thanks.
For the steps on copying and pasting the M Code, simply duplicate the query, access the table for one city, clean that up and use iy to create a function to invoke on the initial query. Much lesser steps.
Thanks Ken.
Much appreciated.
Hi Joe,
On second thought, i have now requested that the Excel source file and the Power BI pbix be attached to this article for use. Let me know if you have any further questions or challenges okay.
Cheers!
Ken.
Hey Joe,
Good to hear that this article is helping Analysts out there. Ususlly, we dont include links to pbix files in these articles. That is why i usually take the time to layout my articles in Step-By-Step formats so that everyone can easily follow.
I would say, if there is any step you are not so clear about please do let me know and i will ensure i provide more details to make it very easy to understand and implement. Thats the essence of my articles in the end.
Thanks.
Good walkthrough of the concept. But would have been helpful if you had included the original unstructured file as a download. This would have allowed viewers to follow and actually do the steps.