Problem
In this tip we’ll introduce you to Power Query, the self-service data preparation tool from the Power BI family. It’s a simple yet effective tool and it has found its way into many different products in the Microsoft Data Platform.
Solution
From the Microsoft documentation:
“Power Query is a data transformation and data preparation engine. Power Query comes with a graphical interface for getting data from sources and a Power Query Editor for applying transformations.”
In its shortest definition, Power Query is a lightweight, graphical, self-service ETL tool, where ETL stands for Extract, Transform and Load. It allows you to load data from many different sources (Excel files from Excel 2016, Excel 2010, CSV files, SQL Server, etc.), apply transformations on the data (calculations, filtering, sorting, grouping, merging and so on) using an easy graphical user interface and then load the data to a destination for data analysis. Depending in which tool you use Power Query, the destination will vary.

Example Power BI Report
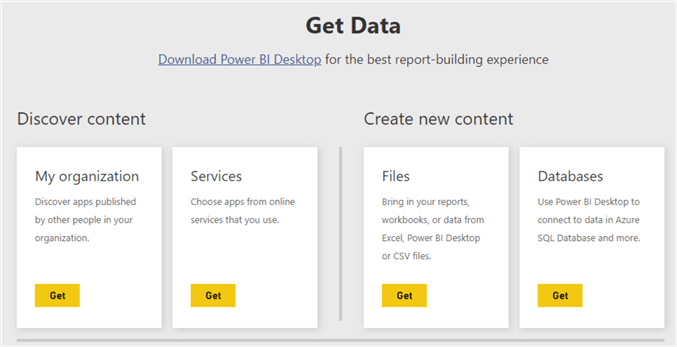
The best way to make sense of the tool is demonstrating it with an example. In this case, we’re using Power BI Desktop which can be downloaded for free. When you open up PBI Desktop, you can choose to “Get Data”.

This will lead you to a dialog where you can choose your data source from which you want to extract data. As you can see from the screenshot, there are many possible data sources.

Microsoft Excel is selected as the default, and we’re going to read from a worksheet so we can just click on the connect button. After selecting the Excel workbook from which we want to read (download the sample workbook here), we get the Navigator screen:

Power Query will detect any potential tables for you to choose from, or you can just select an entire worksheet. Once you selected one of the options presented, you can either load it directly to Power BI, or you can choose to transform the data which we’ll choose of course. This will open the actual Power Query editor:

We can already notice the following:
- The query editor has a familiar Office look ‘n feel because of the ribbon.
- In the central area we have a preview of our data. This is one of the biggest strengths of Power Query: we can see the results of the transformations immediately. And don’t worry, large datasets are sampled so not every row is loaded and displayed.
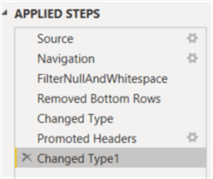
- After loading data from the Excel worksheet, Power Query has already added some transformations to clean up the data: it filtered out some white space and NULL values, it removed unnecessary rows and it set the data types for the two columns. Transformations are displayed as discrete steps. You can add transformations or remove them, as long as it doesn’t break the chain. By clicking on a previous step, you’ll see the result of that transformation in the preview pane.
- Each transformation is one line of code, which is written in the Power Query Formula Language (also known as the M language). You can see the formula for the current transformation in the formula bar. It’s possible to write your own M code – even extend it with functions and parameters – but you don’t have to. By using the graphical editor, Power Query will write the code for you.
If you cannot see the formula bar, you need to go to the View tab to enable it:

In the same tab you can also enable some lightweight data profiling/quality options:

These give the following result:

Now we’re ready to apply some transformations. First, we need to promote the first row to a header. In the Home tab, click on Use First Row as Headers:

The transformation will be added to the list:
Power Query also added an extra data type conversion step. Since the first row is now a header, maybe the data types have changed. The first “changed type” transformation has become obsolete and can be deleted. The data now looks like this:
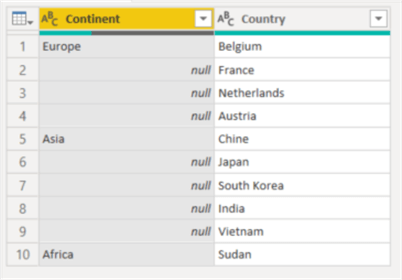
We also want to get rid of those NULL values in the continent column. In the Transform tab, select Fill and then Down.

This will automatically replace any NULL value with the previous non-NULL value:
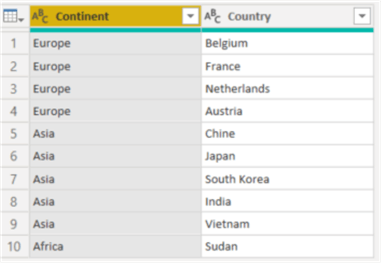
The data is now ready and can be loaded into the Power BI model by clicking Close & Apply in the Home ribbon.

In this short example we have seen how easy it is to read some data and apply transformations on it, all with just a few clicks. In a tool like Integration Services, this would have taken you considerably more time.
The Many Faces of Power Query
There are many tools where you can find some version of the query editor. To make sense of it, let’s start with a short history lesson. Somewhere in 2013, Microsoft released the Data Explorer add-in for Excel. It was free and in preview. Right from the start, you could access many different types of sources and apply transformations to the data using a friendly user interface. This add-in was part of a collection of add-ins for Excel. The others were:
- Power Pivot for Excel. This was the foundation of what will later become Analysis Services Tabular and the Power BI model. This is later rebranded as the “Excel Data Model”.
- Power View for Excel. An interactive visualization tool which was also available in SharePoint. This add-in first bought true interactivity to users of the Microsoft Business Intelligence stack, which we’re now used to thanks to Power BI.
- Power Map. A tool to plot data on a map or globe.
Later on Data Explorer was rebranded to Power Query. In later versions of Excel, it was renamed to the “Get Data” experience and in most recent versions it’s now “Get & Transform Data”.

Power Query was immediately popular due to its intuitiveness and its wide range of transformations and possible sources. Due to this popularity, other tools started implementing the Power Query engine as a method to read data.
Excel
Power Query started out in Excel and it’s still there as part of the standard offering. Take a look in the Data tab in the “Get&Transform Data” section, as mentioned in the previous paragraph. By using it, you can load data into the Excel Data Model (previously Power Pivot) or directly into an Excel worksheet. You can find an example of Power Query for Excel in the tip Introduction to Power Query for Excel.

Power BI
Power BI was the first tool to implement the Power Query engine outside of Excel. In Power BI Desktop, you can use the Power Query editor to read data from one or more sources, while the output of the queries will be written to the data model. Every query that returns data will output this into a table. A lot of documentation or examples online are created using Power Query in Power BI Desktop.
You also have a lightweight Power Query in the Power BI Service, to read data from files stored locally or in OneDrive:
In almost all cases it’s a better to idea to use Power BI Desktop to create your queries.
Integration Services
You can use a Power Query source in the data flow of an SSIS package. For the moment, there’s no visual editor like in Excel or Power BI. You have to copy paste the M code into a textbox.

Even though it’s still rough around the edges, the Power Query source can really simplify transformations which are otherwise harder to implement in SSIS. For more info, check out the tip SQL Server Integration Services Power Query Source.
Analysis Services
Since SSAS 2017, you can use the Power Query editor to create the source queries for loading data into the Tabular Model. This is referred to as the “modern get data” experience.

You can find more info in the following tips:
- How to import data for SSAS Tabular vNext
- How to manipulate data during import in SSAS Tabular vNext
Azure Data Factory
In ADF, you can create a Power Query data flow (which was previously called a “wrangling flow”). The advantage of running Power Query in ADF is that it can move and transform data at scale, since it uses the compute clusters of ADF.

You can add the Power Query data flow into regular ADF pipelines so it can be part of a bigger data pipeline architecture. Keep in mind that at the time of writing, not yet all Power Query functionality is supported in ADF. For more info, check out the tip What are Data Flows in Azure Data Factory?.
Dataflows
The problem with Power Query in certain tools is that there’s only one fixed destination. For example, in Power BI you load data into the Power BI model, in Excel you load to the Excel data model or directly to a worksheet (either way, the data stays in Excel). This means the usage of Power Query is limited to that certain tool.
To remedy this situation, dataflows were introduced (not to be mistaken with the data flows of Azure Data Factory or the data flow in SSIS). Dataflows are a product-agnostic version of Power Query running in the cloud. With dataflows, you can write data to another output such as Azure Data Lake Storage or the Dataverse.
You can create a dataflow from within Power BI inside a workspace:

After a few steps you can transform data visually just like in Power BI Desktop, but in the browser instead!

This browser experience is also referred to as “Power Query Online”. For more information about dataflows, check out the documentation.
Other
There are even more places where you can find Power Query, such as Power Automate (previously known as Flow), Dynamics 365 Customer Insights and Power Apps. For a good overview, check out the paragraph Where can you use Power Query? in the documentation.
Next Steps
You can download the sample file here.
More tips about Power Query:
- Query Folding in Power Query to Improve Performance
- Getting Started with Power BI and Power Query for Simple ETL – Part 2
- Retrieve file sizes from the file system using Power Query
- Power Query Common Data Transformations
Check out these additional tips and tutorials:
- SQL Server DAX Tutorial Overview
- Getting Started with the DAX queries for SQL Server Analysis Services
- DAX in SQL Server and How it Can Be Used

Koen Verbeeck is a seasoned business intelligence consultant with over a decade of experience with the Microsoft Data Platform. He holds several certifications, including Azure Data Engineer. He’s a prolific writer, with over 375 articles on technologies such as Microsoft Fabric, SSIS, ADF, SSAS, SSRS, MDS, Power BI, Snowflake and Azure services. He has spoken at various events such as PASS, SQLBits, dataMinds Connect and many others. He frequently delivers educational webinars on MSSQLTips.com. For his efforts, Koen has been awarded the Microsoft MVP data platform award for many years.
- MSSQLTips Awards:
- Leadership Award (200+ Tips) – 2021
- Author of the Year – 2014/2020/2022
- Author Contender – 2024/2025


Great history of where all the “Power” names came from!