By: Ray Barley
Overview
The Report Body is the section of a report that is between the Report Header and the Report Footer. It contains the report content. This topic will walk through the steps for creating the report body. We'll add a Matrix data region to the report and populate it with the data from the shared dataset that we created in the Getting Started section.
Explanation
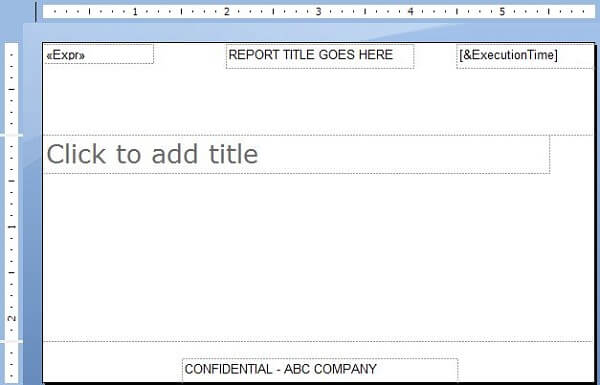
We will continue with the report that we began in this section. Our report has the header section and the footer section completed and looks like this:
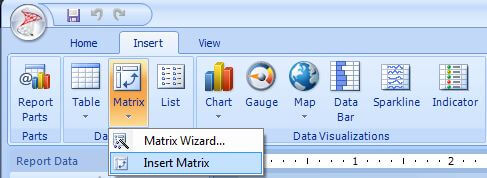
To begin click Matrix on the Insert tab of the Report Builder ribbon and click Insert Matrix on the popup menu:
Click on the report designer surface with the left mouse button and drag the mouse to create the rectangular area for the matrix. You will be prompted to select the dataset to populate the matrix; fill in the dialog as shown:
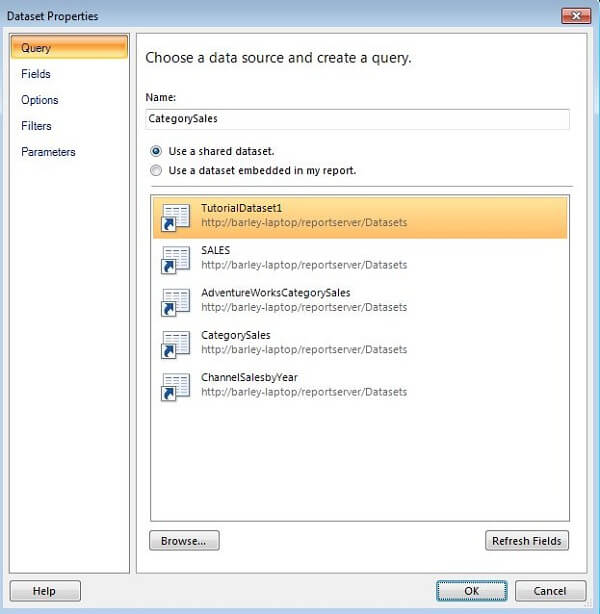
The default value or name will be something like Dataset1; it's a good idea to provide a meaningful name. I'm using the shared dataset that we created in the Getting Started section. It's definitely a best practice to create shared datasets that provide the data that you need for your reports. This allows you to simply select the one you need rather than having to specify a data source, a query to retrieve the data you need, and so on.
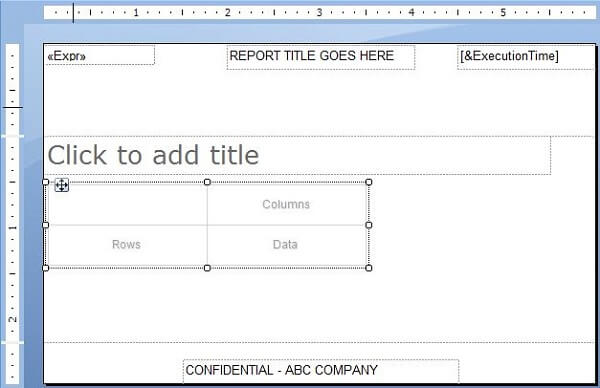
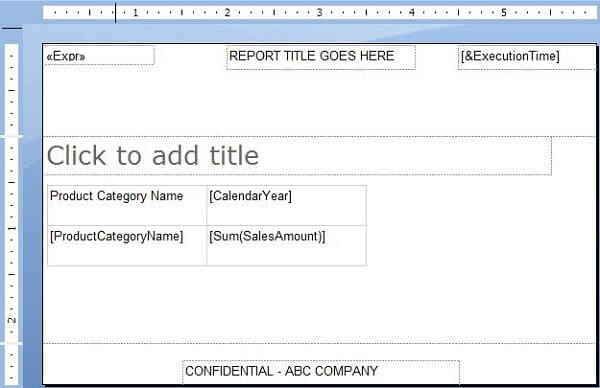
Click OK to complete the Dataset Properties and the report now looks like this:
Expand the Datasets node in the Report Data area to show the dataset and its fields:
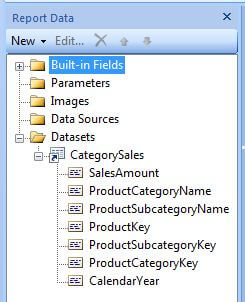
Drag fields from the CategorySales dataset and drop them onto the matrix placeholders as follows:
- ProductCategoryName -> Rows
- CalendarYear -> Columns
- SalesAmount -> Data
The report design surface now looks like this:
There are a couple of things to note at this point:
- The matrix and each of its cells all have a number of properties that you can set; as you click in a cell the Properties window will refresh to show the properties for the item you have selected and allow you to edit them
- You can right click in a cell to display a popup menu with a bunch of choices; e.g. insert column, insert row, and so on
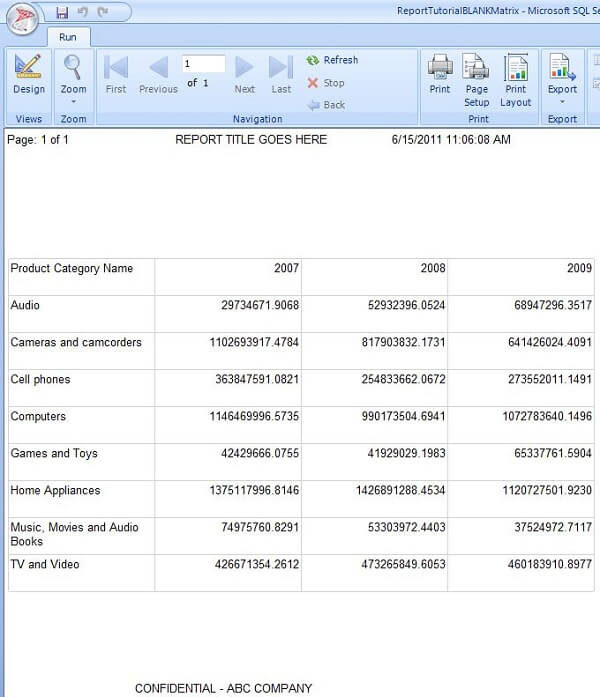
Click Run on the Home tab to preview the report:
I want to make a couple of improvements to what we have:
- Add category totals
- Add yearly totals
- Format the amounts as currency without decimal places
- Get rid of the blank space between the report header and the matrix
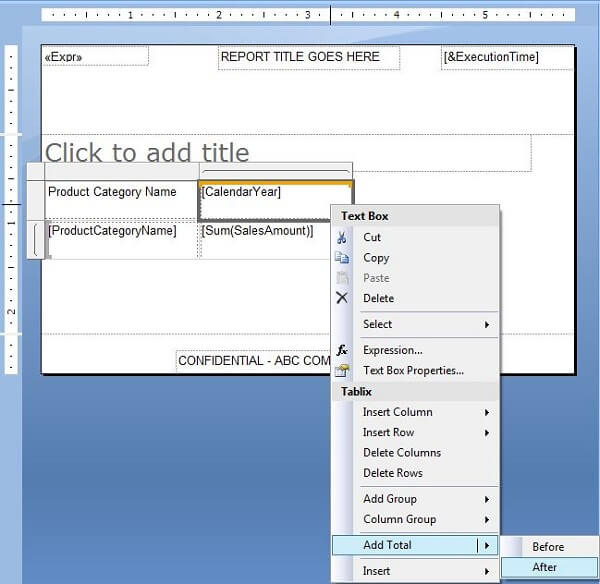
Right click in the [CalendarYear] cell then select Add Total, After from the popup menu to add the category totals:
Right click in the [Sum(SalesAmount)] cell and select Add Total, Row from the popup menu to add the yearly totals.
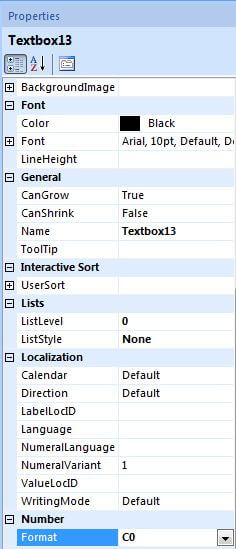
To fix the number formats, click in the cell, go to the Properties window, and set the Format property to C0 (it's in the Number group):
To get rid of the blank space at the top of the report, right click on the "Click to add title" TextBox and delete it; click the report header area and drag it up to remove the unused space.
Click Run on the Home tab to preview the report:
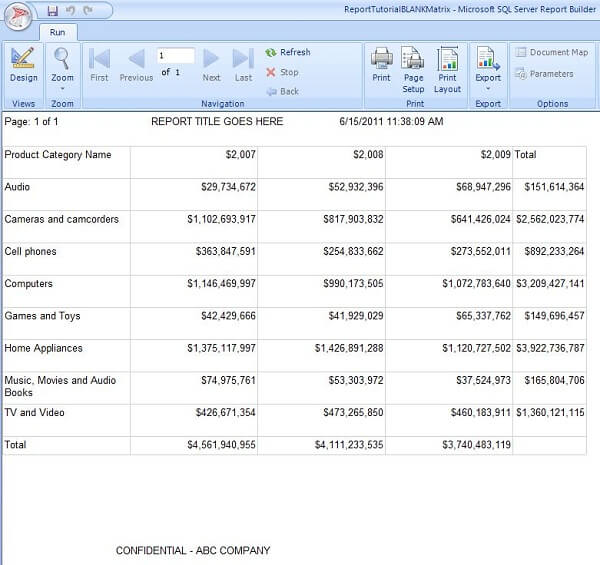
At this point we have achieved our objective of building a report from scratch. You can go back and customize the various properties to spice it up.
Additional Information
- Refer to Tutorial: Creating a Matrix Report (Report Builder 3.0) on TechNet for additional details.
