Overview
Every time a query is executed, information about its execution is logged into the metadata layer of Snowflake. In this section, we learn how to get Snowflake query history data.
Explanation
You can query this data, either through a query – if you have the appropriate permissions – or through the user interface.
History in the User Interface
When you’ve executed at least one query in a worksheet, you can click on the clock icon on the right-side of the window.
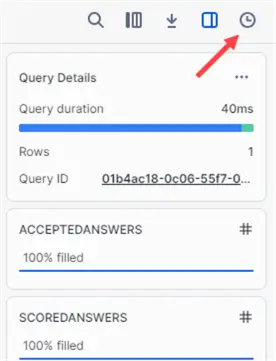
This will open a new pane, where you can view the history of the queries you executed in the worksheet.
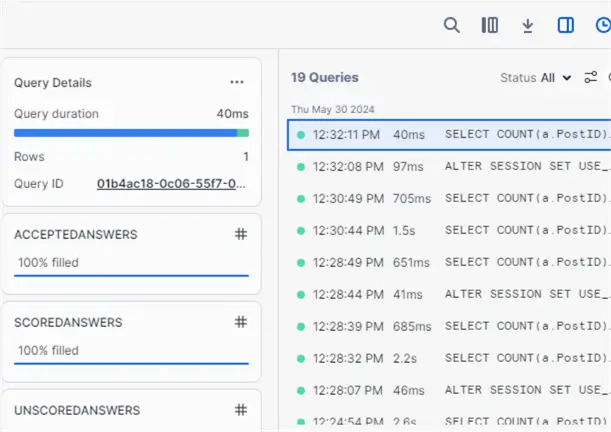
You get the timestamp, the duration and the SQL query text of the statements you executed. At the top of the pane, there are some options to filter the list. In the Query Details pane, you can find the query ID. When you click on this ID, it will take you to a new window with more detailed information of the query. It’s important to notice this also possible for queries that are still executing.

If the query has finished successfully and a result set is returned, you can view it in the results pane.

Query Execution Plan
Ideal during debugging and you are wondering what your previous query returned before you made that change. If you click on Profile at the top, you are taken to the query execution plan. Here’s the query plan of the query we executed in the previous section of the tutorial:

If you click on one of the nodes, you get a bit more detail.

Unfortunately, the query plan is nowhere as detailed as in SQL Server.
If you’re interested in more than your own queries, you can go to the query history pane in the browser.
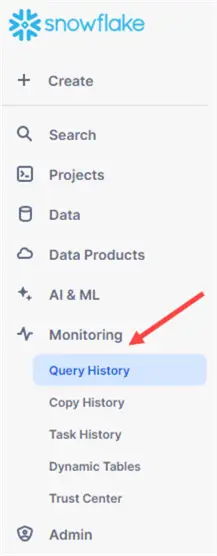
There you can view all queries executed in the Snowflake account, up to a certain period in time.
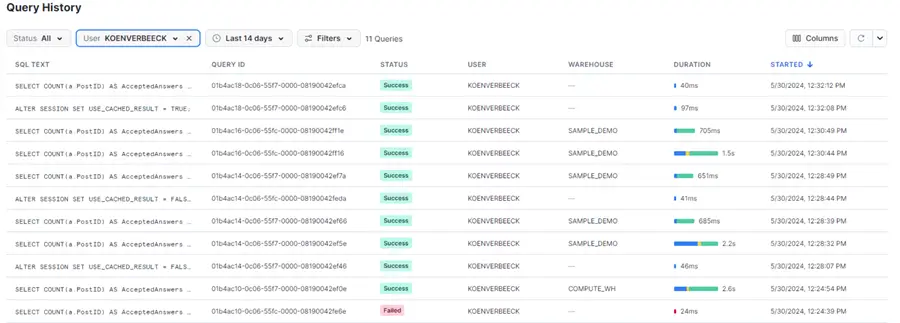
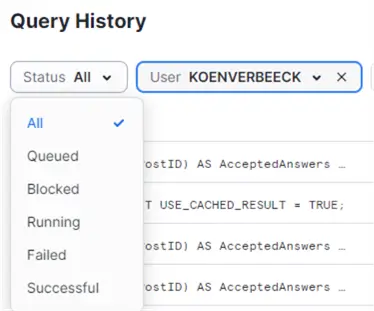
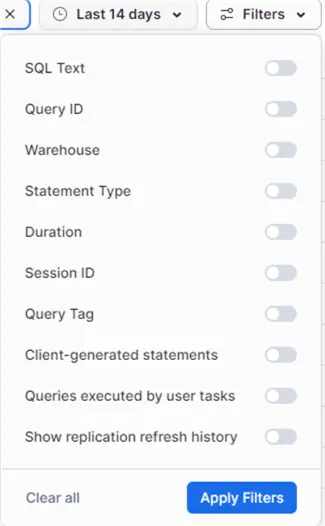
There are filters available for searching through the available Snowflake query history.
If you go to the query history detail of a query executed by another user, you cannot see the result set. This would otherwise be a serious security risk. You can however see the actual SQL statement that was executed.
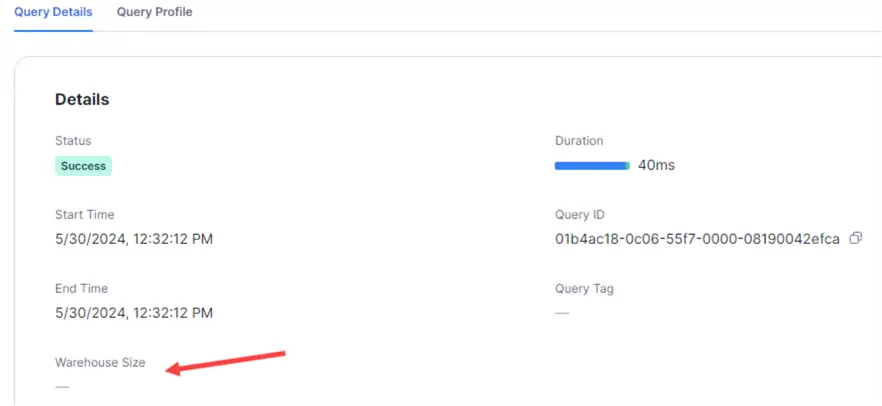
Query Result Cache
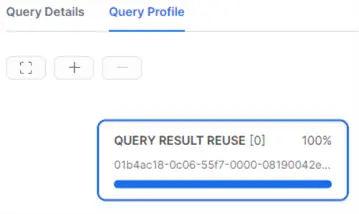
An interesting feature of Snowflake is the result set cache. This means if an executed query is unchanged and the underlying tables aren’t modified, each subsequent execution of the same query will just pull the result set from cache. This is ideal for speeding up reports that execute the same queries repeatedly. How can you check if a query has retrieved the results from cache? If you go to the query history detail, you’ll see there’s no warehouse size displayed, meaning the query was essentially free.
You can also check the query profile:
Querying History
If you want more flexibility than the browser, or go further back in time, you can query the metadata database for the query history. If you have the correct permissions of course (by default ACCOUNTADMIN is needed). An example query can be the following:
SELECT *
FROM "SNOWFLAKE"."ACCOUNT_USAGE"."QUERY_HISTORY"
WHERE 1 = 1
    AND start_time >= '2024-01-01'
    AND database_name = 'TEST'
    AND USER_NAME = 'KOEN'
    AND EXECUTION_STATUS <> 'SUCCESS'
ORDER BY start_time DESC;
Additional Information
- More information about the ACCOUNT_USAGE schema in the Snowflake database. You can query all sorts of information. You can for example create a report on the longest running query and how much compute was used (and thus how much money those queries costed).

Koen Verbeeck is a seasoned business intelligence consultant with over a decade of experience with the Microsoft Data Platform. He holds several certifications, including Azure Data Engineer. He’s a prolific writer, with over 375 articles on technologies such as Microsoft Fabric, SSIS, ADF, SSAS, SSRS, MDS, Power BI, Snowflake and Azure services. He has spoken at various events such as PASS, SQLBits, dataMinds Connect and many others. He frequently delivers educational webinars on MSSQLTips.com. For his efforts, Koen has been awarded the Microsoft MVP data platform award for many years.
- MSSQLTips Awards:
- Leadership Award (200+ Tips) – 2021
- Author of the Year – 2014/2020/2022
- Author Contender – 2024/2025