Problem
Imagine you are executing a query and after a while, you monitor it and notice that it does not progress. It finally exceeds the execution time limit and encounters a timeout error. In this article, I will walk through why this problem can occur, explain a scenario that I faced in production, and provide a solution to resolve it.
Solution
Key Takeaways
- SQL queries can fail to start due to issues like blocking, waiting for threads, or waiting for memory.
- The RESOURCE_SEMAPHORE wait type indicates that queries are waiting for memory, especially under concurrent load.
- To reduce memory grants, consider options like using OPTION (MAXDOP 1) or modifying indexing.
- Removing the ORDER BY clause can also help decrease memory usage while executing SQL queries.
- Always analyze wait statistics to identify high wait types like RESOURCE_SEMAPHORE and optimize your SQL queries accordingly.
There are several reasons why a query does not actually start executing, like:
- Blocking issue: Imagine you are trying to read a row that someone else is updating at the same time. Under the “read committed” isolation level, the select query will be blocked until the update statement is committed or rolled back. In fact, the execution of the select query has not yet begun.
- Waiting for a worker thread: This issue occurs when SQL Server is overloaded and lacks threads for all requests.
- Waiting for an available memory grant to execute.
In this tip, my focus is on situations where a query is waiting for memory to start execution. An important question arises at this point. How can we determine if a query is waiting for memory? When memory is not available for a query to start running, a RESOURCE_SEMAPHORE wait occurs. To learn more about this type of wait, view RESOURCE_SEMAPHORE.
A query may run fast when a single user executes it, however, it can slow down or even fail for some users when multiple sessions execute it simultaneously. This is exactly the same problem that frequently appears on servers under heavy concurrent load.
Set Up Test Environment
I will use the StackOverflow database for our examples. StackOverflow database is an open-source database from StackOverflow.com. I restored it on SQL Server 2022 and set its compatibility level to 160.
Use master
GO
Alter Database StackOverflow Set Compatibility_Level = 160
GO
The StackOverflow database has a table for storing user information, with a clustered primary key on the Id column. I create a non-clustered index on the Location column for demo purposes.
Use StackOverflow
GO
Create Index IX_Location On dbo.Users (Location)
With (Data_Compression = Page)
GO
Query Run and Execution Plan
To view the actual execution plan, I press Ctrl + M in SSMS and then execute the following query. The query returns information about users who live in Germany and then sorts them by reputation in descending order.
Select * From dbo.Users Where Location = N'Germany'
Order By Reputation Desc
GO
The following image shows the query execution plan.

SQL Server performed a non-clustered index seek followed by a key lookup to retrieve the results.
If I hover the mouse over the SELECT operator in the query plan, the tooltip appears, and we can see that the Memory Grant is 74 MB.

If I right-click the non-clustered index seek operator and choose Properties, a window opens where we can see that SQL Server used only one CPU core to execute the query, as shown in the Actual Number of Rows for All Executions section.

As shown in the following image the granted memory is 74 MB, however, only 7 MB is actually used.
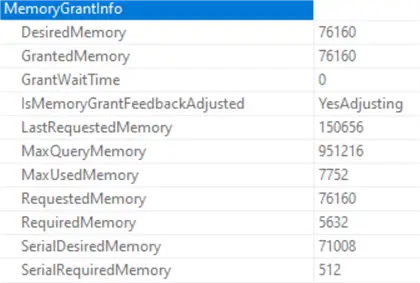
SQL Server executed the query using one CPU core and 72 MB of memory. The problem I’m facing is a high memory grant, and I am trying to reduce it. To deal with this problem I consider four possible solutions and two of them are practical in our example:
- Using Option (Maxdop 1)
- Changing Cost Threshold for Parallelism
- Rewriting the query
- Indexing
SQL Server engaged 8 CPU cores to execute the query, however, only one CPU core processed the rows. It actually did not execute the query in parallel; it ran the query in serial execution mode with a large memory grant. Generally speaking, when SQL Server uses more CPU cores, the memory grant increases.
Using MAXDOP hint
Therefore, if I run the query with the OPTION (MAXDOP 1) hint, the memory grant decreases.
Select * From dbo.Users Where Location = N'Germany'
Order By Reputation Desc Option (Maxdop 1)
GO
The image shows that the granted memory has been reduced to 9 MB.
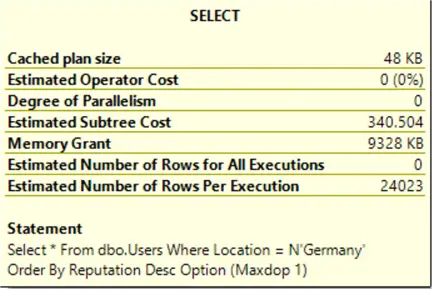
I avoid query hints unless necessary, which is rare. So, I want to explain another solution.
You can see in the image that the Estimated Subtree Cost is 340. Setting the Cost Threshold for Parallelism to 350 causes SQL Server not to use 8 CPU cores and reduces the memory grant, but it is not advisable.
RESOURCE_SEMAPHORE Waits
As I mentioned earlier in this article, the high memory grant for a query leads to concurrency issues. When a query uses a high amount of memory and concurrency is high on the server, memory for executing other queries is not available and the RESOURCE_SEMAPHORE wait increases. Let’s show it to you.
To illustrate the problem, I use the SQL Query Stress tool.
I first clear the wait statistics:
DBCC SQLPERF ('sys.dm_os_wait_stats', CLEAR);
GO
Then I run the query 100 times concurrently and repeat this process ten times.
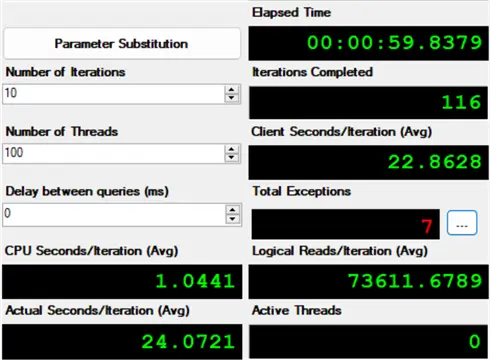
To find the top wait types on the server, I use this query. You can see in the following image that the highest wait type on the server is RESOURCE_SEMAPHORE. The average wait time for RESOURCE_SEMAPHORE is significantly different from the other waits.

What is the solution?
So, I want to rewrite the query to reduce the memory grant.
Remove Order By
Simply, we can remove the ORDER BY clause from the query and check the memory grant after executing it.
Select * From dbo.Users Where Location = N'Germany'
GO
If I hover my mouse over the SELECT operator in the execution plan, a tooltip appears, but it does not show the memory grant because the memory SQL Server used to execute the query is very low.
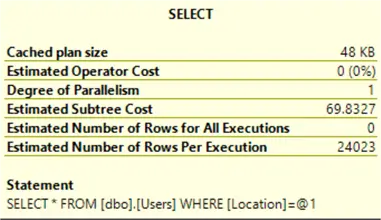
So, one option would be to not use an ORDER BY in your query unless it’s really necessary. If you can sort the query results on the application side, do so. There’s no need to sort the data when your database is providing it to web services, except in rare cases.
Despite the explanations provided, I suppose that we cannot remove the ORDER BY clause from the query.
Indexing Changes
In the example that I’m explaining, the solution is indexing. We have already created a nonclustered index on the Users table. I will change it and add the Reputation column to the index key.
Create Index IX_Location On dbo.Users (Location, Reputation)With (Data_Compression = Page, Drop_Existing = On)
GO
After modifying the index, I run the original query again.
Select * From dbo.Users Where Location = N'Germany'
Order By Reputation Desc
GO
The image below shows that the Sort operator has been removed from the query plan, and SQL Server has executed the query using only one CPU core, as there is no parallelism icon in the execution plan.

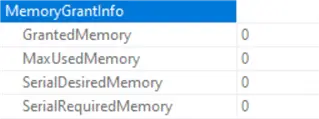
The following image shows the memory grant info, which is very, very low:
To repeat the concurrent test, I clear the wait statistics and run the query using SQL Query Stress, again.
DBCC SQLPERF ('sys.dm_os_wait_stats', CLEAR);
GO
After completing the test, I would like to review the server’s wait statistics. The latest image shows that there is only one wait on the server that called ASYNC_NETWORK_IO.

The query ran multiple times concurrently without waiting for memory, since there is no RESOURCE_SEMAPHORE wait on the server.
Summary
The phrase “a query fails to start” means that it has not yet begun execution. Queries may fail to start due to various reasons, such as blocking. One of the primary reasons is waiting, like when the query is waiting for memory to begin execution. When RESOURCE_SEMAPHORE is one of the highest wait types on your server, search for queries with large memory grants and try to reduce the memory grant for each query as much as possible.
Next Steps
Check out these related tips:
- SQL Server 2019 Memory Grant Feedback Example and Data Collection
- SQL Query Stress Tool
- Troubleshooting SQL Server RESOURCE_SEMAPHORE Waittype Memory Issues
- Parallelism in SQL Server Execution Plan

Mehdi Ghapanvari is an SQL Server database administrator with 6+ years of experience. His main area of expertise is improving database performance. He is skilled at managing high-performance servers that can handle several terabytes of data and hundreds of queries per second, ensuring their availability and reliability. To enhance the performance of the database, he has implemented various performance-tuning techniques, including query optimization and index tuning. He has also developed backup and recovery strategies to protect critical data in case of disasters. Mehdi currently manages the SQL Server databases for a large organization. Mehdi is actively seeking new opportunities to apply his expertise and contribute to impactful projects. You can reach him at SQLDBA.Mehdi@Gmail.com.
- MSSQLTips Awards: Rookie of the Year – 2023
- MSSQLTips Trendsetter Award: 2026


Thanks!
Nice article!