Problem
Traditional BI platforms like Power BI, Tableau and SQL Server Reporting Services were optimized for a reporting use case through dashboards and canned reports. There are three main challenges with this approach:
- Data has to be tabular to be consumed by the reporting engines and ad hoc queries
- Specialized data practitioners are needed with data and business intelligence expertise to create, maintain and govern the environments
- The reports and dashboards were static and were not meant for deep dive analysis which needed a separate application
Solution
With the advent of Large Language Models (LLMs), the data doesn’t need to be confined to tabular models/traditional data warehouses. LLMs support structured, semi-structured, unstructured documents, email, meeting notes and real time stream events. The rise and integration of AI tools in the Business Intelligence space have built a path to conversational agents where business questions can be answered without switching tools. In this solution, we are going to see a newly launched AI+BI platform Amazon Quick Suite and walk you through the core components of the platform.
Key Takeaways
- Traditional Business Intelligence platforms face challenges with tabular data requirements and static reports that limit deep analysis.
- Amazon Quick Suite leverages Large Language Models to enable conversational interactions with data and supports various data formats.
- The suite includes features like Amazon QuickSight for dashboards, My Assistant for conversational queries, and Flows for automating repetitive tasks.
- Spaces store documents to provide context for AI agents, while Research helps conduct complex investigations efficiently.
- Overall, Amazon Quick Suite combines BI with AI capabilities, transforming the user experience in data analysis.
Amazon Quick Suite
Amazon Quick is a comprehensive, generative AI-powered Business Intelligence (BI) platform that makes it easy to analyze data, create visualizations, automate workflows, and collaborate across your organization. The service combines traditional business intelligence capabilities with modern Artificial Intelligence (AI) assistance, requiring no machine learning expertise. You can connect to diverse data sources, create interactive dashboards, build intelligent automations, and get immediate insights through natural language conversations with AI agents.
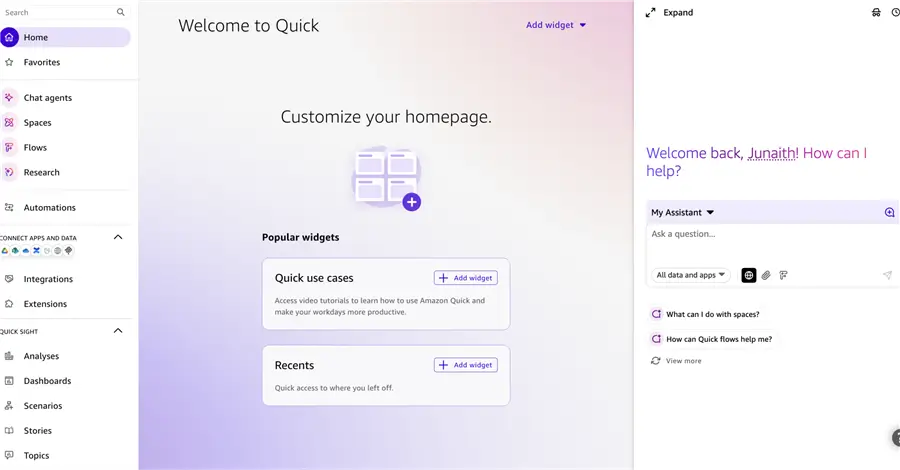
Amazon Quick Suite includes five integrated features:
- Amazon QuickSight: The dashboard component supported with a super-fast in-memory parallel engine SPICE to support heavy workloads, analysis and reports.
- My Assistant: The conversational AI based chat agents that can interact with dashboards, knowledge bases and company SOP’s. This agent can execute actions and answer complex questions.
- Spaces: The storage repository where you can essentially group different types of data sources from documents (Excel, PowerPoint, PDF, CSV etc.), dashboards, datasets and can be used as knowledge base to give context to the AI agents.
- Flow: Flow is the user defined automation component to perform repetitive tasks. It helps connect different applications eliminating the manual user workloads and automates the repetitive tasks between different applications like QuickSight, Outlook, Slack, etc.
- Research: It’s a specialized agent built for complex, multi-source research tasks. When we invoke this agent with a proper prompt it performs deep research and generates a structured research plan by conducting a comprehensive assessment with external sources.
For this article, Let’s use the sample Web and Social analytics dataset provided by Amazon Quick Suite and demonstrate how different components of Quick Suite can be integrated within a Marketing team.
Amazon QuickSight
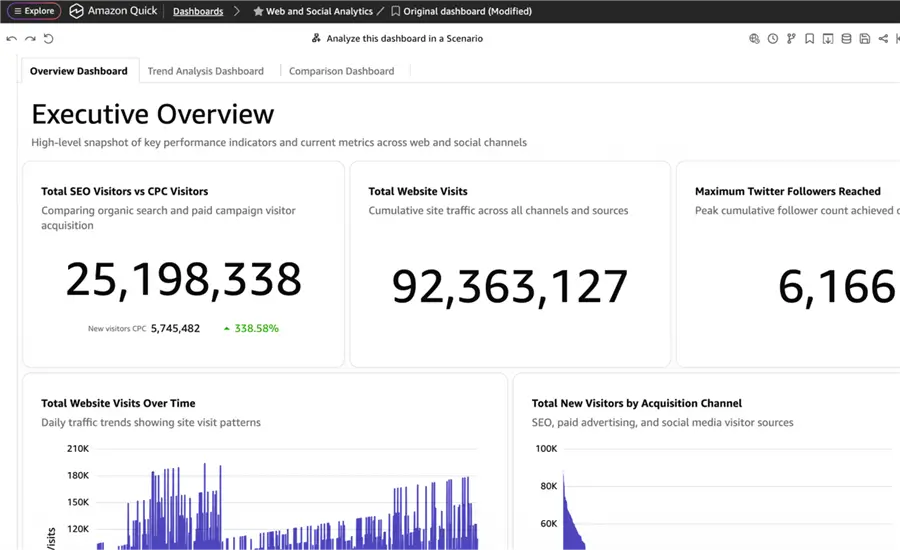
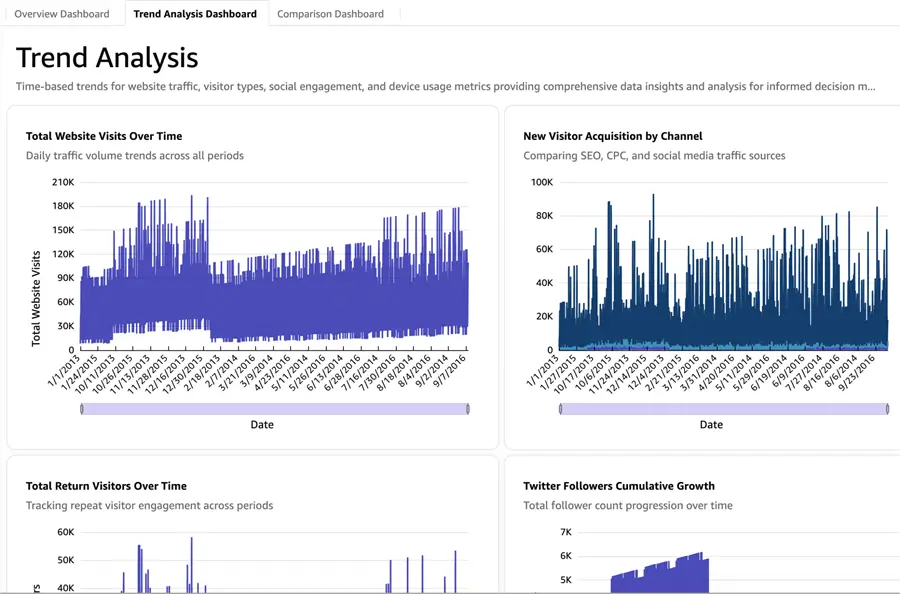
Log on to the Amazon QuickSight service in the AWS Console, Choose the data from the dataset menu and add the unzipped CSV format as the dataset. Upload the file and go to the visualize option to create the analysis and dashboard. I have created the following dashboard with Overview, Trend Analysis and Comparison sections. You can also follow this documentation to create the dashboard and analysis of your choice. We have created a dashboard to be used by the Marketing team to measure the web analytics data from the website and social media sites.
My Assistant
Now, log on to the console and choose the Quick Suite Service. On the top right section of the screen there will be a chat icon for My Assistant. Or you may see it on the right side of the page. Open the My Assistant AI Agent. Let’s say the Marketing Specialist has a request to analyze Twitter engagement rate in the dashboards. Rather than going to the dashboard lets us the My Assistant agent to start our natural language conversations with the dashboard.
Go the Assistant and type: “Can you look at the Twitter Engagement rate in the Web and Social Analytics dashboard?”
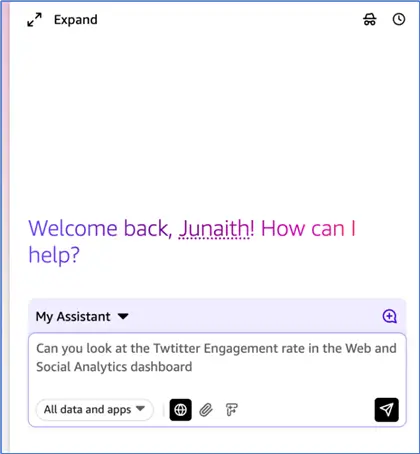
It thinks for few seconds, connects to the dashboard and analyzes the Twitter Engagement data from the dashboard and displays notable trends and a summary.

Let’s say you want to deep dive and understand which days of the week the users are more active in Twitter. Go ahead and ask the question in My Assistant – “Which days of the week we have most engagement in Twitter?”. It performs the analysis and shows the Sunday has the most engagement time which is good for the company to conduct promotions in Twitter audiences on Sunday.

It also goes a step above and generates a chart and key takeaways summary for our question as shown below.

This deep dive research on Twitter engagement with key takeaways might take hours for the Marketing Analyst provided the data is in the dashboard. If it’s not there, they have to go to multiple applications to pull the data and summarize their findings. But the AI driven My Assistant completed the task in minutes saving hours of development time.
Spaces
Spaces are the knowledge layer that will allow the AI agent to reason over the context through structured and un-structured documents. With Spaces you can hold up to 100 files and it serves as the primary unit of knowledge base for the AI agents. Let’s go the Spaces section and upload the Marketing SEO SOP.


Now, if we go to the My Assistant and ask a question related to the SOP – “Who approves the Marketing Budget”. It answers by using the Marketing SEO SOP we have uploaded. This makes the contextual reasoning easier and Spaces becomes the centralized storage for organization related artifacts for process and documentation.

Flows
Flows is the automation utility for repetitive tasks that connects to varied applications that Quick Suite supports. You can access Flows directly from the user interface and its accessible for non-technical users. Let’s combine our learning from My Assistant and Spaces section. Let’s say the Marketing Specialist has to review the report every Monday. When the Twitter engagement is above a certain threshold, has to send the summary of her findings to the Marketing Manager who conducts promotional campaigns on Twitter. This will mean that the Marketing Specialist has to review the report every week, find the most engaged days (could be seasonal) and summarize the findings to be sent to the Director. These kinds of repetitive tasks can be automate using Flows.
Go to the Flow section and add a prompt to create a flow to review the dashboard for the KPI. Then analyze which campaign is effective and send a concise email to the Marketing Manager in the Flow tab.

It will ask to configure the email and Slack channels. Then sends the report summary as scheduled.

Research
Quick Research is a specialized agent built for complex, multi-source research tasks that requires more than a single query response. It analyzes the research goal and generates the structured plan, confirms the plan with the user before proceeding and generates a comprehensive multi step investigation across web spaces, uploaded files and QuickSight dashboards. The research task typically takes about 15 – 30 minutes to complete and can be used to conduct market analysis, financial analysis of the organization compared with world situations and assimilate the data into a report.

Summary
In summary, we demonstrated an agentic tool that moves from dashboard centric system to a dialogue centric interaction model. We learned about the suite of tools available in the Quick Suite platform and demonstrated a real-world application of these tools. In the future articles we will deep dive into creating custom agents and integration flexibility that Quick Suite offers.
The launch of Quick Suite could strike a confusion among engineers with branding and here are some FAQ’s:
- What’s difference between Quick Suite and QuickSight?
- Quick Suite is the superset of QuickSight with automation, AI Agent and deep research functionality. Quick Suite represents the evolution of BI tools with integration of Generative AI, Automation and transforms the experience
- What are the competitive products for Quick Suite?
Microsoft Fabric is a competitive product, like how it evolved from Powerview, Power BI, Power Query to an AI driven intelligent platform Quick Suite is the equivalent offering from AWS.
Next Steps
- If you’re organization is using AWS services, explore how you can implement the Quick Suite to move the traditional BI to AI driven conversational model.

Junaith Haja is a senior data engineering leader with over a decade of experience transforming raw data into scalable platforms and actionable insights that drive business performance, operational excellence, and sustainability. At Amazon, he applies a “data as a product” philosophy to architect resilient data infrastructures supporting global domains such as identity verification and financial risk mitigation.
Beyond engineering execution, Junaith is an active voice in the global data and AI ecosystem. He has authored over 100+ articles in major database and AI platforms including MSSQLTips.com, AITimeJournal, AI Frontier Network, DZone. He writes a weekly LinkedIn newsletter, Signal Over Noise and his personal blog juniathhaja.com where he shares insights on data engineering, AI and leadership. He serves as a Senior Member of IEEE, a Fellow at the Institute of Analytics, and a Distinguished Fellow at the Soft Computing Research Society, reinforcing his commitment to responsible, sustainable, and impactful data practices.