By: Aaron Bertrand | Comments (2) | Related: > Performance Tuning
Problem
Anyone responsible for performance tuning or troubleshooting should be familiar with the graphical execution plan feature of SQL Server Management Studio. This allows you to visually display the execution plan for a particular query (or multiple plans in a batch). There are weaknesses in this feature, however. For example, the display is quite monochrome, where all operator node icons essentially look alike - making it difficult to quickly spot the most expensive node, or the most expensive subtree. It is also limited to showing overall costs by combining CPU and I/O, affecting your ability to isolate high-cost bottlenecks limited to one metric or the other. Data movement between nodes is represented in such a way that a thicker arrow means more rows, but as we all know, row count is not necessarily representative of data size. And finally, larger plans can be very difficult to consume visually, since Management Studio does not use an optimal algorithm to try to display as much as possible on the screen.
Solution
Earlier this year, SQL Sentry [full disclosure: my current employer] announced a free tool for the SQL Server community called Plan Explorer. While I may seem biased, Plan Explorer is a no-risk, no-strings-attached alternative to the graphical plans we've been saddled with for the last decade. Let's show a few ways that Plan Explorer overcomes the limitations found in Management Studio's showplan today. We'll use a very simple query that isn't very interesting from a troubleshooting standpoint, but allows us to scratch the surface of how Plan Explorer can help with more complex query plans:
Quickly spot expensive nodes
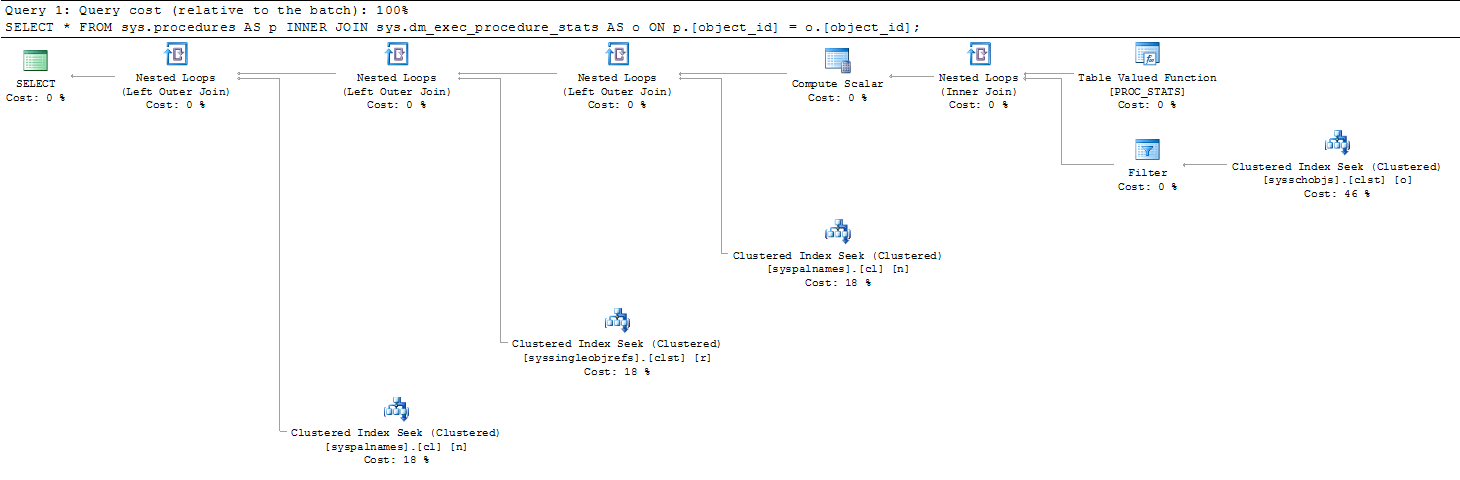
In Management Studio, the most expensive node can be difficult to spot, especially on more complex plans where you have to zoom out or scroll a lot to see the entire plan:
In Plan Explorer, a color coding scale shows high cost operators in red, mid-range in orange, and low-range in yellow. This allows you to very rapidly see the most expensive operators:
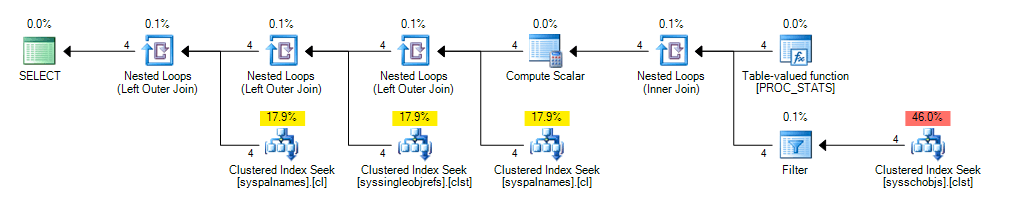
This also demonstrates how the layout is optimized in Plan Explorer, allowing you to see more operators given the same screen real estate. In particular, notice the wasted space in SSMS when looking at the three clustered index seeks on the bottom row.
Quickly spot expensive subtrees
In the above query plan, you can see that the most expensive operator is the clustered index seek at the bottom right. But the most expensive operator is not always going to reside within the most expensive subtree. In Plan Explorer, you can right-click anywhere in the plan and, from the context menu, select "Cumulative Costs" and the color range will shift to blues. Again, this provides a very clear visual indication of where the costs are being allocated: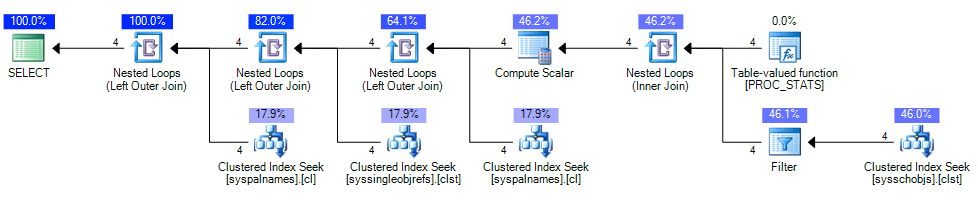
Sort operators by many metrics
If you switch to the "Top Operations" tab, you will see that you can sort the operators by a variety of metrics, including execution count, overall cost, row count, data size, CPU cost, and I/O cost. So even when the color coding on the graphical plan isn't enough, or when there are a lot of relative ties, you can quickly rank by any of these metrics. 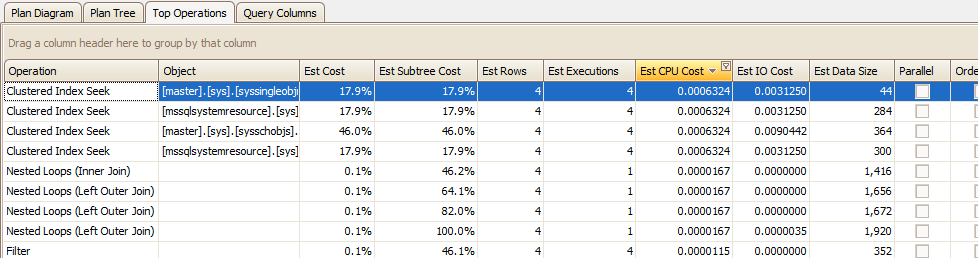
Find operators by I/O or CPU cost
If you go back to the "Plan Diagram" tab, you can right-click the diagram and change back to "Per Node Costs"... then right-click again, and choose "Costs By > CPU." In Management Studio, your only option is to see the cost percentages for operators based on overall CPU + I/O cost. Here, you can use either or both. For this particular plan, the CPU cost is much more evenly distributed than the overall CPU + I/O cost: 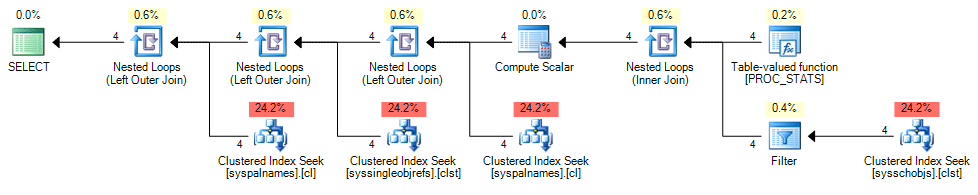
Show data movement by size rather than row count
You can also change the line widths to be representative of row counts (the default in SSMS) or by data size (no equivalent in SSMS). This will help point out when you have 10 rows of XML data representing 20 GB, vs. 2 million rows of data representing 20 MB. In Management Studio, the latter will look a lot worse from an I/O perspective. You can simply right-click any plan and choose "Line Widths By > Data Size (MB)" and the plan will be updated: 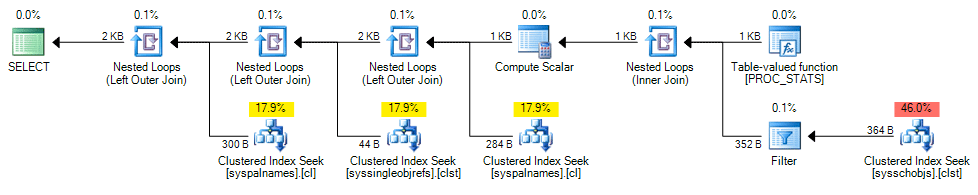
Also note that the data size or row count is displayed above or below the arrows between each operator. This is a handy addition to the visual cue that thicker = greater I/O, which is the only indicator in Management Studio.
Conclusion
There are many other features that could be explained here, but this is meant more as a teaser to get you to go out and try it for yourself. The most compelling benefit is that it is free, so there is no concern that you will start loving the feature set, and then suddenly have to pay to continue using it. Like several other free tools on the market, the saying, "you get what you pay for," is not always true. Please let me know at aaron.bertrand AT gmail DOT com if you would like to see more tips on using Plan Explorer.
Next Steps
- Download SQL Sentry's free Plan Explorer from http://sqlsentry.net/plan-explorer/.
- Download Grant Fritchey's eBook on SQL Server Execution Plans from http://www.red-gate.com/our-company/about/book-store/sql-server-execution-plans.
- Browse the following tips:


About the author
 Aaron Bertrand (@AaronBertrand) is a passionate technologist with industry experience dating back to Classic ASP and SQL Server 6.5. He is editor-in-chief of the performance-related blog, SQLPerformance.com, and also blogs at sqlblog.org.
This author pledges the content of this article is based on professional experience and not AI generated.
View all my tips
