Problem
Typically transactional data is quite detailed and analyzing an entire dataset on a graph is not feasible. Generally such data is analyzed using some form of aggregation or frequency distribution. One of the specialized charts generally used in Reporting Services for statistical distribution is Histogram Charts. In this tip we look at how Histogram Charts can be used for statistical distribution analysis and how to create and configure this type of chart in SSRS.
Solution
In this tip we will create a histogram chart in SSRS to show how to aggregate data will very little effort.
Step 1
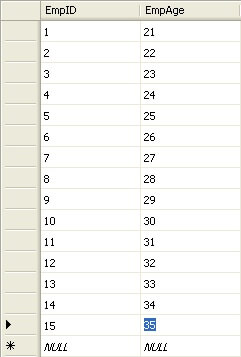
Let’s create a sample table called Employee that has columns EmpID and EmpAge with the data as shown in the below screenshot.
Step 2
Create a new SSRS report and configure it to use the data from the table we just created. Add a bar chart to the report and configure it as shown in the below screenshot.

Step 3
Execute/Preview this report and your report should look like the below screenshot and you will see data listed for all fifteen employees.
In reality, an employee table can contain records for hundreds to thousands of employees and therefore if the requirement is to analyze age distribution this type of report won’t serve the purpose. A typical approach to solve this issue would be to retrieve the count of employees falling into a few predefined age categories and show it in a distribution chart like a pie-chart. In the next few steps we will see how a histogram chart can be a much simpler approach.

Step 4
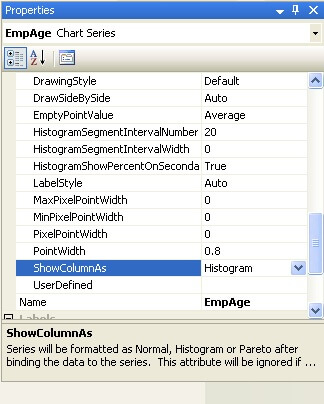
Select the EmpAge chart series and open the properties window. In the CustomAttribute category, select “ShowColumnAs” property and set the value as “Histogram” as shown in the below screenshot.
Step 5
Execute the report and you should find results similar to the below screenshot. This is a histogram chart, but the problem with this chart is that by default the chart has selected all fifteen distributions, so you get one employee for each age category which is not very helpful.

Step 6
Let’s say we want to see the data in three age groups 20 – 25, 25 – 30 and 30 – 35 and the number of employees in each age group. In the CustomAttribute category, you will find a property “HistogramSegmentIntervalWidth” and the default value is zero. Change this value to “5”, so that the age group we have is divided into 3 categories as desired. Execute the report and the report should look like the below screenshot. This chart shows 4 employees in the 20 – 25 group, 5 employees in the 25 – 30 group and 6 employees in the 30 – 35 group.

Also note that the “Percentage of Total” axis is generated and calculated automatically without any programming efforts and this axis is very useful in statistical analysis. This type of axis is not possible out-of-box in charts like pie-charts and hence charts such as histogram charts are preferred.
Next Steps
- Check out other properties associated with Histogram Charts.
- Experiment with other charts that can be used for statistical distribution analysis.
- Review these other SSRS development tips

Siddharth has more than 14 years of experience in the IT Industry, with more than a decade of experience in Business Intelligence and Analytics, for clients banking, logistics, government, Media Entertainment, products, life sciences and other domains. He has been a lead architect for a portfolio of 40+ apps, containing apps in web, mobile, BI, Analytics, data warehousing, reporting, collaboration, CMS, NoSQL and other technologies. He has several certifications and is a published author for online and print-media publications, as well as the MSDN Library.
In his present role, he remains responsible for architecture design, technology stack selection, infrastructure design, 3rd party products evaluation and procurement, and performance engineering. These applications use technologies like Elasticsearch / Lucene, MongoDB, SharePoint 2013 and 2010, jQuery-based framework like Highcharts and GoJS, SQL Server and the Microsoft Business Intelligence stack (SSIS, SSAS, SSRS, MDX, PowerPivot, PowerView), jQueryMobile, Bootstrap, iOS xCode framework, and many others.
- MSSQLTips Awards: Champion (100+ tips) – 2018 | Author of the Year – 2017 | Author Contender – 2016, 2018-2019