By: Tim Wiseman | Comments | Related: > Reporting Services Charts
Problem
The best way to understand data is often to visualize it through a graph or chart. While SQL Server includes SSRS as a Business Intelligence tool, SSRS is not always the best option nor is it always avaiable for providing data visualization. This tip will look at using Python 2.x with matplotlib and PyQT4 as a visualization option for SQL Server data.
Solution
Normally, the best way to provide a graph based on data in SQL Server is to create it in a BI tool like SSRS. SSRS is a highly versatile tool which allows for easy creation of a wide array of charts and graphs, including Trellis Charts, bullet graphs,
In order to set up an example of how this is done, let's create a simple table with some sales data:
create database TestDb
Go
use TestDb
Go
create table SalesData(SalesPerson varchar(100), mon int, amount money)
GO
--Uses a table value constructor from 2008 or later
insert into dbo.SalesData
 (SalesPerson, mon, amount)
values
 ('Jack', 1, 202.55),
 ('Jack', 2, 301.77),
 ('Jack', 3, 403.88),
 ('Jack', 4, 400.11),
 ('Jill', 1, 410.11),
 ('Jill', 2, 305.99),
 ('Jill', 3, 412.99),
 ('Jill', 4, 412.99);
To plot the data, we can use the MatPlotLib library. Matplotlib can be used in scripts without any other GUI libraries to display or save graphs of data, and can be used either in scripts or interactively from a Python prompt. However, it can generally be made more user friendly for non-programmers by including it in a GUI built with a tool kit like PyQT.
It is often useful to build most of the GUI in a dedicated designer like QT Designer but here we will focus on doing it without a designer. It is often good to know how it works without a designer even if you will use a designer most of the time and it supports more of a "cut-paste-tweak" solution. The first thing we need to do is import the libraries that will be used.
#PyQt4 and matplotlib do not come with the code distribution of python,
#but the come with some more complete Distributions like
#Python(X,Y), or they can be downloaded separately.
from PyQt4 import QtGui, QtCore
from matplotlib.backends.backend_qt4agg import (FigureCanvasQTAgg,
                        NavigationToolbar2QT)
from matplotlib.figure import Figure
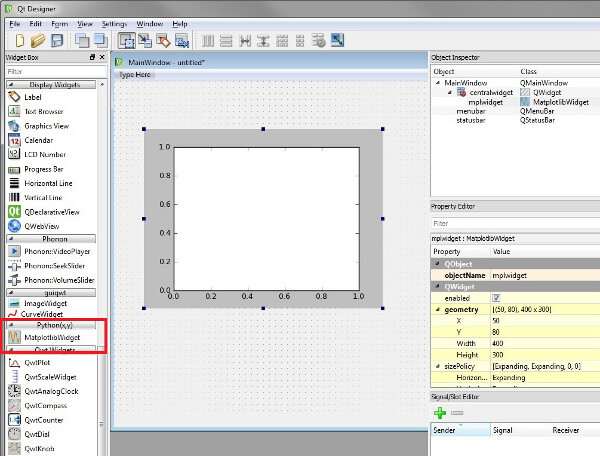
Then we will need to create a canvas class. Python(X,Y) includes a good matplotlib widget that can be added from QT Designer or invoked separately.

But here we will roll our own fairly simple class to create the widget:
class mplCanvasWidget(FigureCanvasQTAgg):
    """A QWidget that provides the canvas to be placed in the Gui.
    Variations on this are included with PythonXY."""

    def __init__(self, parent =None, x=[0, ], y=[0, ]):
        mplFig = Figure()
        self.axes = mplFig.add_subplot(1, 1, 1)
        #self.axes.hold(False) #ensures it will be cleared when plot is called
        self.plot(x, y)
        FigureCanvasQTAgg.__init__(self, mplFig)

        self.setParent(parent) #inherited as a QWidget

        FigureCanvasQTAgg.setSizePolicy(self, QtGui.QSizePolicy.Expanding,
                                        QtGui.QSizePolicy.Expanding)
        FigureCanvasQTAgg.updateGeometry(self)

    def plot(self, x, y):
        """plots the x and y lists passed in, will overwrite any data
        already there."""
        self.axes.clear()
        self.axes.plot(x, y)
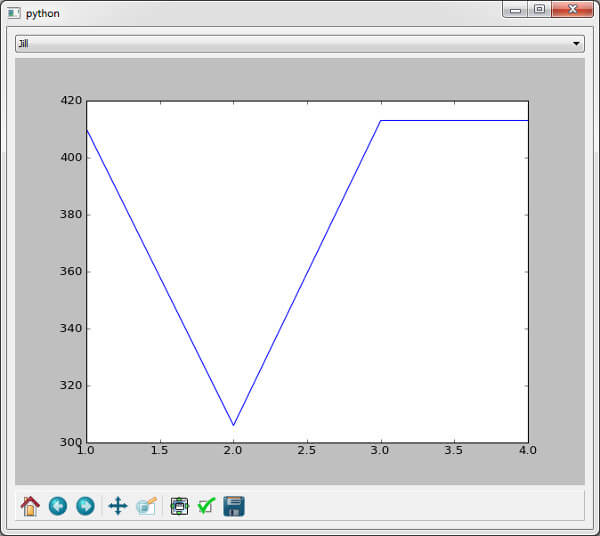
Next we will define the class that will invoke the GUI. The init procedure, which is called by Python when an instance of the class is called will create the GUI and layout the widgets. The other two functions populate the comboBox which will allow the user to select which salesperson to look at and update the graph when the user selects a new salesperson. One widget of particular interest is the NavigationToolbar2QT. This toolbar allows the user to save the graph, zoom in or out, as well as pan the image.
Since we already imported the GUI and matplotlib libraries, we do not need to do that again. But since we will be invoking pyodbc to connect to the database for the first time, we need to import that here.
import pyodbc

class guiWindow(QtGui.QMainWindow):
    """Often this would be created by a tool like QT Designer"""
    def __init__(self, sqlConn):
        QtGui.QMainWindow.__init__(self)

        #Bring the sqlConnection into the namespace
        self.sqlConn = sqlConn
        #Create the Widgets
        self.coreWidget = QtGui.QWidget(self) #This holds all the others
        #salesPersonChoice options will be populated later, just create now
        self.salesPersonChoice = QtGui.QComboBox(parent = self.coreWidget)
        self.pyPlot = mplCanvasWidget(parent = self.coreWidget)

        #define the toolbar.  This allows the user to zoom in on the
        #graph, save the graph, etc.
        self.mpl_toolbar = NavigationToolbar2QT(canvas=self.pyPlot,
                                                parent=self.coreWidget)

        #lay out the widgets defined
        #All other widgets will exist inside the QVBoxLayout
        layout = QtGui.QVBoxLayout(self.coreWidget)
        layout.addWidget(self.salesPersonChoice)
        layout.addWidget(self.pyPlot)
        layout.addWidget(self.mpl_toolbar)

        #Connect Signals and Slots
        #QT uses Signals and slots to interconnect the widgets and call actions
        QtCore.QObject.connect(self.salesPersonChoice, #object that emits
                        QtCore.SIGNAL('activated(const QString&)'), #Signal
                        self.updatePlot) #action to be taken

        #now prepare for display
        self.salesPersonChoice.addItems(self.getSalesPeople())

        self.coreWidget.setFocus()
        self.setCentralWidget(self.coreWidget)

    def getSalesPeople(self):
        salesPeopleList=['',] #start with a blank one so the user can choose
        curs = self.sqlConn.cursor()
        sql = "select distinct SalesPerson from dbo.SalesData"
        curs.execute(sql)
        for row in curs:
            salesPeopleList.append(row.SalesPerson)
        curs.close()
        curs.close()
        return QtCore.QStringList(salesPeopleList)

    def updatePlot(self):
        """Updates the plot with the data for the selected salesperson"""
        curs = sqlConn.cursor()
        person = str(self.salesPersonChoice.currentText())
        #Parameterized with ?
        sql = """select mon, amount
                from dbo.SalesData
                where SalesPerson = ?
                order by mon"""
        curs.execute(sql, (person,) )
        rows = curs.fetchall()
        x = [row.mon for row in rows]
        y = [row.amount for row in rows]
        self.pyPlot.plot(x, y)
        self.pyPlot.draw()
We can see that working with SQL Server here is relatively simple. Pyodbc permits queries to be executed directly against the server and will permit the columns to be accessed in a (cursor object).(column name) fashion. It also supports query paramaterization which, under the right circumstances, can provide some protection against SQL Injection.
And finally, we need to make the connection to SQL Server, which will be passed into our GUI class and actually invoke the class. The connection to SQL Server is done by a standard ODBC connection string passed to pyodbc.connect. But before we can invoke the GUI, we need to invoke an QApplication object, otherwise we would just get an error:
QWidget: Must construct a QApplication before a QPaintDevice
It is best to invoke the QApplication sys.argv, which is the list of command line arguments. We also need to define the exit condition for the program. This final step looks like:
sqlConnStr = ('DRIVER={SQL Server};Server=(local);Database=TestDb;'+
            'Trusted_Connection=YES')
sqlConn = pyodbc.connect(sqlConnStr)
import sys #used for argv and exec_
app = QtGui.QApplication(sys.argv)
QtGui.QApplication()
appGui = guiWindow(sqlConn)
appGui.show()
sys.exit(app.exec_())
The final results look like:

As seen, Python with PyQt and MatPlotLib can provide excellent graphing capabilities which can be embedded in a full fledged GUI. Although this would generally be an inferior option when SSRS could handle the job, it can provide the ability to insert graphs from SQL Server into larger programs or provide more versatility and control when necessary.
Next Steps
- There is an excellent sample for using MatPlotLib in QT at SourceForge by Florent Rougon and Darren Dale and also a complete book on Matplot Lib titled Matplotlib for Python Developers by Sandro Tosi. Another example of adding the toolbar inside of PyQt is available from HYRY.
- There is a good intro to PyQt from Riverbank at: What is PyQt and a good example for beginners at: Simple Text editor in PyQT4
- MatPlotLib and PyQt can be used together interactively as described at Qt with IPython and Designer
- If you have a base install of Python, it may not come with the matplotlib or PyQt libraries, but a full distribution like Python(X,Y) is likely to come with those and other libraries included. pyodbc is less commonly included in distributions, but can be downloaded separately.
- The python source code for this tip can be downloaded here. The SQL connection string will need to be set for your configuration and the test database will need to be set up first.
About the author
 Tim Wiseman is a SQL Server DBA and Python Developer in Las Vegas.
This author pledges the content of this article is based on professional experience and not AI generated.
View all my tips


