Add a linear trendline to a graph in SQL Server Reporting Services

By:   |   Comments (32)   |   Related: > Reporting Services Charts


Problem

I have a chart in SQL Server Reporting Services (SSRS), based upon data from a SQL Server table. I want to add a linear trendline to this chart, just like in Excel. How can I achieve this functionality?

Solution

In the tip Adding a calculated series to a graph in Reporting Services we learned how we can add calculated series to a chart in SSRS. However – for some unknown reason – Microsoft never included a simple linear trendline as an option while in Excel it’s just a click on a button. This means we have to calculate it ourselves of course.

In the Wikipedia article Simple linear regression, we can find more information on how to calculate linear regression.

When you have n data points {(xi,yi), i= 1..n}, then the function for the linear regression is the following:

Formula for simple linear regression function

Here n is the sampling interval, α the intercept, β the slope and εi an error variable.

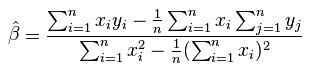
We can find β with the following formula:

Formula for retrieving the slope

Once we find β, we can calculate α like this:

Formula for retrieving the intercept

A character with a horizontal bar on top is shorthand for the average. These formulas might seem impressive, but they are actually quite easy to implement in T-SQL. But first we need to set-up some sample data.

Set-up test for a Linear Trendline for SSRS

In our example we have sales data for a not specified product over the different months. We are going to create a trendline on this data. The following statement creates the data and stores it into a temp table.

-- clean-up
IF OBJECT_ID('Tempdb..#Temp_Regression') IS NOT NULL
 DROP TABLE #Temp_Regression;

-- create sample data. Trend is an empty column that will hold the calculated linear regression later on.
SELECT ID = 1, OrderMonth = 'Jan 2014', OrderQuantity = 45, Trend = CONVERT(DECIMAL(38, 10),NULL)
INTO #Temp_Regression
UNION ALL
SELECT ID = 2, OrderMonth = 'Feb 2014', OrderQuantity = 41, Trend = CONVERT(DECIMAL(38, 10),NULL)
UNION ALL
SELECT ID = 3, OrderMonth = 'Mar 2014', OrderQuantity = 60, Trend = CONVERT(DECIMAL(38, 10),NULL)
UNION ALL
SELECT ID = 4, OrderMonth = 'Apr 2014', OrderQuantity = 50, Trend = CONVERT(DECIMAL(38, 10),NULL)
UNION ALL
SELECT ID = 5, OrderMonth = 'May 2014', OrderQuantity = 53, Trend = CONVERT(DECIMAL(38, 10),NULL)
UNION ALL
SELECT ID = 6, OrderMonth = 'Jun 2014', OrderQuantity = 58, Trend = CONVERT(DECIMAL(38, 10),NULL)
UNION ALL
SELECT ID = 7, OrderMonth = 'Jul 2014', OrderQuantity = 65, Trend = CONVERT(DECIMAL(38, 10),NULL)
UNION ALL
SELECT ID = 8, OrderMonth = 'Aug 2014', OrderQuantity = 70, Trend = CONVERT(DECIMAL(38, 10),NULL)
UNION ALL
SELECT ID = 9, OrderMonth = 'Sep 2014', OrderQuantity = 63, Trend = CONVERT(DECIMAL(38, 10),NULL);

In this example, ID is the x-coordinate and OrderQuantity the y-coordinate. The data looks like this on a graph:

Simple line plot with the base data

Calculating the trendline

First we are going to create a whole bunch of variables that will store the different parts of the formulas. Using standard T-SQL aggregations functions, they are straight forward to calculate.

-- declare all variables
DECLARE @sample_size INT; 
DECLARE @intercept  DECIMAL(38, 10);
DECLARE @slope   DECIMAL(38, 10);
DECLARE @sumX   DECIMAL(38, 10);
DECLARE @sumY   DECIMAL(38, 10);
DECLARE @sumXX   DECIMAL(38, 10);
DECLARE @sumYY   DECIMAL(38, 10);
DECLARE @sumXY   DECIMAL(38, 10);

-- calculate sample size and the different sums
SELECT
  @sample_size = COUNT(*)
 ,@sumX   = SUM(ID)
 ,@sumY   = SUM([OrderQuantity])
 ,@sumXX   = SUM(ID*ID)
 ,@sumYY   = SUM([OrderQuantity]*[OrderQuantity])
 ,@sumXY   = SUM(ID*[OrderQuantity])
FROM #Temp_Regression;

-- output results
SELECT
  SampleSize   = @sample_size  
 ,SumRID    = @sumX   
 ,SumOrderQty   =@sumY   
 ,SumXX    = @sumXX   
 ,SumYY    = @sumYY   
 ,SumXY    = @sumXY;

Now we just have to put the different parts together to calculate the slope and the intercept.

-- calculate the slope and intercept
SET @slope = CASE WHEN @sample_size = 1
    THEN 0 -- avoid divide by zero error
    ELSE (@sample_size * @sumXY - @sumX * @sumY) / (@sample_size * @sumXX - POWER(@sumX,2))
    END;
SET @intercept = (@sumY - (@slope*@sumX)) / @sample_size;

Now that we have found the slope and the intercept, we can easily calculate the linear trendline in each x-coordinate. We store the results in the temp table.

-- calculate trend line
UPDATE #Temp_Regression
SET Trend = (@slope*ID) + @intercept;

-- output results
SELECT * FROM #Temp_Regression;

We get the following result in SSRS when we add another line to the chart using the trend data.

Chart with the trendline added

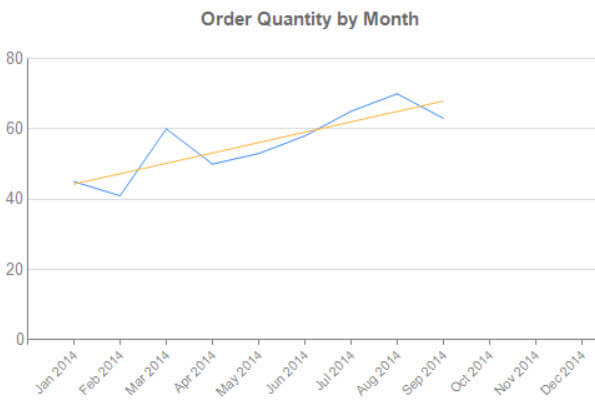
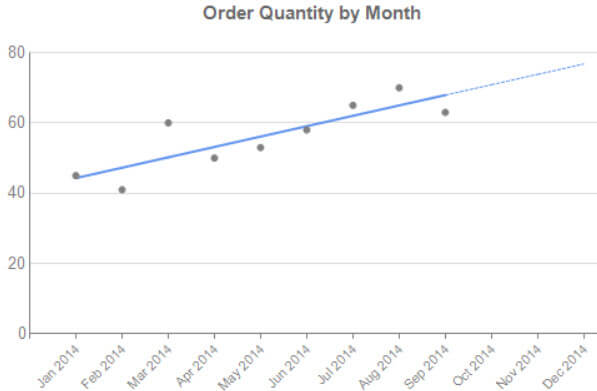
Let’s tweak the layout a bit so the trendline stands out.

The layout is adapted to make the trendline more prominent

The dots were achieved by changing the chart type of OrderQuantity to Line with Markers and then setting the border width to 0.25pt, which apparently makes the lines disappears.

Creating a forecast

Using the linear trendline, we can do some rudimentary forecasting. We just supply new months into the regression function and we get a prediction of the order quantity.

This is done with the following code:

/* calculate predicted values */

-- create a full list of 12 months
WITH CTE_AllIDs AS
(
 SELECT TOP 12 ID = ROW_NUMBER() OVER (ORDER BY (SELECT NULL))
 FROM sys.columns
)
SELECT
  c.ID
 ,OrderMonth  = CASE WHEN r.ID IS NOT NULL
       THEN r.OrderMonth
       -- elaborate function to get the short month name and year
       ELSE CONCAT(LEFT(DATENAME(MONTH,CONVERT(DATE,CONCAT('2014','-',c.ID,'-','01'))),3),' 2014')
       END
 ,OrderQuantity
 ,Trend
 ,Forecast  = CASE WHEN Trend IS NOT NULL AND c.ID <> (SELECT MAX(ID) FROM #Temp_Regression)
        THEN NULL
       -- For the last actual value (September in this example), we want forecast to have the same
       -- value as the trendline (instead of NULL). This prevents a gap in the line charts in SSRS.
       WHEN Trend IS NOT NULL AND c.ID = (SELECT MAX(ID) FROM #Temp_Regression)
        THEN Trend
       -- If trend is not found, it means we can calculate a forecast.
       -- However, we also need to check if the month for which we calculate the forecast comes after
       -- the actual values. Suppose we don't have values for January, then we don't want to calculate
       -- a forecast for January as well. Only for the last 3 months of the year in this example.
       WHEN Trend IS NULL AND c.ID > (SELECT MAX(ID) FROM #Temp_Regression)
        THEN (@slope * (c.ID % 100)) + @intercept
       ELSE NULL
       END
FROM  CTE_AllIDs   c
LEFT JOIN #Temp_Regression r ON c.ID = r.ID;

First we create a list of all the months we want on the graph, including months not provided by the original data set. If the trend is already known for a month, we keep the forecast empty. If the trend is not known, we calculate the forecast using the slope and the intercept. For the last month of the original data set (September in our example), we calculate the forecast as well. This prevents SSRS from having a gap between the trendline and the forecast line.

This gives the following result set:

Query output with predicted values

Let’s plot this in SSRS, where the forecast is indicated by a dotted line:

Trendline with forecast in dotted line

Keep in mind that this is a very simplified forecast which might have a high error margin. It also doesn't keep effects such as seasonality in account. There are more efficient trendline algorithms available for better forecasts.

Conclusion

Although there is no built-in option in SSRS to display a linear trendline on a chart, it is straight forward to do the calculation in T-SQL. This assumes a relational source of course.

Next Steps


sql server categories

sql server webinars

subscribe to mssqltips

sql server tutorials

sql server white papers

next tip


About the author
MSSQLTips author Koen Verbeeck Koen Verbeeck is a seasoned business intelligence consultant at AE. He has over a decade of experience with the Microsoft Data Platform in numerous industries. He holds several certifications and is a prolific writer contributing content about SSIS, ADF, SSAS, SSRS, MDS, Power BI, Snowflake and Azure services. He has spoken at PASS, SQLBits, dataMinds Connect and delivers webinars on MSSQLTips.com. Koen has been awarded the Microsoft MVP data platform award for many years.

This author pledges the content of this article is based on professional experience and not AI generated.

View all my tips


Comments For This Article


Monday, June 21, 2021 - 4:36:09 PM - Laeeq Hamid Back To Top (88879)
Hi Koen,

Nice Article

Regards,
Laeeq

Tuesday, March 5, 2019 - 4:08:38 PM - Koen Verbeeck Back To Top (79199)

Hi Craig,

thanks for reading. In this tip I used the month numbers because it's easy to visualize. But the values of the X-axis don't need to be like an identity column. You just need an ordinal X-axis. It's not the X-values themselves that are very important, it's their relation with the corresponding Y-values.

Regards,
Koen


Tuesday, March 5, 2019 - 10:56:08 AM - Craig Back To Top (79195)

Hello Koen et al;
I have a question (with two parts) that I'm hoping someone more famliar with the underlying math can help me figure out.

In this very informitive 'tip' one of the 'sums' is @sumX = SUM(ID) - my question is this: Does this speicific value require values 1,2,3,4 ... up to the end of the recordset (essentially row numbers)?  I ask as an actual 'ID' column will seldom be so concise.  For instance, I have a dataset that uses a date value combined with a sequence number for the 'ID' column, so values like 4411416, 4422427, 1702103, 1199776, 1297663 are common.  If I SUM() these, I suspect I will be getting wildly different slopes than what should be present. 

The second part may answer the first- The [ID] field in your dataset corresponds with the month number; is that a necessary requirement?  I'd have thought not but this is rather new to me still so learning. 


Tuesday, September 4, 2018 - 2:11:51 AM - Koen Verbeeck Back To Top (77354)

Hi Pihong,

if you already have a linear regression model set-up in SSAS for the exact same data, you can probably use it. You probably can query that model using DMX. However, if you have to start new, I don't think it's easier. First of all, the data mining in SSAS is deprecated, so I would avoid using it in new projects: https://blog.crossjoin.co.uk/2018/04/26/deprecated-and-discontinued-functionality-in-ssas-2017/.

As you have read in this tip, setting up simple linear regression with T-SQL is straight forward. Why bring in extra code/complexity to solve the problem? If you really want to remove the calculation in SSRS (so it's only a front-end), I'd look at building a Python or R model and use SQL Server Machine Learning Services.

https://docs.microsoft.com/en-us/sql/advanced-analytics/tutorials/machine-learning-services-tutorials?view=sql-server-2017


Monday, September 3, 2018 - 7:53:52 AM - Pihong Back To Top (77351)

Koen,

I just wonder if prediction in SSAS can be used in SSRS. If so, it would be much easier. Anyway, I like your work. Well done.

Cheers

Pihong


Monday, September 3, 2018 - 7:51:01 AM - Pihong Back To Top (77350)

 Koen,

You did a excellent job. Very useful. But I just wonder if SSAS can be used in SSRS. Thus all prediction can be completed in SSAS and used in SSRS. How do you think?

Cheers

Pihong


Friday, December 15, 2017 - 5:28:35 AM - Alistair Francis Back To Top (74037)


-------------------------------------------------------------------------------------------------------------------------------


-- Calculate Linear Trend Lines for several collections of data values


-- This will process multiple sets of data using the two grouping variable [gbid] and [Analysis]


--


-- Thanks to Koen Verbeeck


-- http://www.mssqltips.com/sqlservertip/3432/add-a-linear-trendline-to-a-graph-in-sql-server-reporting-services/


-------------------------------------------------------------------------------------------------------------------------------


ALTER PROCEDURE [dbo].[gen_TrendLine]


( @From_Object_Id int


, @Into_Object_Id int


)


AS


BEGIN


SET NOCOUNT ON


-- declare all variables


DECLARE @gen_From_Object_Id int;


DECLARE @gen_Into_Object_Id int;


DECLARE @SQL nvarchar(max);


---------------------------------------------------------------------------------------------------------------------------


-- Table for recieving data to be analysed - INPUT


CREATE TABLE #gen_From


( gbid int -- seperate data collections 1


, Analysis varchar(5) -- seperate data collections 2


, [X] Decimal(38,10) null -- Category values


, [Y] Decimal(38,10) null -- the data values


)


;


---------------------------------------------------------------------------------------------------------------------------


-- Table for the calculated trend line - OUTPUT


CREATE TABLE #gen_Into


( gbid int -- seperate data collections 1


, Analysis varchar(5) -- seperate data collections 2


, [X] Decimal(38,10) null -- Category values


, [T] Decimal(38,10) null -- the calculated trend line


)


;


---------------------------------------------------------------------------------------------------------------------------


-- Table for calculating interum values


CREATE TABLE #gen_Sums


( gbid int -- seperate data collections 1


, Analysis varchar(5) -- seperate data collections 2


, sample_size INT


, sumX DECIMAL(38, 10)


, sumY DECIMAL(38, 10)


, sumXX DECIMAL(38, 10)


, sumYY DECIMAL(38, 10)


, sumXY DECIMAL(38, 10)


, intercept DECIMAL(38, 10)


, slope DECIMAL(38, 10)


)


;


---------------------------------------------------------------------------------------------------------------------------


-- Table for indivdual categories


CREATE TABLE #gen_Cats


( gbid int -- seperate data collections 1


, Analysis varchar(5) -- seperate data collections 2


, X DECIMAL(38, 10)


)


;


---------------------------------------------------------------------------------------------------------------------------


SELECT @gen_From_Object_Id=Object_Id('Tempdb.dbo.#gen_From');


SELECT @gen_Into_Object_Id=Object_Id('Tempdb.dbo.#gen_Into');


SELECT @SQL=dbo.gen_InsertSelect(@from_Object_Id, @gen_From_Object_Id);


EXECUTE sp_executesql @SQL;


---------------------------------------------------------------------------------------------------------------------------


-- calculate sample size and the different sums


INSERT INTO #gen_Sums


SELECT gbid


, Analysis


, COUNT(*) as sample_size


, SUM([X]) as SumX


, SUM([Y]) as SumY


, SUM([X]*[X]) as SumXX


, SUM([Y]*[Y]) as SumYY


, SUM([X]*[Y]) as SumXY


, 0


, 0


FROM #gen_From


GROUP BY gbid


, Analysis


;


---------------------------------------------------------------------------------------------------------------------------


-- calculate the slope and intercept


UPDATE #gen_Sums


SET Slope = (sample_size * sumXY - sumX * sumY) / (sample_size * sumXX - POWER(sumX,2))


WHERE sample_size>1


;


UPDATE #gen_Sums


SET Intercept= (sumY - (slope*sumX)) / sample_size


;


---------------------------------------------------------------------------------------------------------------------------


-- calculate trend line values


INSERT INTO #gen_Cats


SELECT distinct gbid


, Analysis


, [X]


FROM #gen_From


;


INSERT INTO #gen_Into


SELECT a.gbid


, a.Analysis


, a.[X]


, b.slope*a.[X] + b.intercept


FROM #gen_Cats a


JOIN #gen_Sums b ON a.gbid=b.gbid and a.Analysis=b.Analysis


;


----------------------------------------------------------------------------------------------------------------------------------------


-- Build the transfer sql and execute it


SELECT @SQL=dbo.gen_InsertSelect(@gen_Into_Object_Id, @Into_Object_Id);


EXECUTE sp_executesql @SQL;


END

-- =======================================================================================================================================


-- Author: Alistair Francis


-- Create date: 12/03/2015


-- Description: Builds an insert-select statement from two table object_ids for a pair of temporary tables


-- =======================================================================================================================================


ALTER Function [dbo].[gen_InsertSelect] (@From_Object_Id int, @Into_Object_Id int) returns nvarchar(max)


AS


BEGIN


DECLARE @SQL nvarchar(max);


DECLARE @Into_TableName nvarchar(max)


DECLARE @From_TableName nvarchar(max)


DECLARE @Cols TABLE ([Name] nvarchar(100) NULL, [Id] int NULL)


;


SELECT @From_TableName=t.name FROM tempdb.sys.tables t WHERE t.object_id = @From_Object_id;


SELECT @Into_TableName=t.name FROM tempdb.sys.tables t WHERE t.object_id = @Into_Object_id;


----------------------------------------------------------------------------------------------------------------------------------------


-- Get list of common column names


INSERT INTO @Cols SELECT i.[Name], i.[Column_Id]


FROM tempdb.sys.columns i JOIN tempdb.sys.columns f


ON i.object_id = @Into_Object_Id and f.object_id = @From_Object_Id and i.Name=f.Name


;


-- convert list of names into a comma seperated string


SET @SQL = substring((SELECT ( ', ['+[NAME]+']' ) FROM @ColS b ORDER BY [Id] FOR XML PATH( '' )), 3, 4000 )


;


IF len(@SQL)>0 SET @SQL ='INSERT INTO '+@Into_TableName+' ('+@SQL+') SELECT '+@SQL+' FROM '+@From_TableName


;


RETURN @SQL


;


END


Tuesday, November 8, 2016 - 3:10:47 AM - Koen Verbeeck Back To Top (43720)

Hi Ztrew,

not sure what you mean?
If you have months first, and then the years only, you would dynamically change the scale of the X-axis. Not sure that's possible.


Tuesday, November 1, 2016 - 7:53:08 AM - Ztrew Back To Top (43666)

Hi,

How can i do that the forecast go to 2020 without monthname?

Thanks.


Friday, September 16, 2016 - 3:18:28 AM - Harsh Back To Top (43342)
Worked great for me to get my database growth projection. Just had to remove " % 100" from below code:

" 
WHEN Trend IS NULL AND c.ID > (SELECT MAX(ID) FROM #Temp_Regression) THEN (@slope * (c.ID % 100)) + @intercept ELSE NULL END FROM CTE_AllIDs c LEFT JOIN #Temp_Regression r ON c.ID = r.ID;
"

Greatly appreciate this tutorial !!

Monday, June 27, 2016 - 6:45:23 PM - Matt Back To Top (41773)


Regarding the lines not being straight, this will occur if the sort order of the data being put into the Temp table doesn't match the order that SSRS will be displaying it in. So if SSRS is going to sort by OrderMonth as the category (x-axis), then that is the order that the data needs to sequentially occur in / be inserted in, within the Temp table BEFORE the linear regression calculation is performed.


Sunday, May 1, 2016 - 7:45:08 AM - DG Back To Top (41373)

This is really nice. The forecast line works well.
Now, I'm trying to to build an UPPER FORECAST and a LOWER FORECAST, by multiplying calculated forecast values by +/- 5%.

However, the lines created are not quite straight .

Any idea?


Thanks


Tuesday, October 6, 2015 - 2:13:03 AM - Koen Verbeeck Back To Top (38827)

Hi Guiseppe,

there's not much you can do in SSRS.
As mentioned in the article, you have to calculate everything yourself in the SQL statement.
If you need an extra trendline, you need to calculate it in the SQL statement as an extra column.
You probably need to adapt the formula a little bit. 


Saturday, October 3, 2015 - 2:56:14 AM - Giuseppe Back To Top (38819)

Sorry.

I have a graph and i need two trendline (range trendline)

One line starts from point 0 (bottom of y axis)  the other starts from point 24 (on y axis).

The ending point of trendlines reach the max horizontal line of y axis.

Sorry for my bad english.

If possible i can send you a pic of the graph ...

Giuseppe

Italy 


Thursday, October 1, 2015 - 1:36:38 PM - Koen Verbeeck Back To Top (38804)

Hi Guiseppe,

I'm sorry, I didn't really catch your issue.
What problem are you facing exactly? 


Thursday, October 1, 2015 - 1:12:05 PM - Giuseppe Back To Top (38803)

Hi my problem is that i have two trendline :

one have to start from one value on the y axis and the other have to start from zero ....

Thanks

Giuseppe

Italy


Wednesday, June 17, 2015 - 4:07:59 AM - Koen Verbeeck Back To Top (37940)

@Linda:

you could add parameters to the stored procedure that indicate which months you need (or don't need).

Then you can add an UPDATE statement right before the select that sets the trendline values to NULL for every row that doesn't satisfy those parameters.


Tuesday, June 16, 2015 - 2:40:12 PM - Linda Back To Top (37937)

This has been extremely helpful however, I need to be able to pass parameters dynamically through reporting services.  So for instance using your example above, if the user only wants to see a trendline for 6 months of data (March thru Aug) how would you be able to pass that to the stored procedure?  Currently I have a report that allows the user to pick a clinic, multiple fiscal years and multiple months based on the fiscal years.  The graph renders on what is chosen.  I'd like to add the trendline based on the user's parameters.  Thank you in advance for your time


Tuesday, May 5, 2015 - 8:11:21 PM - John Back To Top (37099)

Thanks a lot for this tutorial.  I extrapolated the concept for groups of data within a single table and it worked wonderfully.

Knocked it out in about an hour.

Greatly appreciated.


Friday, January 23, 2015 - 9:04:43 AM - Koen Verbeeck Back To Top (36037)

@Prakash: yes, you already posted that output.
What I find strange is that there are no decimal values (no digits behind the comma), although the script uses DECIMAL(38,10).

I also asked for the output of the following query:

SELECT

  SampleSize   = @sample_size  

 ,SumRID    = @sumX   

 ,SumOrderQty   =@sumY   

 ,SumXX    = @sumXX   

 ,SumYY    = @sumYY   

 ,SumXY    = @sumXY;


Thursday, January 22, 2015 - 10:28:00 PM - prakash Back To Top (36033)

Table

id  ordermonth orderquantity trend

------------------------------------

1.  Jan 2014.  45.  65

2.  Feb 2014.  41.  63

3.  Mar 2014.  60.  60

4.  Apr 2014.   50.  58

5.  May 2014.  53.  55

6.  Jun 2014.   58.  53

7.  Jul 2014.    65.  50

8.  Aug 2014.   70. 48

9.  Sep 2014.    63. 45


This is my table with trend line column which comes from query. The values in trend line column are not increasing sequentially. Their is up and down in the values so that I'm unable to get straight line.


Thursday, January 22, 2015 - 2:10:38 PM - Koen Verbeeck Back To Top (36028)

@Prakash: if I copy paste the different scripts from the tip into one big script and execute it, I always get the same results.

What is the output of the following query on your system?

SELECT

  SampleSize   = @sample_size  

 ,SumRID    = @sumX   

 ,SumOrderQty   =@sumY   

 ,SumXX    = @sumXX   

 ,SumYY    = @sumYY   

 ,SumXY    = @sumXY;


Thursday, January 22, 2015 - 11:47:29 AM - prakash Back To Top (36025)

Ya same data as above 


Thursday, January 22, 2015 - 3:09:06 AM - Koen Verbeeck Back To Top (36017)

@Prakash: what is the source data that you used? The same as in the tip?


Wednesday, January 21, 2015 - 9:32:06 AM - Koen Verbeeck Back To Top (36008)

@Prakash: I'm busy right now. I'll get to your question. Give me a little bit of time.


Wednesday, January 21, 2015 - 1:50:55 AM - prakash Back To Top (36004)

Waiting for your help


Monday, January 19, 2015 - 2:36:55 AM - Prakash Back To Top (35981)

This is what i have used

DECLARE @sample_size INT;

DECLARE @intercept  DECIMAL(38, 10);

DECLARE @slope   DECIMAL(38, 10);

DECLARE @sumX   DECIMAL(38, 10);

DECLARE @sumY   DECIMAL(38, 10);

DECLARE @sumXX   DECIMAL(38, 10);

DECLARE @sumYY   DECIMAL(38, 10);

DECLARE @sumXY   DECIMAL(38, 10);


-- calculate sample size and the different sums

SELECT

  @sample_size = COUNT(*)

 ,@sumX   = SUM(ID)

 ,@sumY   = SUM([OrderQuantity])

 ,@sumXX   = SUM(ID*ID)

 ,@sumYY   = SUM([OrderQuantity]*[OrderQuantity])

 ,@sumXY   = SUM(ID*[OrderQuantity])

FROM tempregression;


-- output results

SELECT

  SampleSize   = @sample_size  

 ,SumRID    = @sumX   

 ,SumOrderQty   =@sumY   

 ,SumXX    = @sumXX   

 ,SumYY    = @sumYY   

 ,SumXY    = @sumXY;


 SET @slope = CASE WHEN @sample_size = 1

    THEN 0 -- avoid divide by zero error

    ELSE (@sample_size * @sumXY - @sumX * @sumY) / (@sample_size * @sumXX - POWER(@sumX,2))

    END;

SET @intercept = (@sumY - (@slope*@sumX)) / @sample_size;


-- calculate trend line

UPDATE tempregression

SET Trend = (@slope*ID) + @intercept;


--Table

id  ordermonth orderquantity trend

------------------------------------

1Jan 20144565

2Feb 20144163

3Mar 20146060

4Apr 20145058

5May 20145355

6Jun 20145853

7Jul 20146550

8Aug 20147048

9Sep 20146345


Monday, January 19, 2015 - 2:27:28 AM - Prakash Back To Top (35980)

Hi,

I have tried the above example with same values. But, I'm unable to get the straight line. I hope their is some issue with the formula. the trend line values are not in sequentially incrementing. Can you please explain me.

Thanks in advance


Monday, January 12, 2015 - 7:48:11 AM - Koen Verbeeck Back To Top (35900)

@Prakash: What exactly should be explained?


Monday, January 12, 2015 - 4:20:31 AM - Prakash Back To Top (35899)

Can you please explain this example in brief


Tuesday, January 6, 2015 - 11:31:32 AM - Chantale Tebakouna Back To Top (35843)


No comment at this moments. HAPPY NEW YEAR.


Tuesday, January 6, 2015 - 10:45:58 AM - J. Hunter Johnson Back To Top (35840)

Nice approach. I think you can also just set the border to "None" to get rid of the line, but perhaps that loses the dots as well? I'll have to try it. I had a slightly different approach to calculating the linear regression (and also checking for spikes) in T-SQL and in Oracle here: http://jhunterj.com/2012/11/08/spikes-slopes-and-sql/


get free sql tips
agree to terms