By: Ashish Kumar Mehta | Comments (8) | Related: > Monitoring
Problem
SQL Server 2012 Performance Dashboard Reports are Custom Reports which Microsoft has developed to quickly give an overview of the overall performance of SQL Server 2012 instance. Keep in mind that in order to use the Performance Dashboard Reports you don't need to install SQL Server Reporting Services. In this tip we will take a look at how to install and use these built-in SQL Server Reporting Services Reports.
Solution
SQL Server 2012 Performance Dashboard Reports can be downloaded from the following link: http://www.microsoft.com/download/en/details.aspx?id=29063. The Microsoft Documentation states that "The SQL Server 2012 Performance Dashboard Reports are Reporting Services report files designed to be used with the Custom Reports feature of SQL Server Management Studio. The reports allow a database administrator to quickly identify whether there is a current bottleneck on their system, and if a bottleneck is present, capture additional diagnostic data that may be necessary to resolve the problem. The Dashboard reports basically retrieve information from SQL Server Dynamic Management Views and hence there is no additional overhead when using these reports."
Common performance problems that the Performance Dashboard Reports may help to resolve include:
- CPU bottlenecks
- What queries are consuming the most CPU?
- IO bottlenecks
- What queries are performing the most IO operations?
- Index recommendations generated by the query optimizer
- What are the potential missing indexes?
- Blocking
- What blocking is occurring?
- Latch contention
- What are the volume of latches?
Once you have successfully downloaded the SQL Server 2012 Performance Dashboard Reports then the next step will be to install the reports. Follow the steps below to complete the installation process.
Install the SQL Server 2012 Performance Dashboard Reports
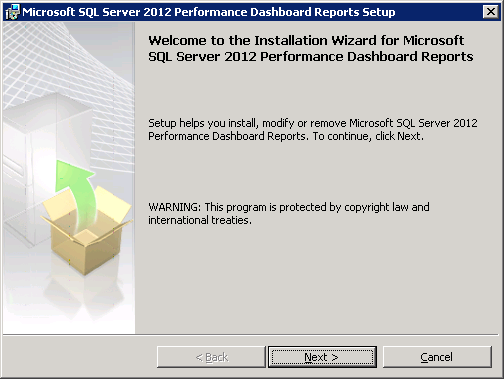
1. Double click on the SQLServer2012_PerformanceDashboard.MSI and we are presented with the Welcome screen. Click Next.
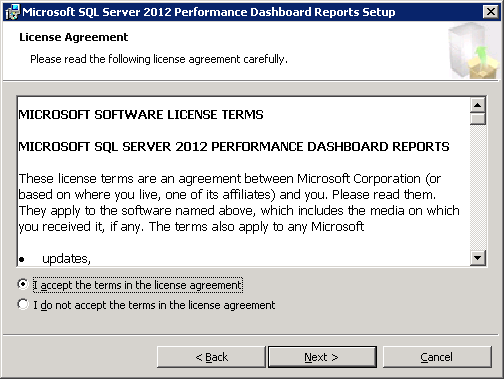
2. Next we are presented with the License Agreement screen. Read License Agreement and Click Next.
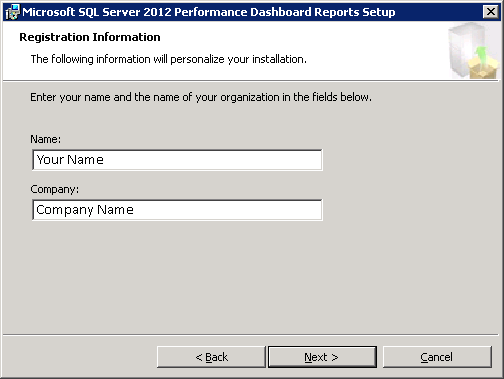
3. For the third step we are presented with a Registration Information screen. Enter your registration information and then Click Next.
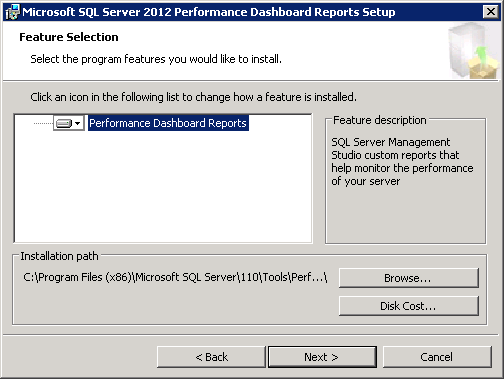
4. In the Feature Selection screen accept the default selection and click Next.
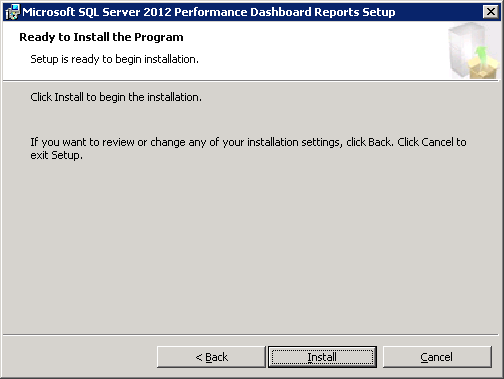
5. We're now ready to install. Click Install to start the installation process.
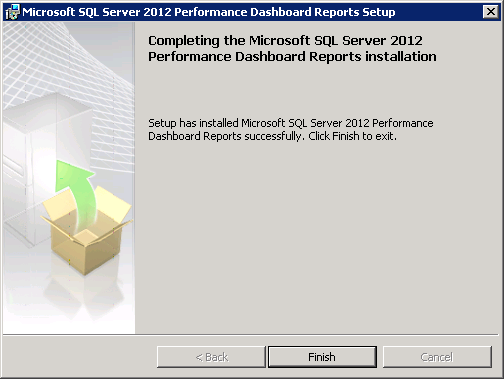
6. When you have reached this screen, the installation is now complete. Click the Finish button to exit the installation wizard.
Configure the SQL Server 2012 Performance Dashboard Reports
Once the Installation is complete, then the next step will be to configure the SQL Server to run the Performance Dashboard Reports. By default the Performance Dashboard Reports are installed in the "C:\Program Files (x86)\Microsoft SQL Server\110\Tools\Performance Dashboard\" directory. Browse through the above mentioned location and double click the "setup.sql" file to open it in SQL Server Management Studio. Connect to the SQL Server 2012 instance where you want to install the reports and then press the "Execute" button or F5 to configure Performance Dashboard Reports.
Using the SQL Server 2012 Performance Dashboard Reports
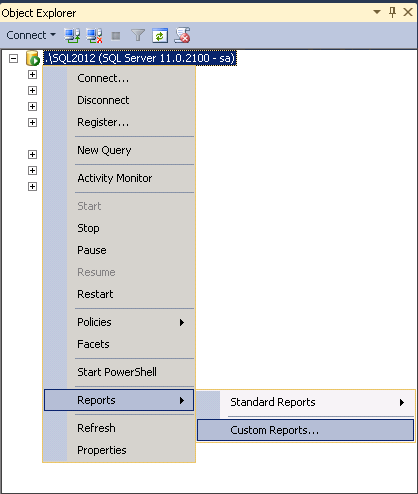
Once you are connected to SQL Server 2012, right click on the SQL Server instance and expand Reports, then choose Custom Reports... as shown in the screen shot below.
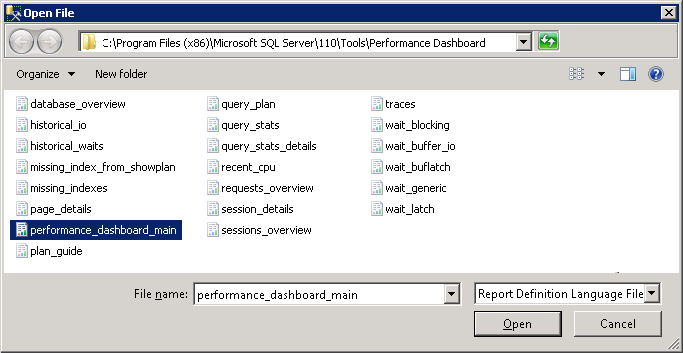
Within the Open File Dialog box choose performance_dashboard_main report file as shown in the below snippet and click Open to display the report.
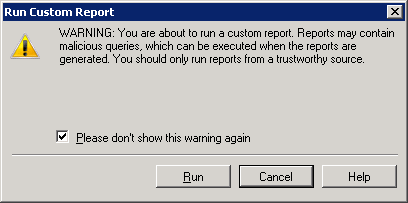
Once you open the performance_dashboard_main.rdl file using the dialog box, you're presented with the following warning screen. Click the Run button to display the report.
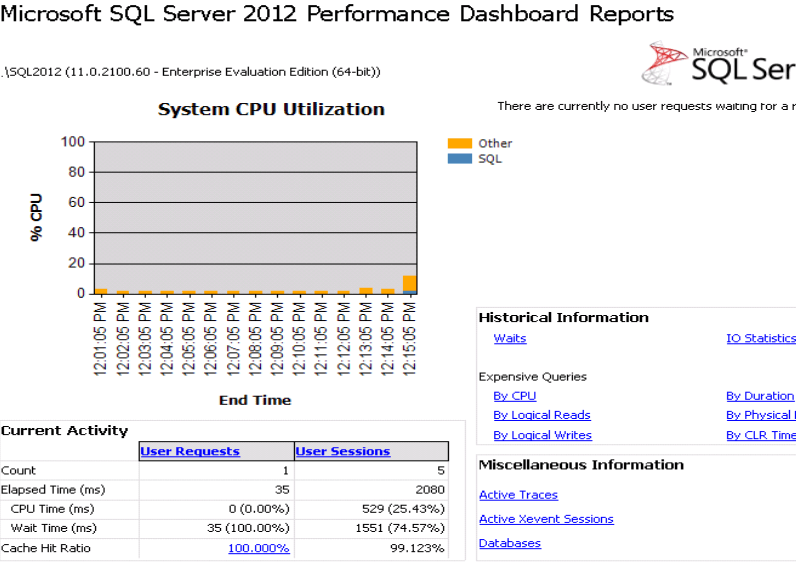
In the below screen shot you will see a sample Performance Dashboard Report generated in SQL Server 2012.
Next Steps
- Evaluate the remainder of the Custom Reports by selecting the links from the main report.
- If you have not had a chance to preview SQL Server 2012, then download SQL Server 2012 Evaluation Editionto start today.
- Download Microsoft SQL Server 2012 Performance Dashboard Reports.
- Stay tuned for more tips on SQL Server 2012and check out these related tips:


About the author
 Ashish Kumar Mehta has been contributing to the MSSQLTips.com community since 2009 with over 60 tips.
This author pledges the content of this article is based on professional experience and not AI generated.
View all my tips
