Problem
As we explore the Amazon Web Service (AWS) Relational Database Service (RDS) for SQL Server, we will learn about another new topic today: how to monitor RDS performance. Monitoring an RDS instance involves using one or more additional AWS services. In this tip we will learn about those services and see how they can help measure SQL Server performance.
Solution
Monitoring SQL Server databases is an integral part of a DBA’s work life. Monitoring can be done in two forms: reactive monitoring involves investigating slow application performance or database related incidents. Proactive monitoring involves automated ways to keep an eye on the server’s health. Some monitoring are done at application level, like checking for job failures every morning; some monitoring are done at the infrastructure level, like investigating low disk space.
Application code can perform the same logic irrespective of whether it’s hosted on-premises or in the cloud, but its performance will depend largely on the underlying infrastructure powering it. Perhaps the biggest difference between on-premises SQL Servers and those hosted in RDS is that we don’t have OS-level access to an RDS server. DBAs can’t use PerfMon, Resource Monitor or Event Viewer to see what’s going on with the server and that’s why they need to make use of other tools available from AWS.
In this tip we will learn how to monitor the health of an RDS SQL Server instance. We will see how we can browse the metrics and graphs available for RDS, how we can set up customized alarms for different metrics and get notified when those alarms are triggered. We will also introduce RDS events and event subscriptions.
Introducing AWS Simple Notification Service (SNS)
Before we get into RDS monitoring, let’s talk about Simple Notification Service (SNS).
Amazon Simple Notification Service or SNS is an AWS Web Service that helps cloud-hosted applications send notifications to different types of recipients. These notifications can come from all different types of sources: custom applications can create and send their own messages; different native AWS services can send their service-specific messages, etc. The whole purpose of notification is to build automation and fault tolerance around AWS-hosted solutions. For example, an application running a number of sequential processing steps can have SNS messaging built into each step of the way. Each step of the process can send a notification to its downstream neighbor about the component’s success or failure. The receiving step can then decide whether to continue or abort the operation.
Another example would be an auto-scaling infrastructure. Based on the user load on the system, an auto-scaling infrastructure can decide to add or reduce one or more server instances in its processing fleet. When this happens, the system administrators could be notified about the size of the server-pool increasing or decreasing. Similarly, AWS can notify system administrators when a server instance fails critical health checks during boot up.
The underlying infrastructure for SNS is provided by AWS. Like other AWS services, it’s designed to be fault tolerant and scalable. All an application needs to do is to make use of it.
As DBAs we would like to automate the monitoring of our RDS instances. We would like to know when the CPU is hitting 100%, when disk I/O seems to be a bottleneck or when the RDS instance is doing nothing and needs to be shut down. The automated monitoring can send messages to the DBA via e-mail or even SMS text messages. For the really imaginative, it can send messages to an application that can take self-healing measures like rebooting the database server.
SNS messages are published to what’s known as topics. A topic is just like a discussion forum thread: messages are published into a named topic. An AWS infrastructure can have multiple topics in an SNS environment: topics that are used by applications, topics that send messages to mobile applications and so on.
Topic notifications are not automatically pushed to the recipients. Recipients need to subscribe to topics first. From then on, the receiver will receive notification every time a new message is added to the topic.
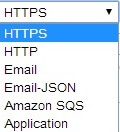
Topic recipients are called endpoints in SNS terms and SNS can use a number of protocols for sending messages to these endpoints. It can use HTTP or HTTPS, it can use simple e-mail or e-mail formatted as JSON (JavaScript Object Notification), it can use SMS for text messages to cell phones, it can use mobile applications or simply publish to another AWS service called Simple Queue Service (SQS).
To see how this all works, let’s create an SNS topic for monitoring our RDS instance. We would like SNS to send us automated DBA alert messages via e-mail.
To start with it, let’s first log into the AWS Management Console and choose SNS (Push Notification Service) under Mobile Services:
The SNS Dashboard page looks like the figure below:
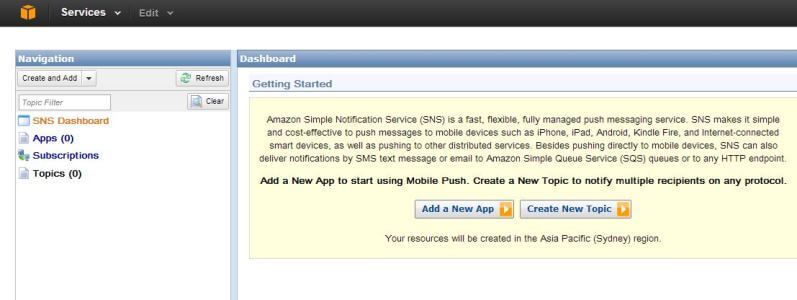
As you can see from the figure, SNS is a push messaging system for mobile devices like the iPhone, iPad, Android or Kindle Fire. It can also send out messages in other different formats. In our case, no topic has been defined in the current region and no mobile app has been defined either. We are not looking at mobile application messaging, so we will create a new topic first. Clicking on the Create New Topic button will pop up a new dialogue box:
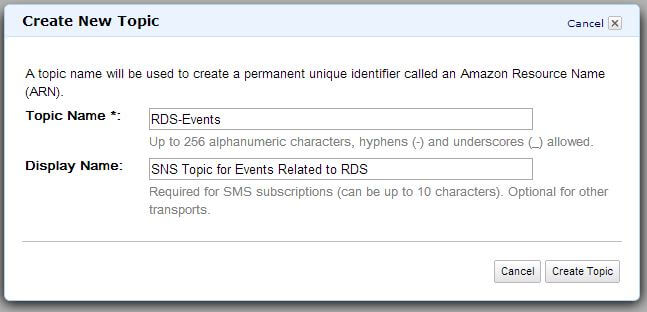
The topic name can be anything, but we have provided a name that indicates it’s related to RDS Events. Clicking the Create Topic button will create the topic:
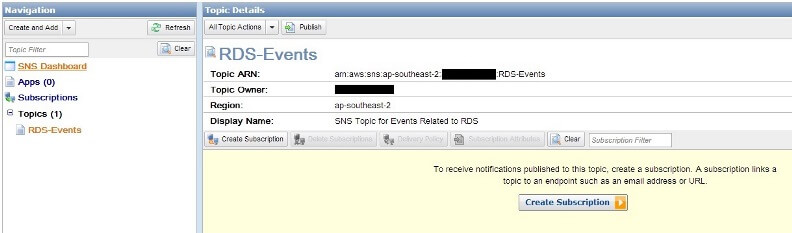
We can see the topic has a unique identifier called Amazon Resource Name (ARN), also the navigation pane on left shows one topic exists in the current region.
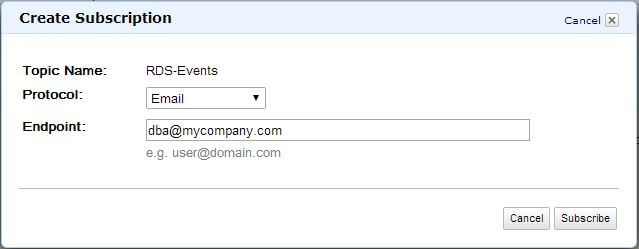
A topic by itself doesn’t have much value unless someone subscribes to it. To create an e-mail subscription, we can click on the “Create Subscription” button. This opens up the next dialogue box:
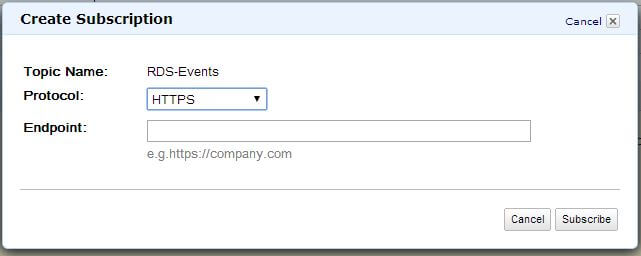
We can see a number of protocols exist for our current region (in this case the region was ap-southeast-2):
We chose Email since we want to be notified by e-mail. We also provided an address where we want these messages to come to:
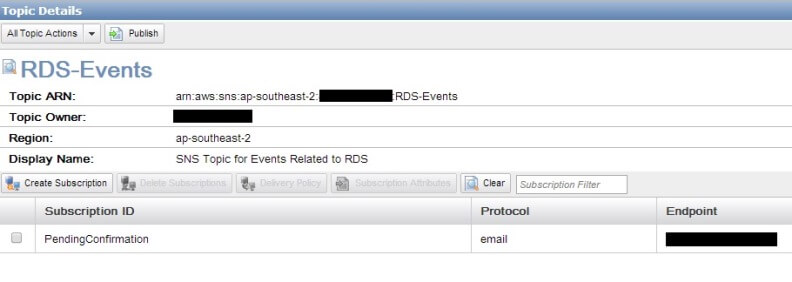
Once the Subscribe button is clicked, the subscription will be created, but it won’t be operational. It would be in a “Pending Confirmation” state. That’s because Amazon doesn’t want you to arbitrarily use people’s e-mail addresses. Any subscription request will have to be explicitly accepted by the receiver. The following figure shows the confirmation message and the state of the SNS dashboard:
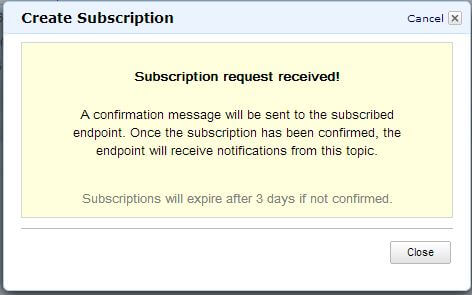
We can see that a confirmation e-mail will be sent to the address we provided before and if the confirmation hasn’t been accepted within three days the subscription will be dropped.
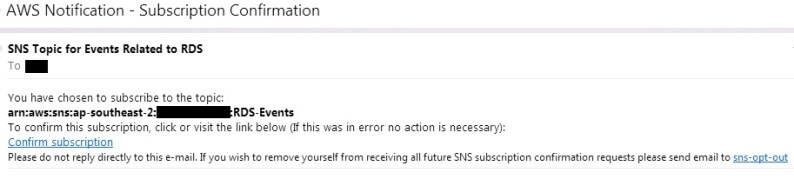
If we now go to the inbox of the e-mail address provided, we will see a message like this:
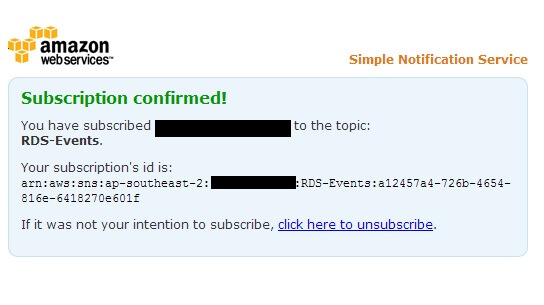
Clicking on the Confirm subscription link will take us to a web page:
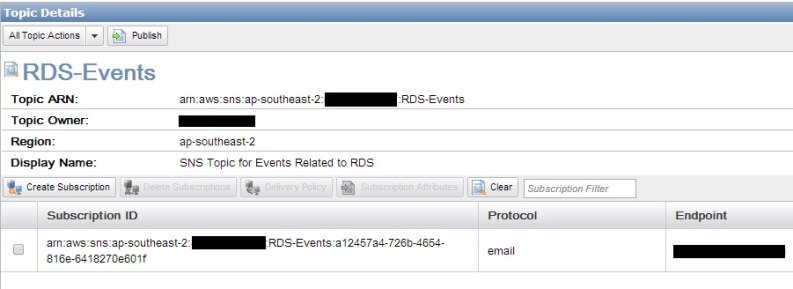
If we come back to the SNS dashboard and refresh it now, we will see our subscription has been confirmed and its assigned a Subscription ID:
That’s all that we need to do now. Our SNS topic is ready to receive DBA messages and we have also subscribed to it from our DBA mailbox.
Introducing AWS CloudWatch
Amazon CloudWatch is a web service for monitoring almost all AWS services and resources. CloudWatch monitors and collects real-time information from different services like EC2, RDS, DynamoDB or Elastic Block Store (EBS). The collected metrics can be accessed via custom written applications, third-party tools or the AWS Management Console.
Regularly reviewing CloudWatch graphs can help system administrators understand if their servers are running over-provisioned or over-utilized. Historical trend graphs aside, CloudWatch can also create alarms. An Alarm is a pre-configured event that gets triggered when a certain threshold is crossed. Perhaps a Windows server is hitting 90% CPU for twenty minutes straight, perhaps an EBS volume has reached 98% of its capacity or a NoSQL database is performing with less than the IOPS (Input Output Per Second) provisioned for it. Whatever the resource, once an alarm is triggered, CloudWatch can take a number of pre-defined steps.
A classic example of CloudWatch alarm can be seen when servers run in auto-scaling mode. Using CloudWatch, the load on a pool of servers can be monitored continuously. When the load exceeds a certain limit (in terms of say, CPU usage), an alarm is fired. The response to that alarm can be adding one or more instances to the server pool. When the alarm is cleared (CPU falls below the threshold), instances can be shut down to bring the pool back to its original size. That’s how CloudWatch enables AWS hosted solutions to follow an elastic mode: the capacity grows and shrinks with demand.
Another example of CloudWatch alarm is billing alerts. Organizations need to be on top of their spending in the cloud. It’s easy to roll out hundreds of servers, provision terabytes of storage and create dozens of database instances without even noticing how much it’s all going to cost. Since AWS uses a pay-as-you-go model, the invoice at the end of the month can be a shock for the finance department if the infrastructure has not been planned for properly. You would probably want to be notified when your account spending crosses a certain threshold. AWS implements this by a feature called the Billing Alert. With billing alert, CloudWatch monitors your usage of AWS resources and the costs that are incurred. When it crosses a pre-defined value, an alarm is triggered and you are notified.
So how does CloudWatch relate to RDS? Well, among other things, CloudWatch also monitors RDS related metrics. We can look at historical trends of RDS instances from CloudWatch graphs or create alarms to notify DBAs when there are problems. And that’s the crux of it: we are trying to automate the monitoring by making it as proactive as possible.
CloudWatch Metrics for RDS
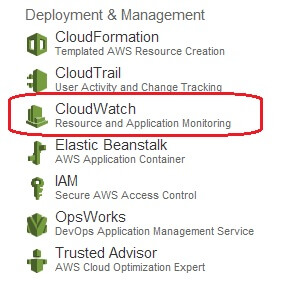
To start with it, we need to go to the CloudWatch dashboard first. From the AWS Management Console, let’s choose CloudWatch (Resource and Application Monitoring) option from under the Deployment and Management Section:
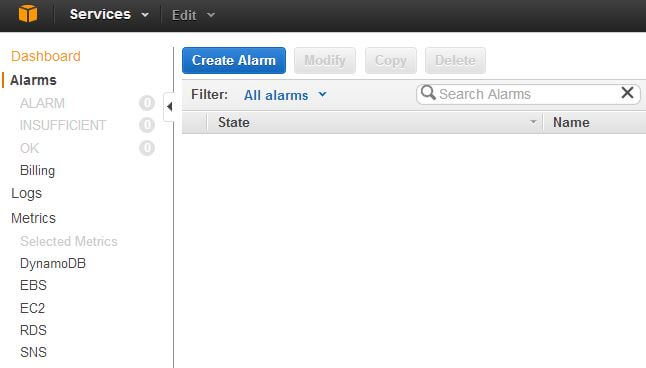
This will present us with the CloudWatch Dashboard:
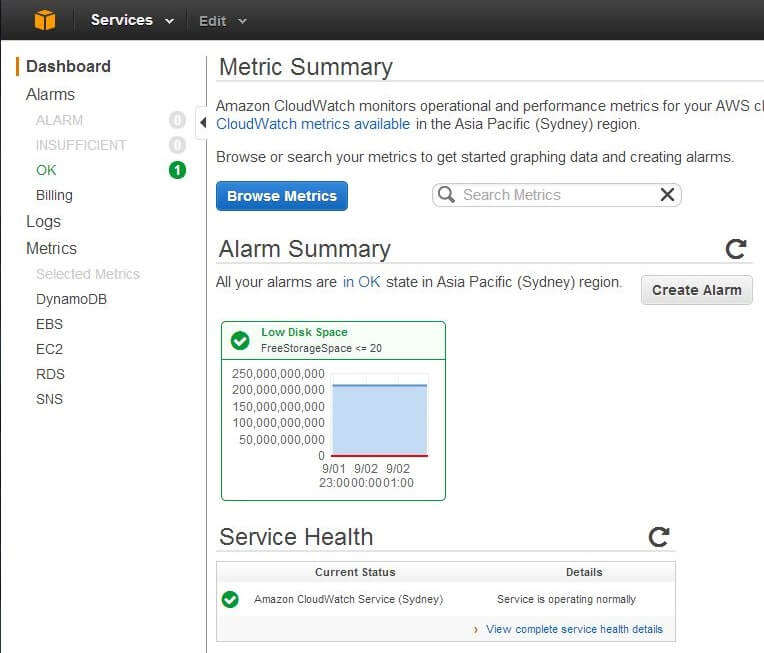
What we see here will depend on a few things. Let’s first explain the options in the navigation menu on left side:
- The Alarms section is where we define alarms for our AWS resources.
- If there are alarms that have already been activated, they will be logged under the ALARM sub-menu. The number of activated alarms will be shown in a red circle.
- Alarms that have not yet crossed their threshold will be listed under the OK section. We can see from the number inside a green circle that one alarm is in OK state (nothing to be alarmed about).
- If there is insufficient data to determine if an alarm should be activated, it’s listed under the INSUFFICIENT section.
- Billing sub-menu shows the Billing Alerts that have been created. At the time of this writing AWS shows all billing data and alarms in US-East-1 (North Virginia) CloudWatch.
- The Logs section is also currently active only in US-East-1 region. This section shows different logs collected, aggregated and monitored from various applications, OS kernels or web servers. The logs aggregated by CloudWatch can provide you a unified picture of the resources running in that region. For our purpose, we will ignore this.
- The Metrics section categorizes different metrics available from different services used in the current region. In the figure above, we can see that CloudWatch is gathering metrics from DynamoDB, Elastic Block Store (EBS), Elastic Compute Cloud (EC2), Relational Database Service (RDS) and Simple Notification Service (SNS) in our current region.
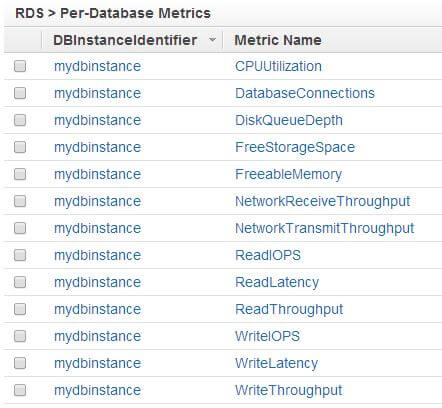
To see what metrics are available for RDS, we can click on the RDS link. This will show us the metrics listed against each database instance. In our case, the RDS instance name is mydbinstance:
Let’s now see what each of these metrics mean.
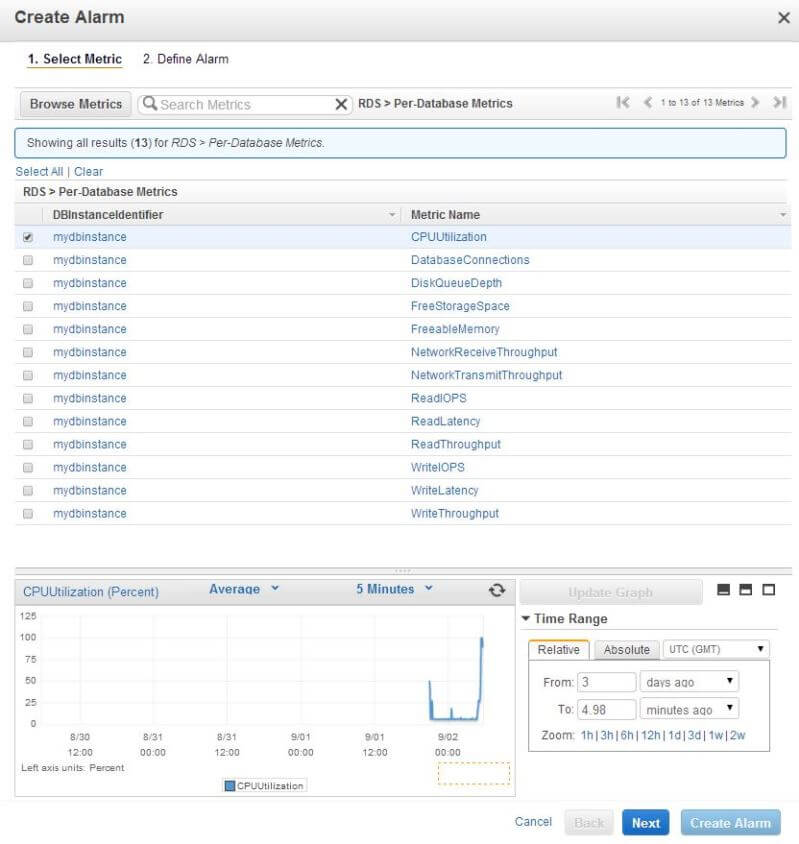
- CPUUtilization: The percentage load on the CPU (Amazon has not clearly defined if it’s the physical host CPU or the virtual machine CPU). Monitoring this metric is a good way to see if RDS is under load.
- DatabaseConnections: The number of connections against our RDS instance.
- DiskQueueDepth: The number of outstanding I/O requests at any one time. The lower this number, the better. A consistent high queue depth is a clear indication of disk bottleneck.
- FreeStorageSpace: The amount of free space available in the server, measured in bytes. If you want to get notified when free space falls below a certain threshold, you would want to create an alarm against this metric.
- FreeableMemory: The amount of RAM currently free, expressed in bytes. Again, a low value can mean memory pressure (the root cause can of course be something different).
- NetworkReceiveThroughput and NetworkTransmitThroughput: The number of bytes received and sent by the instance. This traffic includes both client application traffic as well as AWS “internal” traffic used for monitoring and replication. This metric, along with the DatabaseConnections metric can give you a good indication of whether the instance is idle.
- ReadIOPS: The average number of disk read operations per second.
- WriteIOPS: The average number of disk writes operations per second.
- ReadLatency: The average number of seconds for a read operation.
- WriteLatency: The average number of seconds for a write operation.
- ReadThroughput: The average number of bytes read from disk per second.
- WriteThroughput: The average number of bytes written to disk per second.
Pop quiz: you want to watch your database server’s disk I/O performance, what metrics should you use? You got it: DiskQueueDepth, ReadThroughput, WriteThroughput as well as ReadLatency and WriteLatency.
Interpreting CloudWatch Graphs for RDS
We can view RDS CloudWatch graphs from two different places: RDS console and the CloudWatch metrics page.
When you click on the Show Monitoring button from the RDS console, the metrics will be shown in little charts:

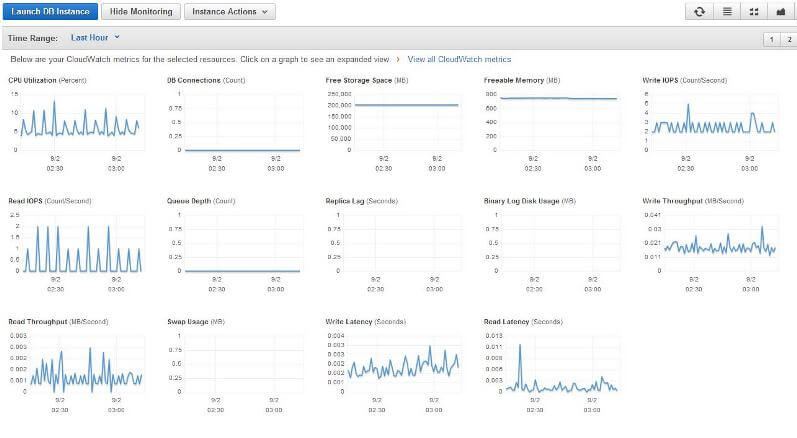
From this figure, we can immediately see the CPU isn’t doing much: its average load is oscillating between 0 to 15 percent. Storage space and memory usage is also more-or-less static, so disk space or memory is not under pressure. As the disk is not doing much (in fact this was an idle instance), most of the I/O related charts are showing very small values.
If you notice, there are some extra metrics available here:
- Swap Usage (MB): The amount of swap file being used by the DB instance. Although Windows servers have page files which are equivalent to Linux/UNIX Swap space, this metric doesn’t apply to SQL Server RDS instances.
- Replica Lag (Seconds): The number of seconds a read-replica of an RDS instance is “behind” its primary instance. Read Replicas are available only for MySQL instances in RDS and this metric doesn’t apply to SQL Server either.
The graphs in this page auto refreshes every few seconds, giving you a “running picture” of the instance. By default the charts are shown for last one hour, but you can choose a period going back last two weeks. CloudWatch overwrites its metrics for the instance every two weeks. Also, clicking on any of the graphs opens it in a bigger window.
Going back to our CloudWatch page for RDS metrics, if we select any of the metrics from the list, the corresponding graph is shown in the bottom half of the screen. In the following screenshot we have chosen CPUUtilization for last six hours. The trend shows there was a spike in the middle of this period, but there was no significant variation from the average:
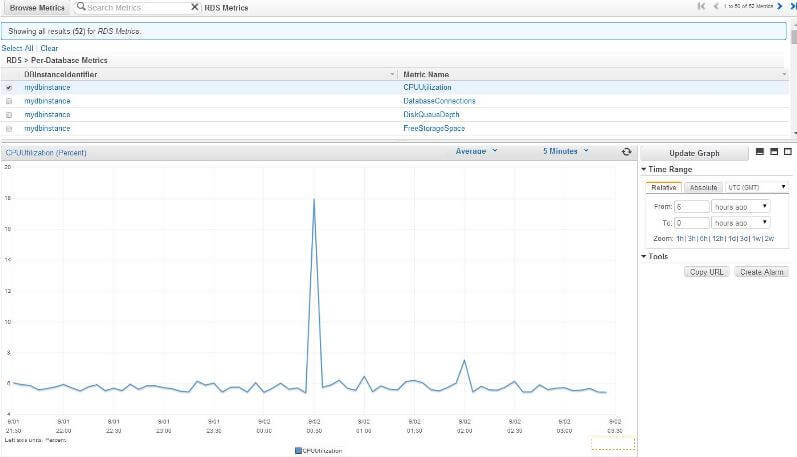
By default the sampling interval for the chart is five minutes. You can always change this to suit your needs (for example, by 1 minute interval). Similarly the value charted here is the Average Percentage CPU Utilization. You can opt to chart minimum, maximum, average, sum or data samples for the same metric. Obviously each graph will be different.
If you choose multiple metrics from the list, the graphs will be overlaid on the same chart.
Creating CloudWatch Alarms for RDS
To see how we can create an alarm from CloudWatch, let’s go back to the CPU Utilization metric.
Say we would like to be notified when the CPU hits a threshold of 80% and stays there for at least five minutes. We can create the alarm from many places, but in this example we are going to the Alarms page of CloudWatch and clicking on the Create Alarm button:
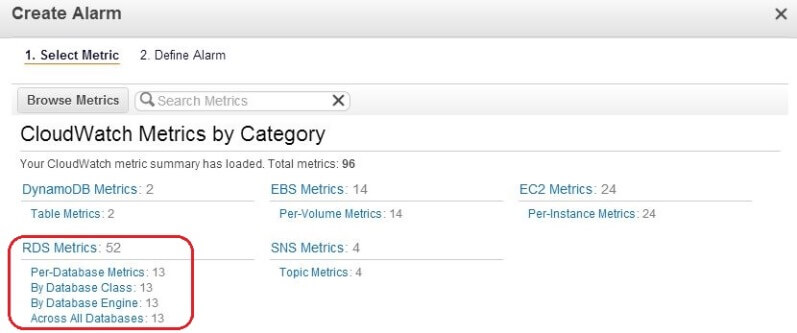
The dialogue box that appears will show different metrics listed by service type. For RDS, the metrics are arranged by database class, database instance and so on. For our purpose, we chose the Per-Database Metrics option:
In the next dialogue box we selected the CPUUtilization metric for mydbinstance:
Clicking the Next button takes us to the next screen where we are asked about an alarm name and a threshold:
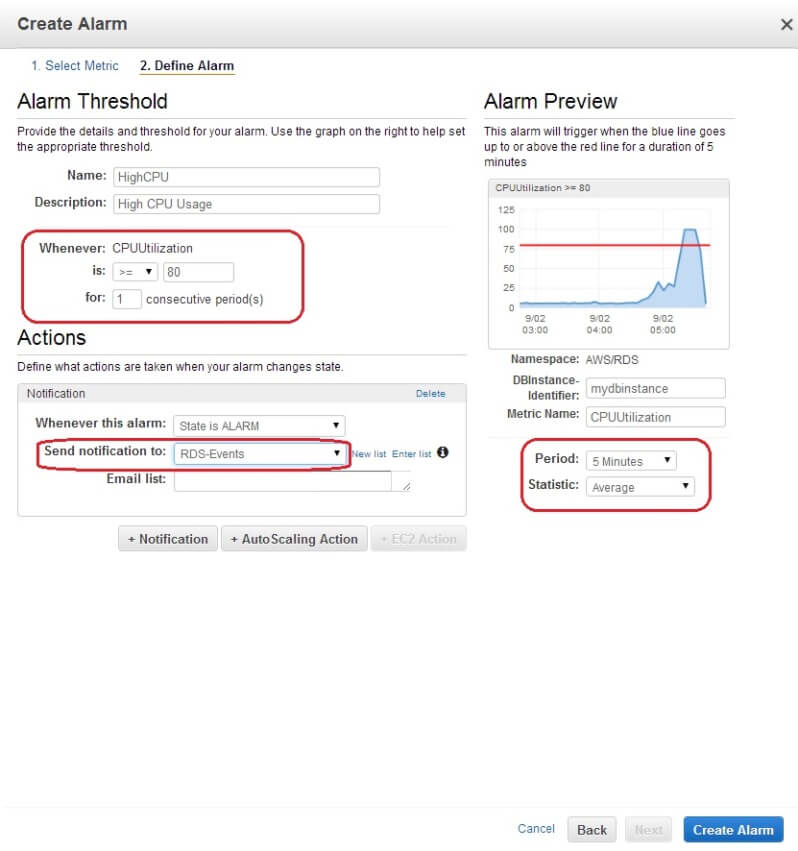
Note the fields here. First, we have provided an alarm name and description. Then we have defined the CPU Utilization threshold as running 80% for 1 period. That period is defined as 5 minutes.
What’s most important here is the Action we have defined. We want RDS to notify us whenever this alarm is triggered. So how does CloudWatch know where to send its messages? Well, that’s the notification topic we created at the beginning of this tip. We had already created this topic in SNS and it’s available for us here in CloudWatch. Note that we could add more notifications for this alarm. AutoScaling Action is needed when you want a fleet of EC2 instances to grow or shrink based on the alarm. It’s not relevant here. Once we click on the Create Alarm button, the alarm will be created.
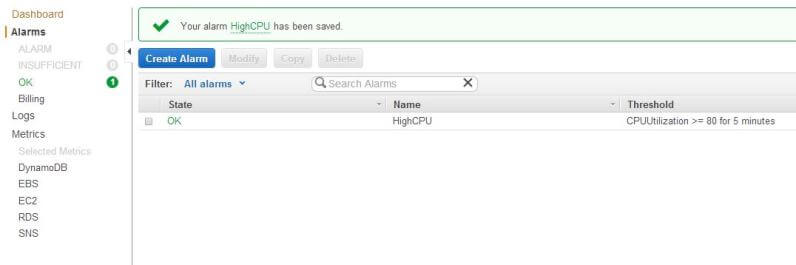
This will take us back to the Alarms page. In the following figure, we can see the alarm hasn’t fired and it’s state is OK:
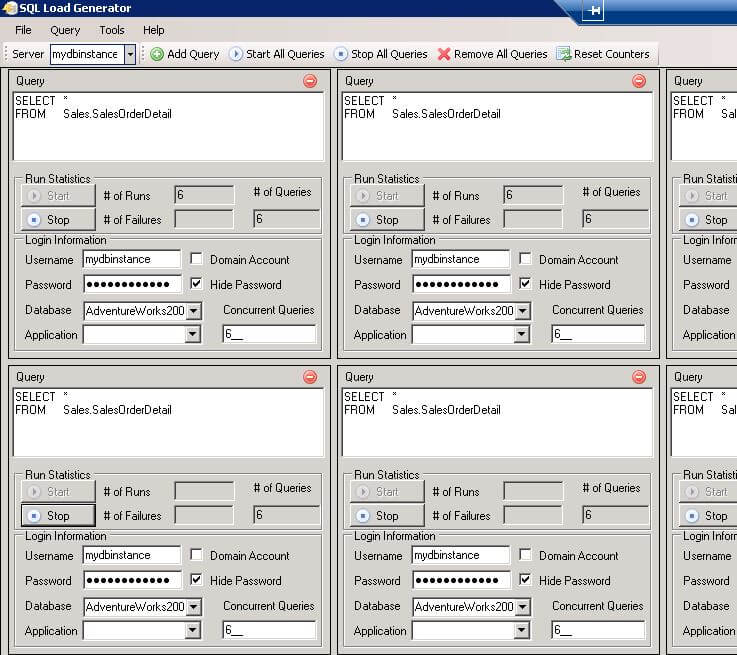
To manually trigger the alarm, we used a basic load generator. SQL Load Generator is a tool that allows you to run multiple concurrent queries against a database server.
Our RDS instance was hosting a copy of the AdventureWorks2008 database so we decided to open a few connections against it and run the following command from each connection:
SELECT * FROM Sales.SalesOrderDetail
The figure below shows SQL load Generator running the command against the Sales.SalesOrderDetail table which has over a million records:
Before long, the CPU can be seen rising in the RDS Monitoring window:
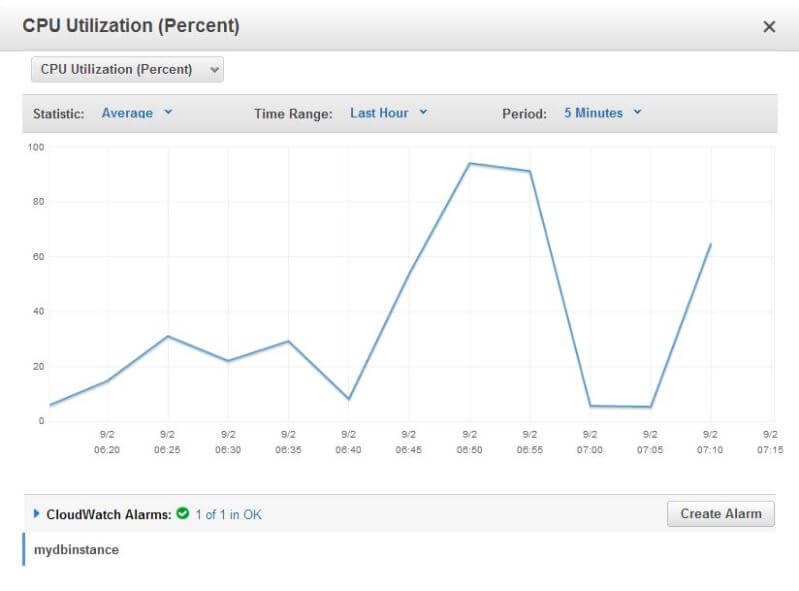
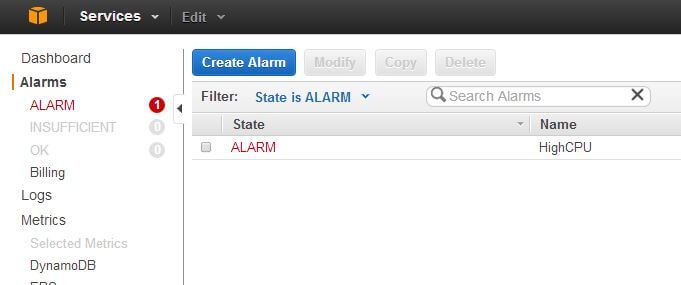
And sure enough, once the CPU hits 80% mark for five minutes, the alarm is triggered:
We also receive an e-mail from AWS. We receive this e-mail because we had specified this address as a subscriber to an SNS topic. We had instructed CloudWatch to publish its alarms to this SNS topic.
SNS Topic for Events Related to RDS
To    Me Today at 5:16 PM
You are receiving this email because your Amazon CloudWatch Alarm
"HighCPU" in the APAC - Sydney region has entered the ALARM state,
because "Threshold Crossed: 1 datapoint (87.41499999999999) was greater
than or equal to the threshold (80.0)." at "Tuesday 02 September, 2014
07:16:12 UTC".
View this alarm in the AWS Management Console:
https://console.aws.amazon.com/cloudwatch/home?region=ap-southeast-2#s=Alarms&alarm=HighCPU
Alarm Details:
- Name:  HighCPU
- Description: High CPU Usage
- State Change: OK -> ALARM
- Reason for State Change: Threshold Crossed: 1 datapoint (87.41499999999999) was greater than or equal to the threshold (80.0).
- Timestamp: Tuesday 02 September, 2014 07:16:12 UTC
- AWS Account: XXXXXXXXXXXX
Threshold:
- The alarm is in the ALARM state when the metric is GreaterThanOrEqualToThreshold 80.0 for 300 seconds.
Monitored Metric:
- MetricNamespace: AWS/RDS
- MetricName: CPUUtilization
- Dimensions: [DBInstanceIdentifier = mydbinstance]
- Period: 300 seconds
- Statistic: Average
- Unit: not specified
State Change Actions:
- OK:
- ALARM: [arn:aws:sns:ap-southeast-2:XXXXXXXXXXXX:RDS-Events]
- INSUFFICIENT_DATA:
--
If you wish to stop receiving notifications from this topic, please click or visit the link below to unsubscribe:
...
...
Please do not reply directly to this e-mail. If you have any questions or comments regarding this email, please contact us at https://aws.amazon.com/support
The message is fairly self-explanatory. We can see the MetricName is CPUUtilization, we can see the DBInstanceIdentifier it’s coming from is called mydbinstance and the period is 300 seconds. We can also see the UTC time when the threshold (80%) was crossed. The CPU was at 87.4% at that time.
And this is how we create performance monitor alarms for RDS instances.
RDS Events and Event Subscriptions
The last topic we will cover here is about RDS Events and how to monitor them. RDS exposes a number of events for database instances. These events don’t reflect the internal working of the instance; we have SQL Server error logs for that. We talked about how to access RDS SQL error logs in the second part of this series. The events that we talk about here are the events that happen to the instance itself. Let’s consider a few examples:
- An RDS instance is automatically backed up by the system
- Someone takes a snapshot of an RDS instance
- Someone changes a configuration parameter value for an RDS instance
- An RDS instance is deleted or it fails over to another availability zone
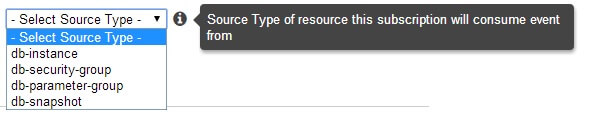
Events can come from different types of sources. Some events are generated when an instance-specific action takes place like creation, deletion or back up of an instance. Some events are generated when snapshot related activities take place. Others relate to DB parameter group or DB security groups changes. The figure below shows four different sources of RDS events:
Now as a DBA, you would want to know when these events occur. To make that happen, let’s first go to the RDS console. From there, if we select the Events menu option from the navigation pane, the most recently occurred events are displayed in the detail pane:
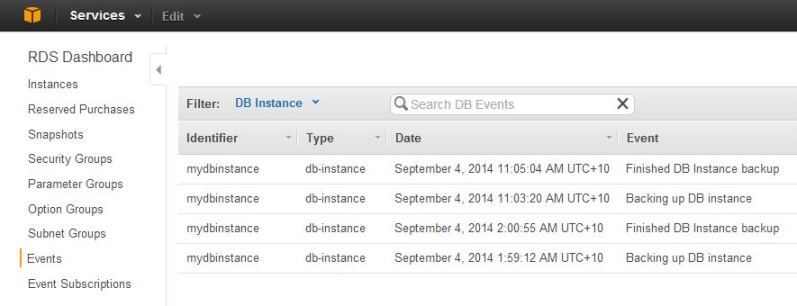
You can see there are two database backup events listed here. If we now select the Event Subscriptions menu option from the navigation pane, we are presented with an empty screen (unless there are subscriptions already created before):
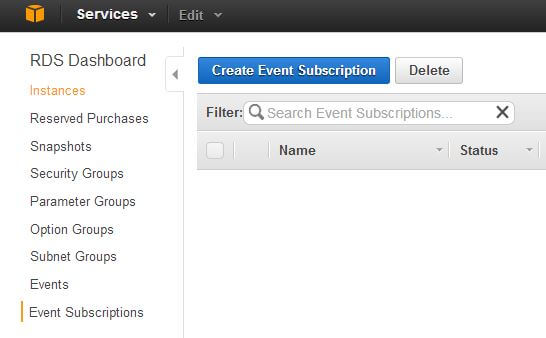
From here, if we click on the Create Event Subscription button, another page will appear.
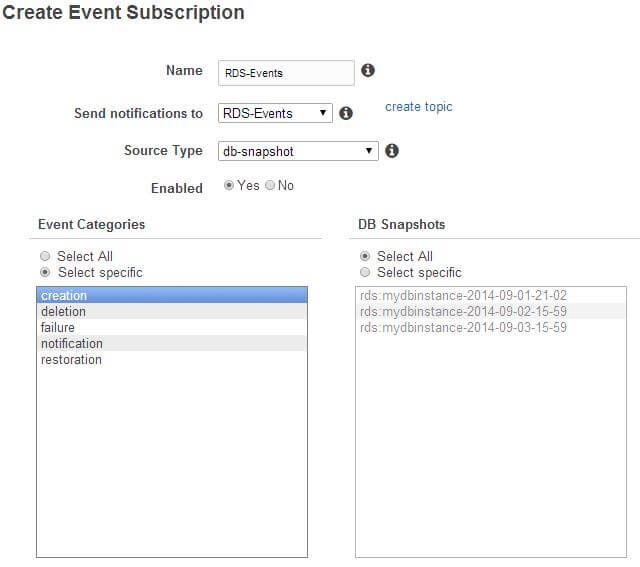
In the following figure, we have provided a meaningful name to our event subscription. We also want the subscription to receive messages from RDS-Events, the Simple Notification Service topic that we created before. We have chosen to be notified when events from the db-snapshot source type occur. In particular, we would like RDS to notify us when a snapshot of the instance is created.
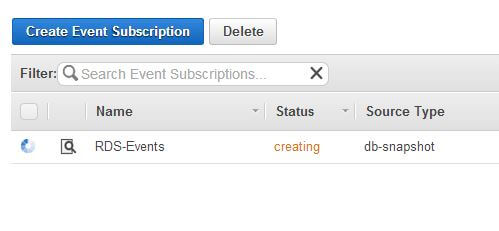
Next, when we click the Yes, Create button (not shown here), the event subscription is created. The following figure shows the initial status as creating:
As the subscription gets created, we will receive an initial e-mail:
SNS Topic for Events Related to RDS
To Me Today at 12:43 PM
This is a message to notify that RDS will attempt to send you event notifications of type db-snapshot to the topic arn:aws:sns:ap-southeast-2:XXXXXXXXXXXX:RDS-Events.
--
If you wish to stop receiving notifications from this topic, please click or visit the link below to unsubscribe:
some-long-url
Please do not reply directly to this e-mail. If you have any questions or comments regarding this email, please contact us at https://aws.amazon.com/support
Once the status of the subscription is active, we will receive another e-mail:
SNS Topic for Events Related to RDS
To Me Today at 12:46 PM
Event Source : Confirmation
Notification time : 2014-09-04 02:46:19.859
Message : RDS-Create-Notification
--
If you wish to stop receiving notifications from this topic, please click or visit the link below to unsubscribe:
some-long-url
Please do not reply directly to this e-mail. If you have any questions or comments regarding this email, please contact us at https://aws.amazon.com/support
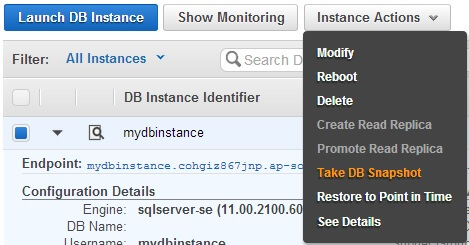
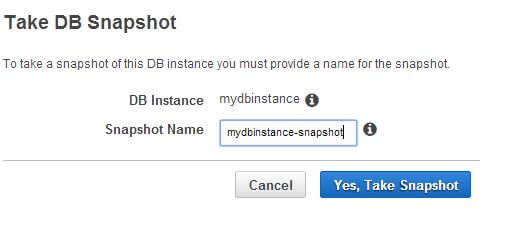
To test the event subscription, we decided to create a snapshot of the database instance. Going back to the instance home page, we did so:
As the snapshot process starts, we receive the first SNS notification:
SNS Topic for Events Related to RDS
To Me Today at 1:13 PM
Event Source : db-snapshot
Identifier Link: https://console.aws.amazon.com/rds/home?region=ap-southeast-2#
SourceId: mydbinstance-snapshot
Notification time : 2014-09-04 03:08:38.146
Message : Creating manual snapshot
Event ID : http://docs.amazonwebservices.com/AmazonRDS/latest/UserGuide/USER_Events.html#RDS-EVENT-0040
--
If you wish to stop receiving notifications from this topic, please click or visit the link below to unsubscribe:
some-long-url
Please do not reply directly to this e-mail. If you have any questions or comments regarding this email, please contact us at https://aws.amazon.com/support
The message notifies us that a manual snapshot of the database instance has been kicked off. And once that’s completed, we will receive another e-mail:
SNS Topic for Events Related to RDS
To    Me Today at 1:13 PM
Event Source : db-snapshot
Identifier Link:
https://console.aws.amazon.com/rds/home?region=ap-southeast-2#
SourceId: mydbinstance-snapshot
Notification time : 2014-09-04 03:12:02.328
Message : Manual snapshot created
Event ID : http://docs.amazonwebservices.com/AmazonRDS/latest/UserGuide/USER_Events.html#RDS-EVENT-0042
--
If you wish to stop receiving notifications from this topic, please click or visit the link below to unsubscribe:
some-long-url
Please do not reply directly to this e-mail. If you have any questions or comments regarding this email, please contact us at https://aws.amazon.com/support
Conclusion
We have now seen a few ways to monitor RDS SQL Server instances. While it may be tempting to create all different types of alarms for different metrics, you may want to start with the simplest and basic ones first. As you experiment, the thresholds you set will depend largely on the business needs. For example, you may not be using provisioned IOPS for any of your instances and you may decide that 90% CPU running for ten minutes is okay.
Also bear in mind that by default CloudWatch isn’t a good choice for historical trend analysis if it goes beyond two weeks. In these cases you should use third-party tools or write your own custom code to capture metrics from RDS and populate a separate database. You can then run your analyses from there.
Finally, make sure RDS-related SNS messages are posted to a separate, dedicated topic, and not a topic that’s already used for other applications or users. That way, only DBAs will be able to subscribe to these messages. This also helps with the security of your RDS instances.
Next Steps
- Test your RDS instances for different metrics. Determine what’s the acceptable level of performance and set CloudWatch thresholds accordingly.
- Check with your system administrators to see if Billing Alerts are enabled and who gets those alerts. RDS instances can prove to be quite expensive and you would want to ensure Finance people are sufficiently warned when overall spending crosses a certain limit. As a DBA, you don’t want your database instances to cost more than they need to.
- Create alarms and thresholds for idle instances. Often the development team will finish working on a project and the instance will just sit there idle. You would want to delete those instances once they are no longer needed. Use the NetworkReceiveThroughput, NetworkTransmitThroughput, DatabaseConnections metrics to capture information about these types of instances.
- Check out the earlier tips in this series:

Sadequl Hussain lives in Sydney, Australia and holds a Bachelor’s degree in Electrical Engineering. His more than 15 years’ experience in IT has seen him in various roles including training, technical writing, web application development and database administration. Sadequl has been working with SQL Server since version 6.5 and his life as a DBA has seen him managing mission critical database systems for various large companies. He is also an Oracle DBA and an avid Linux administrator. Over the years Sadequl has achieved various certifications including those from Microsoft, CompTIA and ITIL. He is currently having fun preparing for other ones from Amazon and the Open Group. He regularly contributes to various SQL Server and Linux online publications. Apart from spending time with his wife and daughter, he loves his part-time career as a photographer and film-maker and also loves to travel.
- MSSQLTips Awards: Trendsetter (25+ tips) – 2017


