By: Fikrat Azizov | Comments (2) | Related: > SQL Server 2016
Problem
I am looking to improve the performance of my company's data warehouse and thought it could greatly benefit from the new performance feature introduced with SQL Server 2012 - columnstore indexes. According to Microsoft, this new type of index can bring up 10x performance improvement to certain queries and is recommended for large data warehouse solutions.
Columnstore indexes are best suited for queries doing aggregations on large fact tables which would typically require table/index scans involving the entire table or the majority of its rows. Microsoft also says some queries targeting a narrow data range may still perform better with traditional B-Tree indexes than columnstore indexes. That means the decision on columnstore index migration should be based on query workload. Having a migration tool (just like the In Memory OLTP adviser) which could recommend tables best suited for columnstore index migration would be really great, unfortunately Microsoft didn't provide such tool in any of SQL Server versions between 2012-2016, which makes this migration challenging.
Solution
In this tip I'll show you one approach to identify columnstore index candidates using a custom Query Store tool and a simple SSRS report.
SQL Server Columnstore Index Overview
Columnstore index technology is based on a few basic factors:
-
Data inside a columnstore index is stored on a per-column basis, rather a than per-row basis (which is specific to traditional B-Tree indexes). This new storage mechanism allows column pages to be read independently from columnstore indexes, which is a big advantage considering a typical query doesn't need all columns from an underlying index.
-
Data is stored in a compressed form, which allows queries to use significantly less I/O operations as compared to traditional B-Tree indexes, thus resulting in better performance.
-
Advanced query execution technology processes chunks of columns called batches in a streamlined manner, which can lead to 7X to 40X less CPU consumption compared to the older, row-based query execution methods.
-
Columnstore indexes could be clustered or non-clustered. Unfortunately non-clustered columnstore indexes are non-updateable with SQL Server 2012 and 2014, which makes it a less attractive option, although there're some ways to bypass this limitation. SQL Server 2014 has introduced updateable clustered columnstore indexes alongside non-clustered columnstore indexes, however clustered columnstore indexes can't have any other indexes on top of them. SQL Server 2016 removes these limitations and allows various combinations of columnstore and B-Tree indexes. The bottom-line is, with SQL Server 2012 and 2014 you can't have both columnstore and B-Tree indexes on the same table, unless you're ready to consider complications related to non-updateable indexes. My focus in this tip will be identifying tables which will most likely benefit from migrating to a clustered columnstore index.
-
With a columnstore index SQL Server always scans the entire index, which is why queries reading a small number of rows from B-Tree indexes may perform better. I've experimented with various size data sets and as you can see from this tip and based on my findings, columnstore indexes perform better when queries read more than 50% of the rows for the table. Although this threshold may vary depending on table size and query design, I think it's safe to assume that queries reading less than 30% of the entire data set may perform better with B-tree indexes.
How to measure SQL Server index scan statistics?
So, how do I know which tables would benefit from migration to columnstore indexes? Your tables need to match the following criteria to be considered good candidates for migration:
- Table size - Your table should contain more than a million rows
- Index scan range - The majority of your queries should do full or large range (more than 30% of the entire data set) scans on indexes based on the table.
While measuring table size is quite simple, measuring index scan stats may require some tools. I'm sure most of you have queries which could download execution plans from the SQL cache and extract seek/scan statistics from there, however because SQL cleans its cache from time to time (particularly after each restart) your data would not be comprehensive. The best approach would be collecting query stats during extended periods, storing it in a database and analyzing it using some queries or reports. The custom solution I've described earlier would allow you collect performance statistics alongside execution plans and analyze the data on a remote server without impacting production servers. This is what I will use for the purpose of this analysis. As you may know, SQL Server may use different execution plans for the same query at different times and these plans could significantly differ, depending on initial parameters used for creating those plans and therefore collecting execution plans for an extended period (say several weeks) would make sure you have different plan variations. Once you have a representative query plan store, you could use some queries to dig into index usage statistics and display them using custom SSRS reports.
Migration criteria
In a typical data warehouse scenario each table would host multiple indexes and each index may be used by a number of different queries. As you can imagine, the ideal columnstore index migration table candidate would have at least a 50% scan rate for all queries using indexes on that table. However, if some of your table is being involved in both large scale scanning as well as narrow selection, then you'd need to weigh whether or not performance of narrow selection queries could be sacrificed. So, in order to make the migration decision we need to see minimum scan rates for each table, as well as queries and their scan rates based on those tables. The report I'll describe later provides that information.
Solution deployment
Here are steps required to deploy this solution:
- Use this link to deploy query stats collection tool. This solution also allows creating a centralized query store, however if your purpose is just to collect statistics from a single server, you could deploy it locally.
- Download the deployment package from here, unzip it and execute the CollectRowStats.sql script to create code to collect table row counts from your database. Once the solution is deployed, allow the performance data collection for several weeks and migrate the PerfStats database into the reporting server where we can run XML parsing queries and reports.
- Execute following commands on reporting server to enable XML indexes:
USE [PerfStats]
GO
ALTER INDEX [PXML_QueryPlans] ON [dbo].[QueryPlans] REBUILD
ALTER INDEX [IXML_QueryPlans_Path] ON [dbo].[QueryPlans] REBUILD
ALTER INDEX [IXML_QueryPlans_Value] ON [dbo].[QueryPlans] REBUILD
GO
- Run the below script to deploy the GetIndexScanStats stored procedure on the PerfStats database. This procedure looks into XML plans stored in the query store and extracts index scan statistics based on tables specified as the input parameter and will serve as a data source for the SSRS report.
USE PerfStats
GO
CREATE PROCEDURE [dbo].[GetIndexScanStats]
@DbName VARCHAR(128),
@TableName VARCHAR(max),
@MinScanPct int=0,
@MinSubtreeCost int=0
AS
DECLARE @vDbName AS NVARCHAR(128) =QUOTENAME(@DbName)
;WITH XMLNAMESPACES
(DEFAULT 'http://schemas.microsoft.com/sqlserver/2004/07/showplan')
,QueryStatsCTE AS (
SELECT
qp.SqlInstanceName,
obj.value('(@Database)[1]', 'varchar(128)') AS DbName,
obj.value('(@Schema)[1]', 'varchar(128)') AS SchemaName,
obj.value('(@Table)[1]', 'varchar(128)') AS TableName,
obj.value('(@Index)[1]', 'varchar(128)') AS IndexName,
idx.value('(@PhysicalOp)[1]', 'varchar(50)') AS Operator,
stmt.value('(@StatementSubTreeCost)[1]', 'decimal(10,2)') AS SubtreeCost,
stmt.value('(@QueryHash)[1]', 'varchar(128)') AS QueryHash,
stmt.value('(@StatementText)[1]', 'varchar(128)') AS QueryTxt,
cast(idx.value('(@EstimateRows)[1]','varchar(24)') as real) as SeekRowCnt
FROM QueryPlans AS qp
CROSS APPLY qp.queryplan.nodes('//Statements/StmtSimple') AS Stmts(stmt)
CROSS APPLY stmt.nodes('.//RelOp[contains(@PhysicalOp,"Index") or contains(@PhysicalOp,"Lookup")]') AS vidx(idx)
CROSS APPLY idx.nodes('.//Object[@Database=sql:variable("@vDbName") and contains(sql:variable("@TableName"),@Table)]') AS vObj(obj)
)
SELECT QS.SqlInstanceName, QS.DbName,QS.SchemaName,QS.TableName,QS.QueryTxt,
QS.IndexName,QS.Operator, QS.SeekRowCnt,RS.RowCnt As TotalRows, QS.QueryHash
,ROUND(QS.SeekRowCnt*100/RS.RowCnt,1) AS pct_ScannedToTotal,QS.SubtreeCost FROM QueryStatsCTE QS
LEFT JOIN TableRowStats RS ON QS.DbName=QUOTENAME(RS.[DbName]) AND
QS.TableName=QUOTENAME(RS.TableName)
AND QS.SeekRowCnt*100/RS.RowCnt>=@MinScanPct AND QS.SubtreeCost >=@MinSubtreeCost
GO- Deployment package contains two report files listed below:
- The columnstore index analysis report.rdl report is the main report
- The performance stats analysis-details.rdl is the detailed report (child report)
- Upload both rdl files to SQL Server Reporting Services server and create the data source, as described in the 'Deployment' section of this tip.
Report description
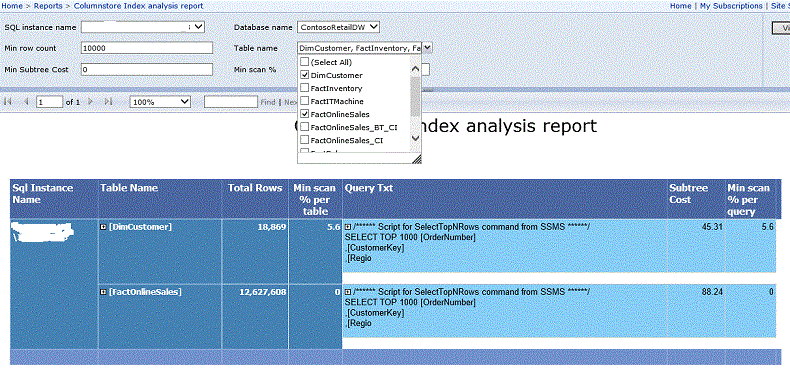
Columnstore Index analysis report has the following parameters:
- SQL Instance name (mandatory)
- Database name (mandatory)
- Min row count (mandatory) - Minimum table row count, this parameter will influence the 'Table name' parameter below.
- Table name (mandatory) - List of tables to be analyzed, based on Min row count parameter. Multiple tables could be chosen.
- Min subtree cost (optional) - You can use this filter if you want to display only queries with a subtree cost exceeding a certain threshold.
- Min scan % (optional) - Will display only queries with an index scan rate exceeding this value.
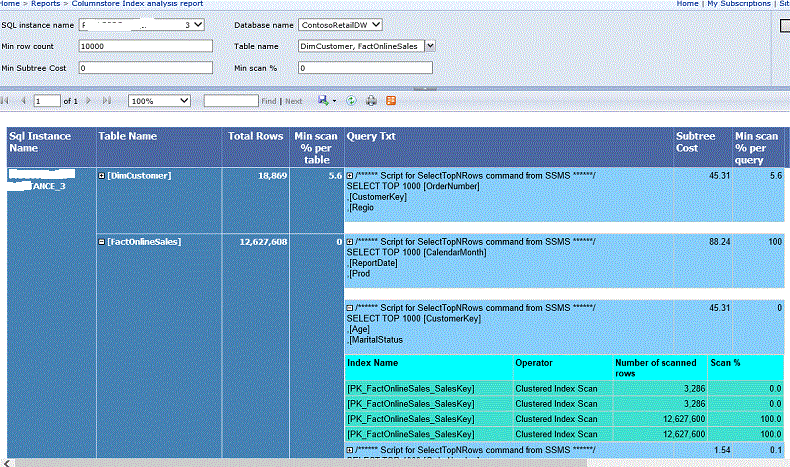
As you can see from the below screenshot, the report will display the minimum scan rate, as well as row count for each selected table:

As discussed above, the minimum scan rate per table value is important for deciding whether or not the table is a potential good fit. Tables with a scan rate above 50% are likely to benefit from migration to a Columnstore Index. By expanding the table name you can see lists of queries using each table alongside with their execution cost and minimum scan rate information. You can further expand each query to see details on which indexes have been used in their execution plans, execution operator, number of scanned rows and scan rate.

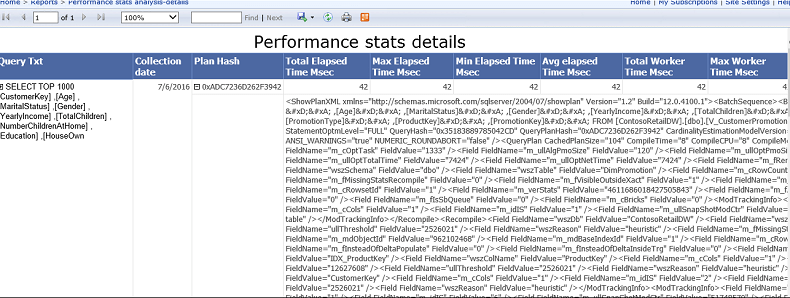
If you click on the query text it will open a linked report called 'Performance stats analysis-details' report, which provides information on query performance stats like max/avg duration, max/avg logical reads, execution plan XML, etc. See this tip for a full description and see the sample screenshot below:

Comparing performance results
Comparing performance results from multiple queries is another challenge, because in many cases the same table could be part of dozens of different queries and hopefully the solution described in this tip alleviates this task as well. It's based on the same collection tool, all you need to do is deploy a few reports, collect query performance stats before/after index changes and compare the results.
Next Steps
About the author
 Fikrat Azizov has been working with SQL Server since 2002 and has earned two MCSE certifications. He’s currently working as a Solutions Architect at Slalom Canada.
This author pledges the content of this article is based on professional experience and not AI generated.
View all my tips


