By: Fikrat Azizov | Comments | Related: > Performance Tuning
Problem
As part of a performance optimization project for one of my customers, I changed multiple indexes and wanted to assess the performance improvement from these changes. The problem was that each index had been used by a number of different queries and identifying those queries, as well as measuring their key performance metrics before/after the index changes required a lot of manual work. As you may know, the SQL 2016 Query Store feature makes this task much easier, however what do you do if your SQL Server version is earlier than 2016? In this tip I'll show how you can automate this task using custom performance collection tools and reports.
Solution
Overview and Use Case Scenarios
There are many different scenarios which would require assessing SQL Server query performance changes, like:
- I tuned my existing indexes and want to see improvement rates.
- I removed some of the overlapping indexes and want to measure the performance impact of those changes.
- I want to identify performance trends to understand which queries have degraded or improved.
To come up with definitive answers for these scenarios, the following tasks need to be executed:
Identify SQL Server queries referring to changed tables
You could probably answer this question easily, if your database contains only a few tables and queries, however it becomes challenging if you have tables being referenced by dozens of views, procedures, and ad-hoc queries. You could try to get this information from query plans stored in the SQL cache, however because the cache contains only the latest compiled version of each execution plan, your execution statistics would be incomplete. Another limitation of this approach is that it involves running resource intensive XML parsing queries to extract table names from execution plans, which may impact performance of production servers.
Identify SQL Server performance metrics to be compared
You can use following metrics to measure improvements:
- Query execution cost
- Total, Max, Min or Avg query elapsed time
- Total, Max, Min or Avg query worker (CPU) time
- Total, Max, Min or Avg logical reads or writes
Your approach would depend on the objectives of your query optimization. If your goal was to improve overall query performance, I'd suggest using query execution cost as a comparison metric, because it contains composite measures of memory, CPU and hard disk resource utilization. On the other hand, if you're more interested in reducing duration of your queries, then querying elapsed time related metrics would be more appropriate. Lastly, if you're looking to resolve resource bottlenecks for memory, CPU or hard disk, then metrics from worker time or logical reads or writes would be best.
Identify the tool for comparison
You could use Excel for simple comparison, however that would require lots of manual work to build appropriate comparison formulas. Another approach would be using SSRS reports, which also requires some up front development work. However, as you will see below that work pays off if you're doing lots of comparisons.
The solution described below allows us to address the above items.
How to use a custom query store to measure query improvements?
In one of my earlier tips I described a custom query collection tool. It allows you to collect query execution statistics from multiple production servers, store them in a central repository and build custom reports based on that repository.
Advantages of this approach are:
- This solution allows you to store multiple execution plans and their performance statistics, which in turn allows you to track performance changes for selected queries.
- Performance statistics collected from production servers are replicated to a central server, where you can run resource intensive XML parsing queries to extract valuable information stored in the execution plans without impacting your production servers.
- The collection process is fully automated and has minimal impact on production servers.
- You can create a set of reports/dashboards to analyze performance for queries coming from multiple servers.
I created a collection of SSRS reports, based on the above described solution, which will make the performance comparison task much easier.
Performance Comparison Reports
The performance comparison reports collection consists of two reports - a master report (Performance Stats Analysis) and a child report (Performance Stats Analysis-details) which can only be accessed from the master report. A sample screenshot from the master report is provided below:
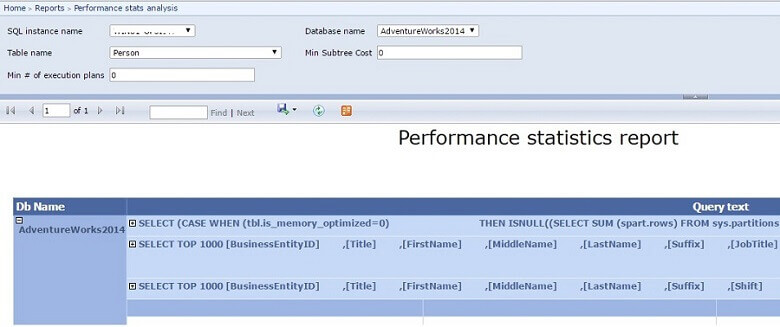
The report requires the following input parameters:
- SQL Instance name - name of SQL server from which queries originated
- Database name - name of database from which queries originated
- Table name - to filter queries based on specified table
- Min Subtree Cost - this filter could be used to identify expensive queries with the cost exceeding the specified value
- Min # of execution plans - this filter could be used to identify queries having multiple execution plans. You may want to supply a value above zero for this parameter to get a list of queries which have changed their execution plans.
Once you get a list of queries based on a certain table, you can drill down into each query's high level execution statistics as shown below:
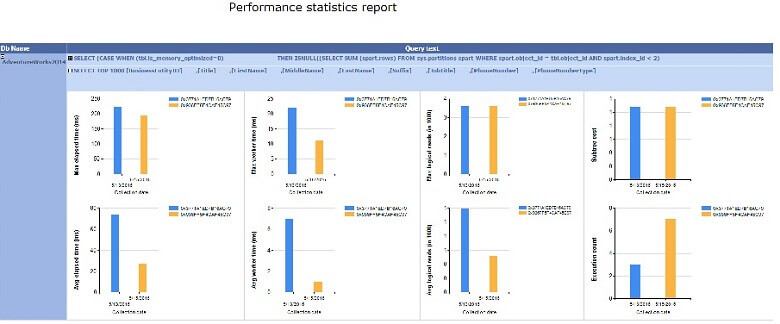
This view allows you to see the number of execution plans collected for this query (each plan is represented with a different color), as well as their relative performance. On this particular example, a quick glance of this view reveals that the second execution plan has resulted in much better performance. I've included the following performance metrics in this view:
- Query execution cost
- Max, Avg query elapsed time
- Max, Avg query worker (CPU) time
- Max, Avg logical reads
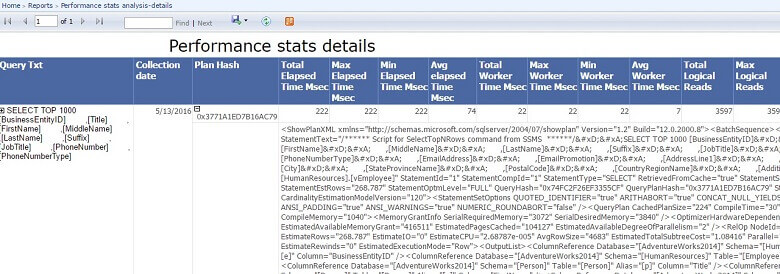
This view is based on a stored procedure, which returns other performance metrics as well and they could easily be embedded into the report if required. This report has drill through action on the query text field and by clicking on the query text you can switch to a detailed table report as shown below.

You can view the XML content of each execution plan by expanding the Plan Hash column, as shown below:
In the next section I'll explain the deployment process for these reports.
Report Deployment
You can follow the below steps to configure the data sources for the reports. The process is to collect the data on each production server and then replicate the data to a Central Server where the analysis and reporting takes place.
Before getting started, review my previous article for more details of this Central Server configuration and data collection process. This will need to be in place first, prior to adding the additional functionality listed below.
1 - Execute the following script on each production server where you want to collect data. This will collect table row stats.
USE [PerfStats]
GO

CREATE TABLE [dbo].[TableRowStats](
[RecID] [int] IDENTITY(1,1) NOT NULL,
[SQLInstanceName] [varchar](200) NULL,
[DbName] [varchar](100) NULL,
[TableName] [varchar](100) NULL,
[ObjId] [bigint] NULL,
[IndId] [int] NULL,
[IndName] [varchar](200) NULL,
[RowCnt] [bigint] NULL,
[DateInserted] [datetime] NULL CONSTRAINT [DF_IndexRowStats_DateInserted] DEFAULT (getdate()),
CONSTRAINT [PK_IndexRowStats] PRIMARY KEY CLUSTERED ([RecID] ASC))
GO

CREATE PROCEDURE [dbo].[GetRowCounts]
@MinRows int=1,
@vDbName varchar(200)
AS
IF EXISTS (Select 1 FROM tempdb.sys.objects where name='##IndList')
 DROP TABLE ##IndList
Declare @SqlStr varchar(max)=N'
SELECT SO.Name as TableName,SI.id as ObjId,indid,SI.name as IndName ,rowcnt
 INTO ##IndList
 FROM '+@vDbName +'.sys.sysindexes (nolock) SI
  JOIN '+@vDbName +'.sys.sysobjects (nolock) SO ON SI.id=So.id
  WHERE SO.TYPE =''U'' AND Indid <2 and rowcnt >'+RTRIM(STR(@MinRows))
EXEC (@SqlStr)
MERGE TableRowStats RS
USING ##IndList I ON RS.SQLInstanceName=@@SERVERNAME AND RS.DbName=@vDbName
 AND RS.ObjId=I.ObjId AND RS.IndId=I.Indid
 WHEN MATCHED THEN
UPDATE Set RS.RowCnt=I.RowCnt
WHEN NOT MATCHED THEN
INSERT (SQLInstanceName,DbName,TableName,ObjId,IndId,IndName,RowCnt)
VALUES(@@SERVERNAME,@vDbName,I.TableName,I.ObjId,I.IndId,I.IndName,I.RowCnt);
GO;

/*
CollectPerfStats - shell procedure to trigger performance collection procedures
Author:Fikrat Azizov
Date:April, 2016
*/
ALTER PROCEDURE [dbo].[CollectPerfStats]
@DbList varchar(200),
@GetQueryStats bit=1,
@TopN int,
@OrderBy varchar(200) ='TotalElapsedTime_MSec',
@FilterStr varchar(max) =NULL,
@CollectStatsInfo bit=0,
@GetWaitStats bit=0
AS
IF @GetQueryStats=1
 EXEC [CollectQueryStats] @vTopNRows=@TopN,@vDbList=@DbList,@vOrderBy=@OrderBy,@vFilterStr=@FilterStr,@vCollectStatsInfo=@CollectStatsInfo;
IF @GetWaitStats=1 exec GetWaitStats 10,5;
EXEC [dbo].[GetRowCounts] 1,@DbList;
GO
2 - Add the new table TableRowStats to a publication to allow data replication to the central server. You will need to do this for each server where you are collecting data. You can read more about adding new tables to replication here.
3 - On the central server, execute the following script to create a stored procedure which will serve as a data source for the new reports:
USE [PerfStats]
GO

CREATE PROCEDURE GetQueryStatsByDBTable
@DbName varchar(200),
@TableName varchar(200),
@MinSubtreeCost decimal (10,2)=0,
@MinPlans int=1
AS
DECLARE @vTableName AS NVARCHAR(200) =QUOTENAME(@TableName)
;WITH XMLNAMESPACES
(DEFAULT 'http://schemas.microsoft.com/sqlserver/2004/07/showplan')
,QueryStatsCTE As (
SELECT [SQLInstanceName]
,[DbName]
,Left([ParentQueryTxt],200) as ParentQueryTxt
,LEFT([QueryTxt],200) as QueryTxt
,[TotalElapsedTime_Msec]
,[MaxElapsedTime_Msec]
,[MinElapsedTime_Msec]
,[Avg_elapsedTime_Msec]
,[TotalWorkerTime_Msec]
,[MaxWorkerTime_Msec]
,[MinWorkerTime_Msec]
,[Avg_WorkerTime_Msec]
,[TotalLogicalReads]
,[MaxLogicalReads]
,[MinLogicalReads]
,[Avg_Logical_Reads]
,[ExecutionCount]
,[QueryHash]
,[PlanHash]
,cast(CollectionDateTime as date) as CollectionDateTime
,stmt.value('(@StatementSubTreeCost)[1]', 'decimal(10,2)') AS SubtreeCost
FROM [dbo].[vQueryStats_Plans] (NOLOCK) cp
CROSS APPLY cp.queryplan.nodes('//ShowPlanXML/BatchSequence/Batch/Statements/StmtSimple[@QueryHash=sql:column("QueryHash")]') AS batch(stmt)
CROSS APPLY stmt.nodes('//Object[@Table=sql:variable("@vTableName")]') AS vObj(obj)
WHERE DbName=@DbName AND QueryHash IN (Select QueryHash FROM [dbo].vQueryStats_Plans
GROUP BY QueryHash HAVING COUNT(1)>=@MinPlans)
)
SELECT * from QueryStatsCTE QS Where SubtreeCost >=@MinSubtreeCost ORDER BY SubtreeCost Desc ;
GO
4 - On the central server execute the following script to enable XML indexes on the QueryPlan table:
USE [PerfStats]
GO

ALTER INDEX [PXML_QueryPlans] ON [dbo].[QueryPlans] REBUILD
ALTER INDEX [IXML_QueryPlans_Path] ON [dbo].[QueryPlans] REBUILD
ALTER INDEX [IXML_QueryPlans_Value] ON [dbo].[QueryPlans] REBUILD
GO
Please note-while these indexes will improve performance of our reports, enabling them on the central server will not cause them to be enabled on the production servers, due to configuration filters on related articles.
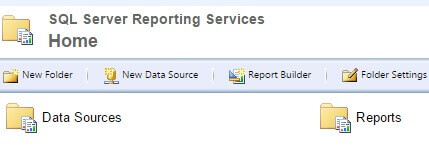
5 - On the central server's report server, create folders Data Sources and Reports as shown below:
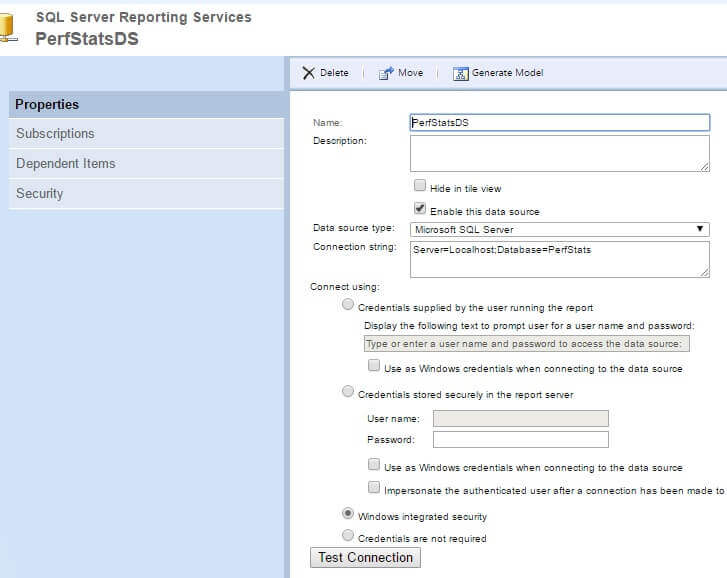
6 - On the central server, create data source PerfStatsDS inside the folder Data Sources with the following settings:
7 - Download the zipped reports package from here. Unzip it and upload the reports 'Performance stats analysis.rdl' and 'Performance stats analysis-details.rdl' into folder Reports.
Check the checkbox Hide in tile view for report 'Performance stats analysis-details' to hide it from users. This report should be accessed only from the master report (Performance stats analysis).
Using the custom reports to measure performance changes
To measure performance changes, you need to run the job CollectQueryPerfStats (see this tip for details) on your production server after queries/reports have been executed that you're interested in analyzing. Make the necessary changes to the queries/reports and run the same job again to collect new execution plans. Make sure the data is replicated to the central server and then run the comparison reports to measure improvements.
Conclusion
Performance tuning is a creative process which requires a lot of attention and manual work. However, with the right tools on hand you can reduce manual work efforts related to measurements of results and focus on the tuning process.
Next Steps
- Read more about designing SSRS reports from these resources:
- Check out the following SQL Server Performance Tuning resources:
- Read the first tip in this series: Creating a Centralized Performance Collection Solution for SQL Server
About the author
 Fikrat Azizov has been working with SQL Server since 2002 and has earned two MCSE certifications. He’s currently working as a Solutions Architect at Slalom Canada.
This author pledges the content of this article is based on professional experience and not AI generated.
View all my tips


