Problem
You are a SQL Server DBA and you are new to Linux. You know that Microsoft has decided to expand SQL Server to Linux servers and you need to know how to check for network latency and I/O. In this tip I will show you some tools that will help you.
Solution
When it comes to networking, Linux had an historical advantage over Windows until the release of Windows XP. For this reason Windows has more tools and more advanced features to monitor network usage, so in this tip we will show you commands you can use on Linux.
netstat
This command is well known for all Windows users. Its name is a short for network statistics and that is what this command does. The usage is almost identical to Windows, but on Linux this command gives more information. Now I will show you a few netstat invocations that you may probably use more.
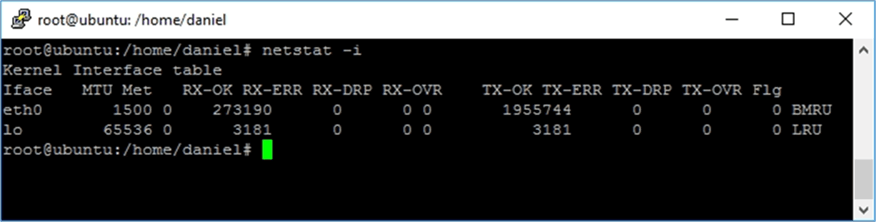
netstat -i
The -i argument lists the network interfaces. With this command you can see the interface name and the packets sent and received correctly (TX-OK, RX-OK), the number of packets rejected by checksum error (TX-ERR, RX-ERR), the packets dropped due to a full buffer (TX-DRP, RX-DRP) and the packets dropped because the system was too busy (TX-OVR, RX-OVR).
netstat -ltu
The parameters -ltu displays the listening (l) ports, both TCP (t) and UDP (u). If you only use the -l argument it will also show the list of active UNIX domain sockets which is the way Linux uses to communicate between processes.

Additionally, if you add the -p argument (netstat -ltup) it will show which program is listening.
slurm
Slurm is a terminal based network monitoring tool. This utility doesn’t come with the standard distribution, so you will have to install it from the repositories with the following command. Remember to use sudo if you are not running as root.
apt-get install slurm
The usage of this tool is very easy; you just need to pass as an argument the interface name you want to monitor. For example, if you want to monitor the eth0 interface you have to execute the following.
slurm -i eth0

As you can see on the above image, this utility consists of an upper panel with a graph displaying network activity and a lower panel with the information as text.
speedometer
This is a graphic network monitoring tool whose graphics are much easier to understand than those of slurm. In order to install this tool you must execute the following sentence.
apt-get install speedometer
When you use speedometer you have to pass as arguments the network interface you want to monitor as usual with any network monitoring tool, but this utility allows you to monitor multiple interfaces at the same time. Here is how it works: for example, if you want to monitor transmission and reception speed on the interface eth0 you should execute the following command.
speedometer -tx eth0 -rx eth0
Additionally, if you want to monitor transmission and reception speed on the interfaces eth0 and eth1 the command to execute is the one below.
Speedometer -tx eth0 -rx eth0 -tx eth1 -rx eth1
On the following screen capture you can appreciate that the utility draws one histogram for every -tx or -rx argument adjusting its scale independently of each other.

ifstat
This is a network monitoring tool with a very basic interface, what makes it a good choice if you need to process or format the raw data in other application. To install this tool just execute the following code in your shell as root, or add sudo at the start of the command.
apt-get install ifstat
On the next screen capture you can see the execution of ifstat.

nethogs
Whenever you need to see the network usage by application the nethogs utility will do the job. This program resembles to the Linux top utility, but instead of showing CPU usage by application it shows the network usage.

As you can see on the previous image, this utility shows a grid sorted by network usage. It shows the process identifier, the user running the program that is using the network, the program path, the network interface being used by that program and the send and receive speed expressed in kilobytes per second.
Something to note is that this utility requires to be executed as root. To install this program just execute the following code on a shell.
apt-get install nethogs
Next Steps
- In the following tip you will get an insight about SQL Server on Linux: Getting Started with SQL Server on Linux.
- If you need help to find out CPU consumption on Linux, take a look at my previous tip on this series of articles about Linux administration for SQL Server DBA’s: Linux Administration for SQL Server DBA’s: Checking CPU Usage.
- Take a look at my previous tip about Linux administration for SQL Server DBA’s: Linux Administration for SQL Server DBA’s Checking Disk IO.
- Read my previous tip about checking disk space on Linux: Linux Administration for SQL Server DBA’s: Checking Disk Space.
- Check out more SQL Server 2016 tips.
- Stay tuned for more SQL Server on Linux Tips.

Daniel Farina was born in Buenos Aires, Argentina. Self-educated, since childhood he showed a passion for learning. He studied at Universidad de Buenos Aires. Daniel started working as a programmer at a young age. Over the years he specialized in databases, particularly SQL Server and Oracle. Now with 30 years of age, his work experience includes working with various technologies like VB, C, .NET, web development, Windows and Linux systems. He likes to read about science, psychology, philosophy and many other things. In his spare time, he trains powerlifting aiming to compete.
- MSSQLTips Awards: Author of the Year – 2018 | Champion (100+ tips) – 2018 | Author Contender – 2015-2017, 2019
