By: Ahmad Yaseen | Comments | Related: > Performance Tuning
Problem
When you execute a T-SQL query, it takes CPU time to process the query and retrieve the requested data, especially on busy systems with a large number of concurrent queries that share the same resources. SQL Server stores such information about query wait time and wait resources to help troubleshoot the query performance and track resource bottlenecks. Getting wait statistics information about a specific query is not very simple and requires strong T-SQL coding skills. But with SQL Server 2016 SP1 comes a direct way to get the wait statistics information about a specific query from the query execution plan, which we will discuss in this tip.
Solution
SQL Server Wait Statistics are one of the most important and common performance tuning metrics that can be used to track and troubleshoot query performance by identifying resource bottlenecks the query is waiting for. There are two main categories for the SQL Server Wait Statistics; the Single Wait type, where the query is waiting for CPU resource availability and the Resource Wait type, where the query is waiting for a specific resource availability, such as I/O or Memory resources.
The Wait Statistics information, such as the wait type, the wait duration and the wait count are recorded by the SQL Server Engine to help in tracking performance issues. The wait statistics information about an actively running query can be retrieved by joining different system DMVs such as sys.dm_os_waiting_tasks and sys.dm_os_wait_stats DMVs, in addition to the current state of the running queries. But what if I want to get wait statistics information of a specific query only? And what if I am not able to run both my query and the one querying the wait statistics information concurrently?
SQL Server 2016 SP1 comes with a lot of new features and improvements and of these new enhancements is to query execution plans, in which you can see the wait statistics information of the query inside the actual execution plan of that query, making the execution plans rich with extra valuable information.
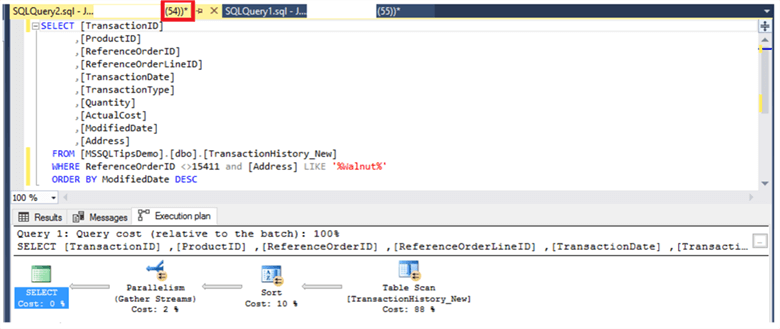
Let's say we want to troubleshoot the below query that runs very frequently in our system, but recently it is running slower than usual. We will enable the Actual Execution Plan for the query before executing it, in order to trace the performance.
SELECT [TransactionID]
      ,[ProductID]
      ,[ReferenceOrderID]
      ,[ReferenceOrderLineID]
      ,[TransactionDate]
      ,[TransactionType]
      ,[Quantity]
      ,[ActualCost]
      ,[ModifiedDate]
      ,[Address]
FROM [MSSQLTipsDemo].[dbo].[TransactionHistory_New]
WHERE ReferenceOrderID <>15411 and [Address] LIKE '%Walnut%'
ORDER BY ModifiedDate DESC
The query is running under session 54, as you can see below:
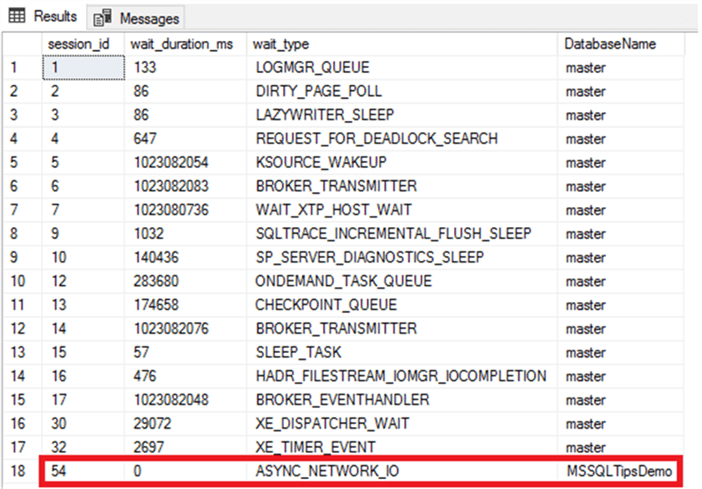
Previous to SQL Server 2016 SP1, to get the wait statistics information about the query, the below script that joins sys.dm_os_waiting_tasks, sys.dm_exec_sessions and sys.dm_exec_requests DMVs can be used:
SELECT OSW.session_id,
       OSW.wait_duration_ms,
       OSW.wait_type,
       DB_NAME(EXR.database_id) AS DatabaseName
FROM sys.dm_os_waiting_tasks OSW
INNER JOIN sys.dm_exec_sessions EXS ON OSW.session_id = EXS.session_id
INNER JOIN Join sys.dm_exec_requests EXR ON EXR.session_id = OSW.session_id
OPTION(Recompile);
From the previous script that returns the wait statistics information about all currently running queries, we can see that session 54 is waiting for “ASYNC_NETWORK_IO” wait type as shown below.
With SQL Server 2016 SP1:
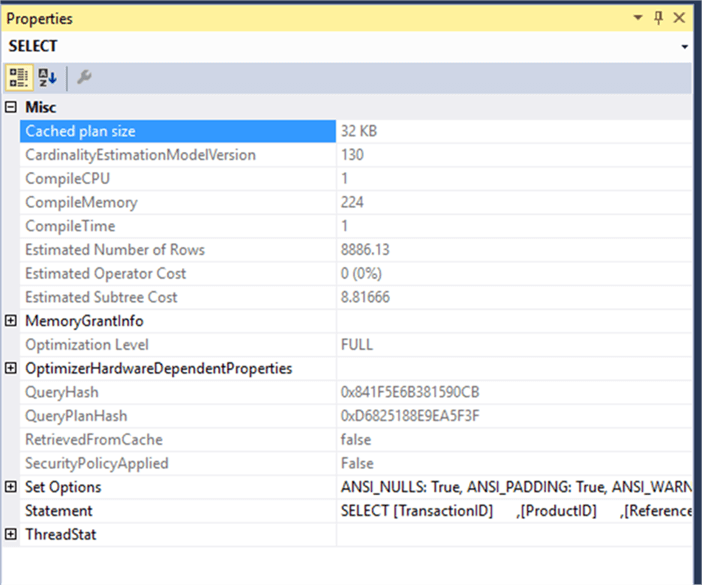
The Wait Statistics information can be viewed from the Actual Execution Plan of the query by right-clicking on the left most operator (the SELECT operator) in the plan to display the operator’s Properties window. The window can be also viewed by choosing the operator then clicking F4. The operator Properties window will be like below:
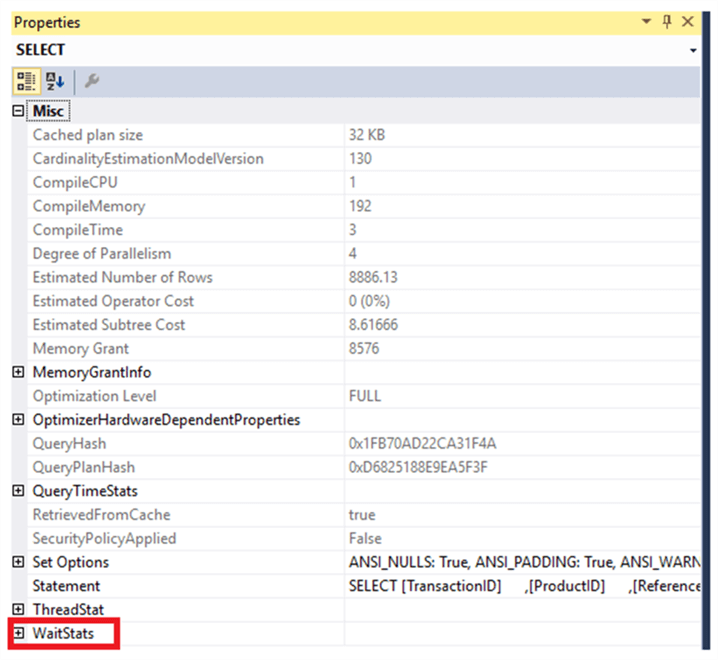
As you can see from the previous image, a new section is added to the operator properties window that lists the Wait Stats information of that query. If you expand the WaitStats section from the properties window, we can see the below information.
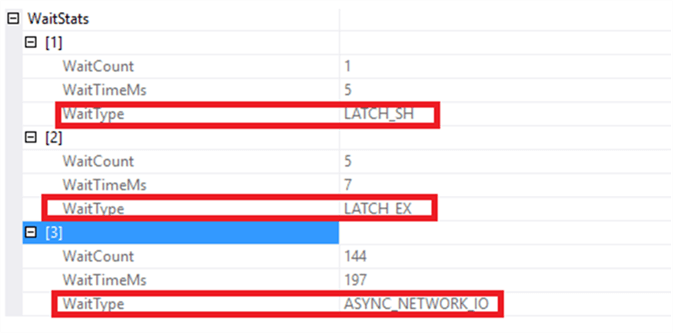
A list of all wait types, that the executed query was waiting for during its execution will be displayed in that new section, with extra information about how many times the query waited for that wait type and the total duration for each wait type.
Comparing the wait statistics information derived from the execution plan with the information derived from querying the DMVs, you will see that the execution plan provided us with full wait statistics details for that specific query, but we were only able to catch the last wait type from the DMVs script.
During its execution, the query was waiting for three wait types: the LATCH_SH, LATCH_EX and ASYNC_NETWORK_IO as shown from the execution plan, not only ASYNC_NETWORK_IO as shown by querying the system DMVs.
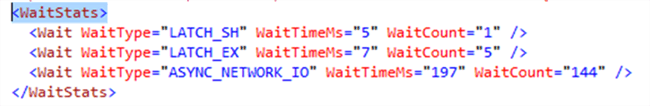
The same wait statistics information can be also viewed easily from the XML execution plan by looking at the new WaitStats section as shown below:
Keep in mind that the wait statistics information can be viewed only from the Actual Execution Plan that is generated after executing the query. If you try to search for the WaitStats information from the Estimated Execution Plan that is generated without executing the query, you will not be able to see the wait stats. This make sense as the SQL Server Engine cannot predicate what the query will be waiting for during its execution. The SELECT operator properties window shown below from the Estimated Execution Plan has no information about the query wait statistics:
Next Steps
- Read more about Getting Per Session Wait Statistics in SQL Server 2016
- Check Graphical Query Plan Tutorial
- Check also Query Execution Plans
- And check How to read SQL Server graphical query execution plans


About the author
 Ahmad Yaseen is a SQL Server DBA with a bachelor’s degree in computer engineering as well as .NET development experience.
This author pledges the content of this article is based on professional experience and not AI generated.
View all my tips
