By: Siddharth Mehta | Comments (2) | Related: > Power BI Charts
Problem
The ever-increasing variety of data and analytics has resulted in an ever-increasing need to build customized visualizations for diverse types of storytelling. D3.js is a JavaScript library for producing dynamic, interactive data visualizations in web browsers. It makes use of the widely implemented SVG, HTML5, and CSS standards. Power BI has a variety of built-in charts. It allows you to create statistical visualizations using R libraries and allows use of visualizations from the Power BI visuals gallery as well. The infographic designer tool lets you create custom infographics as well. The limitation is that all these are fixed controls targeted towards a certain type of chart. There are a variety of custom visualizations that are created and used on web applications. There is often a need to have the same visualization in reports as well. This results in a need to display custom charts created using D3 library in Power BI. In this tip we will learn how to create these charts.
Solution
D3.js Visual is a control that is available in Power BI Visuals Gallery, which can be used to render custom D3 visualizations in Power BI Desktop.
One needs to know D3 programming to develop custom visualizations. In this tip, the intention is to just take the D3.js code and port it to Power BI Desktop to render the visualization. So, we will be focusing on sample D3.js code and will understand how to use this in Power BI Desktop.
There is a gallery that contains a list of unique custom visualizations that can be created with D3.js library. From this gallery, we will use the code of Day/Hour Heatmap chart and create the visualization in Power BI Desktop.

It is assumed that Power BI Desktop is already installed on the development machine. Follow the steps as mentioned below.
Step 1
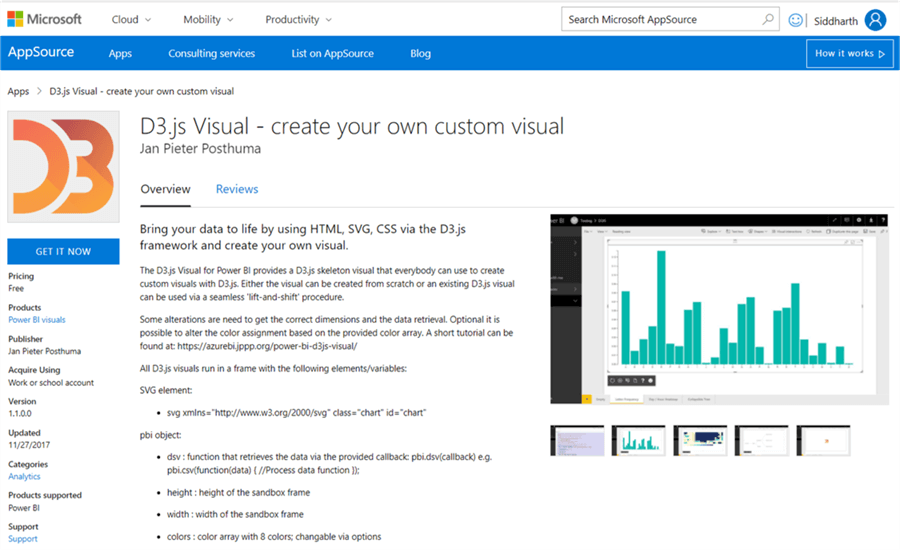
The first step is to download the D3.js Visual control from here, as it is not available by default in Power BI Desktop. It is available in the gallery from a third-party vendor, but free of cost. When you download the control file, you will get an option to download a sample file as well. You can download the sample from here. This file has the working sample code that we will be discussing in this tip.
Step 2
After downloading the control file, open Power BI Desktop. You can click on the ellipsis in the visualization tab and select “Import from file” menu option. This will open a dialog box to select the visualization package file, to add the visualization in Power BI. Select the downloaded file and it should add the D3.js visual to Power BI Desktop visualizations gallery.
Step 3
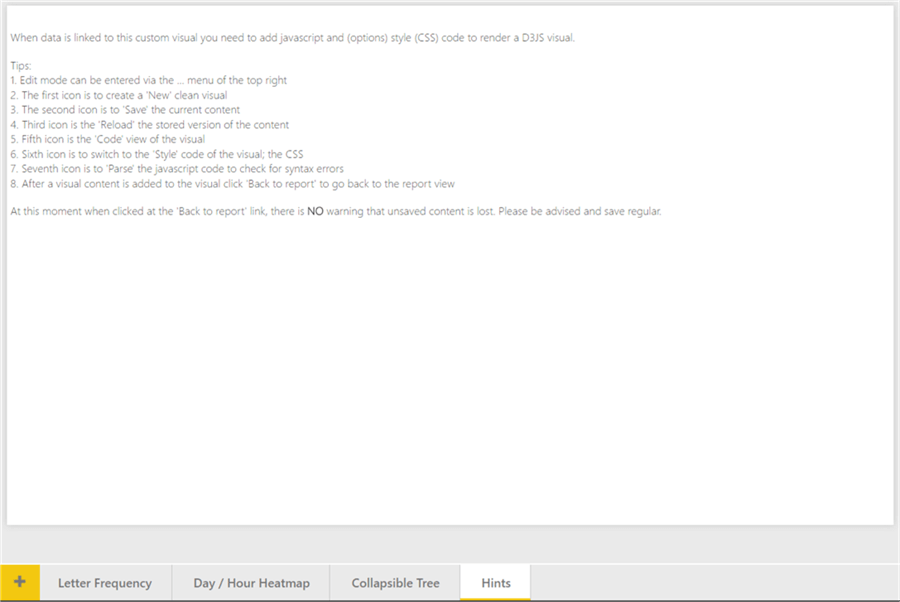
Open the sample Power BI Report file that you would have downloaded in Step 1. In this report file, there are three charts and hints on how to use the control. The hints tab explains the different menu options that are available when you click the ellipsis on the top-right corner of the control. Read this info to get introduced to the working of this control.
Step 4
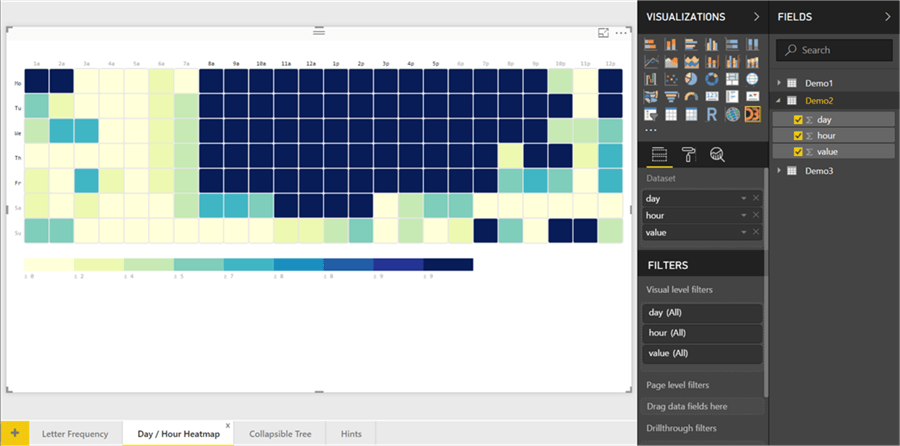
Now click on the Day / Hour visualization and you should be able to find the visualization as shown below. From the fields section, you will find that the fields day, hour and value are used from the control. There are three demo datasets in the report file, and this visualization is using Demo2 dataset.
Step 5
Before we start investigation of the code, consider going through the actual code of this D3 visualization from this link. It’s the same code that has been used in the D3.js visual control, with minor alternations. We will now try to understand the modifications required in general to embed D3.js visuals into Power BI Desktop.
Step 6
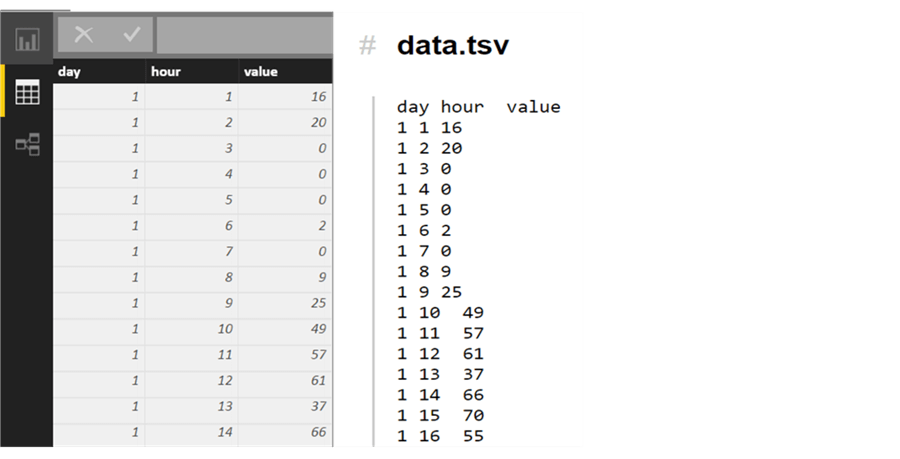
Click on the Data tab on the left, and you would be able to see that the shape of the dataset used in the visual looks as shown below on the left section. If you analyze the code in the actual link provided in Step 5, you will find that the actual code also uses the same shape of the dataset. This is shown below on the right side – “data.tsv”, which is the data file used by the actual code. This means that when you port any D3.js code into the Power BI visual, you would need to ensure that the schema of the dataset fed to the code remains the same by selecting relevant fields.
Step 7
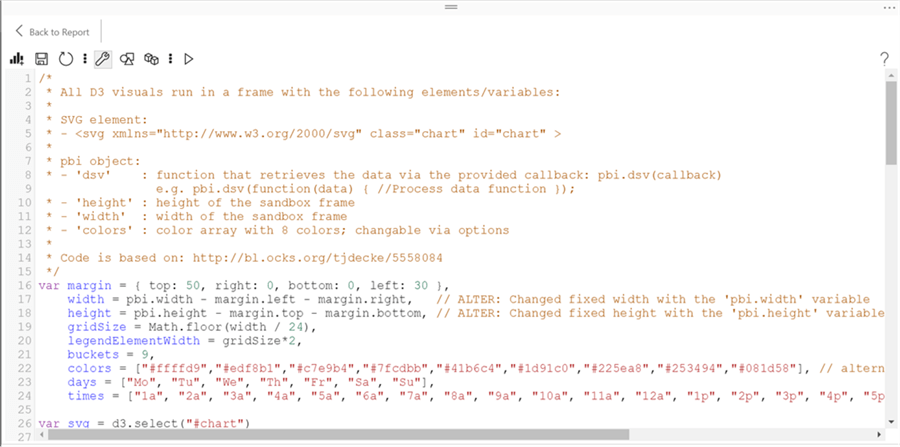
Click on the ellipsis of the control, and you will find an Edit button in the top-right corner of the control. Click on this and that will open the code editor window as shown below. This code mentions the link from where the code is sourced for the visualization and has comments wherever changes are made. “pbi” is an object that is used for all the properties and methods that are used with D3 object in the D3 object model. One who is not well versed with D3 may not understand it in detail. That is okay for those who intend just to port the code, although there would be a dependency on a D3 developer to make fine tuning to the visualization.
Step 8
If you compare this code with the original code in the gallery, it looks as shown below. The D3 code contained in the script tag should be ported to Power BI D3 control in general. The HTML code which acts as a container for the D3 code should not be ported and can be ignored.

Step 9
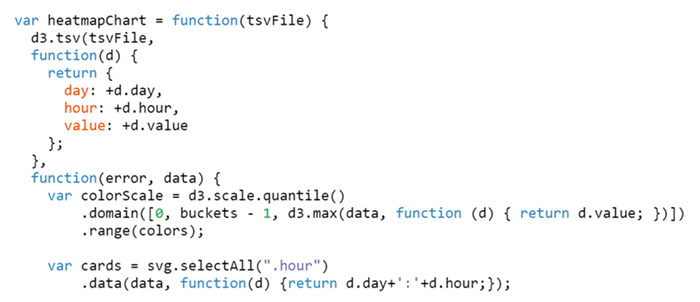
Any instances where a D3 object is used, this should be replaced with pbi object. Generally, D3 objects use the “tsv” or “json” files to source data. In Power BI, the pbi object would use the “data” keyword to refer to the data that would be provided from the fields section of the control.

Step 10
Compare the above step with the below excerpt from the actual code, and you can see the modifications made in the Power BI code from the actual D3 code.
Step 11
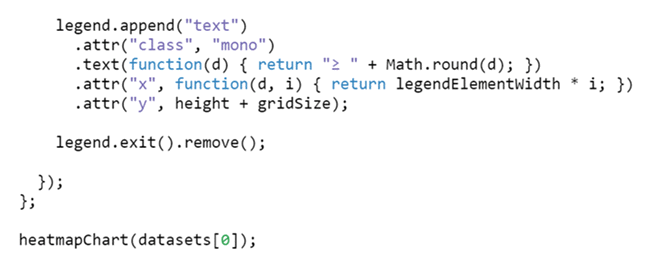
Finally, when the D3 function is ready to render the visualization, a call is made to that function which you can find below in the last line of the code. This part of the code has been modified to remove any references to static datasets.

Step 12
If you analyze the last line of code in the actual D3 code as shown below, and compare it with the last line in the code shown above, you can see the modification made in the code.
Step 13
These are the three main changes that need to be applied on the D3 code that is ported from a web page to Power BI Desktop. To summarize:
- Use pbi object instead of D3 object
- Remove references of static data and make calls to the data as explained above
- Ensure the data is of the same shape as used in the actual code
Step 14
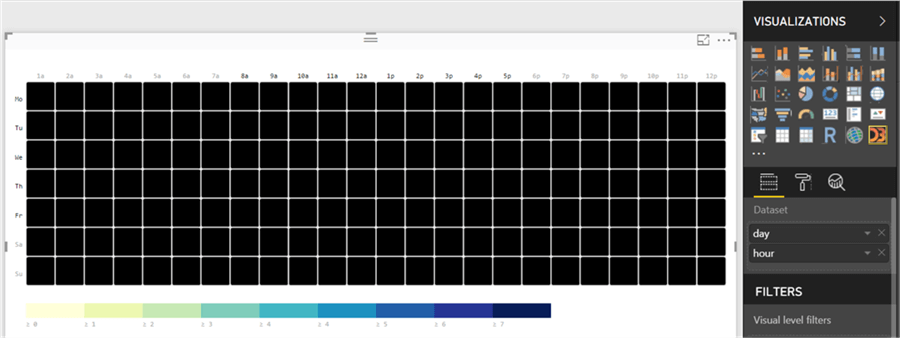
If you remove one of the fields in the visualization, you will find that the visualization is reacting to the changes in data structure as shown below. This means that the visualization is not static like a jpeg / png, and it’s a live / interactive visualization that is rendered from the data fed to it.
In this way, we can render any custom visualizations by using D3.js code in Power BI Desktop by using the D3.js visual control.
Next Steps
- Consider exploring other D3 visualization examples in the sample file provided with this tip, and analyze how to add other types of D3 visualizations in Power BI Desktop.
- Check out other Power BI tips.
Learn more about Power BI in this 3 hour training course.
About the author
 Siddharth Mehta is an Associate Manager with Accenture in the Avanade Division focusing on Business Intelligence.
This author pledges the content of this article is based on professional experience and not AI generated.
View all my tips
