Problem
I want to analyze UK parliamentary petition data using Power BI. How this can be achieved and what are all the things I need to consider?
Solution
UK Petition Data
The UK Parliament allows the general public to raise a petition online and anyone can vote (via signature) in the UK to support the petition. This includes the petition details, number of signatures on the petition and other details are available to download using CSV or in JSON format. In this tip, I will walkthrough a method to consume JSON data and generate a report using Power BI.
This link will allow you to see all the UK parliamentary petitions. This link will supply the petition details in JSON format.
Loading Petition data into Power BI
UK petition data (JSON URL) can be loaded into Power BI using the below steps.
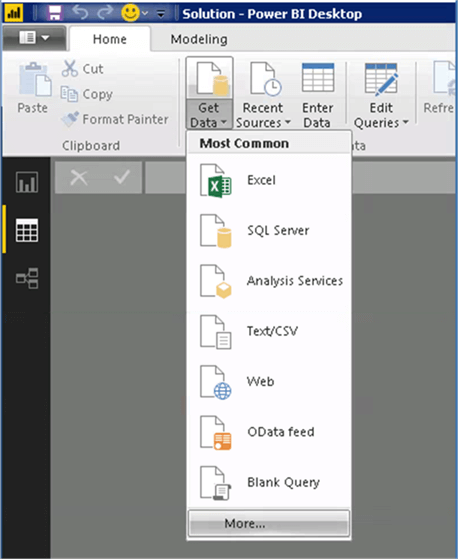
Open the Get Data menu and click on the “More” sub menu to open the next dialog box.
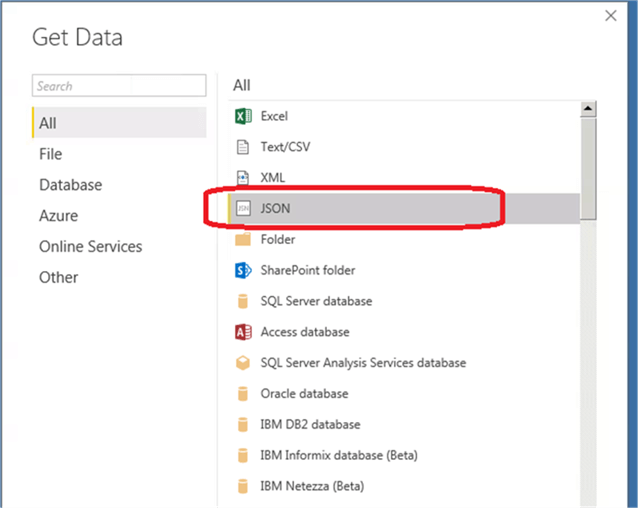
In the detail dialog box, select “JSON” format.
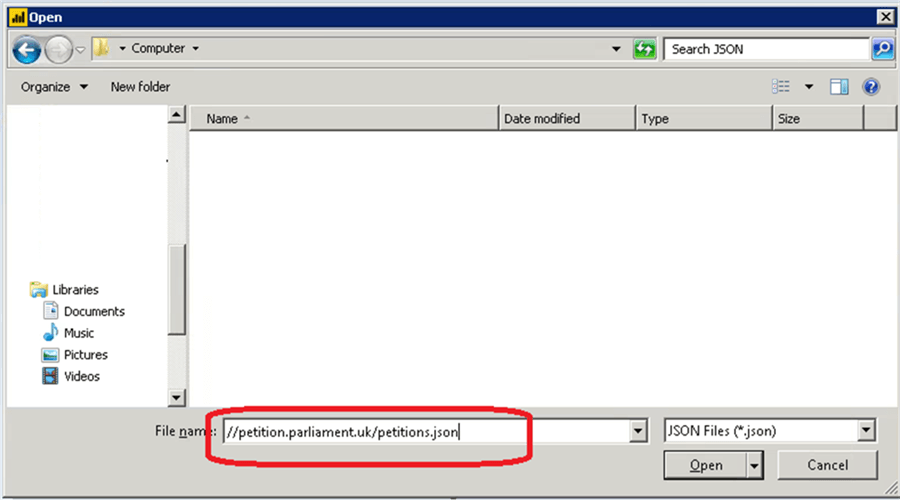
This will open another window for you to select a physical JSON file or to type the URL in the address bar. As we are getting the JSON data from the URL, I have copied the URL in the address bar as shown in the image below.
Once the data gets loaded, you will see the output in the query editor. As you can see, we have to navigate thru the JSON format to get the desired dataset.
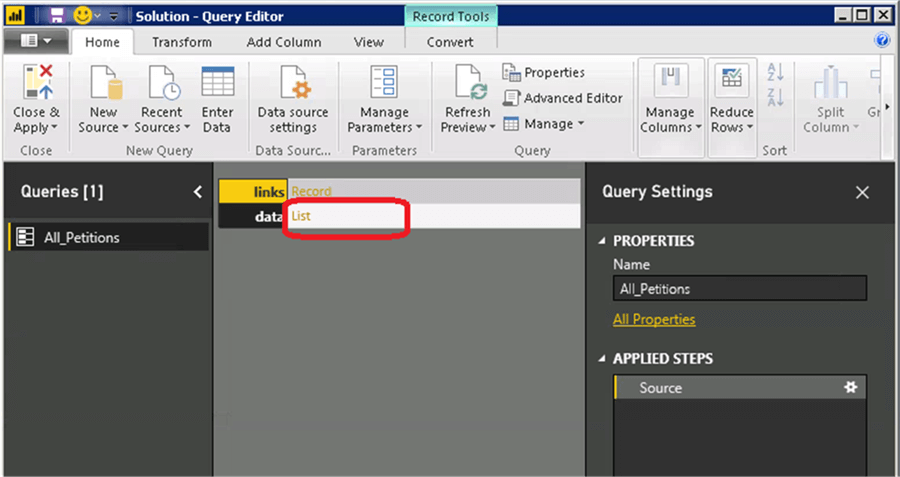
You have to click on the data item (“List”) to navigate further. Once you navigated, you will see all the details of the list item as shown in the below image.
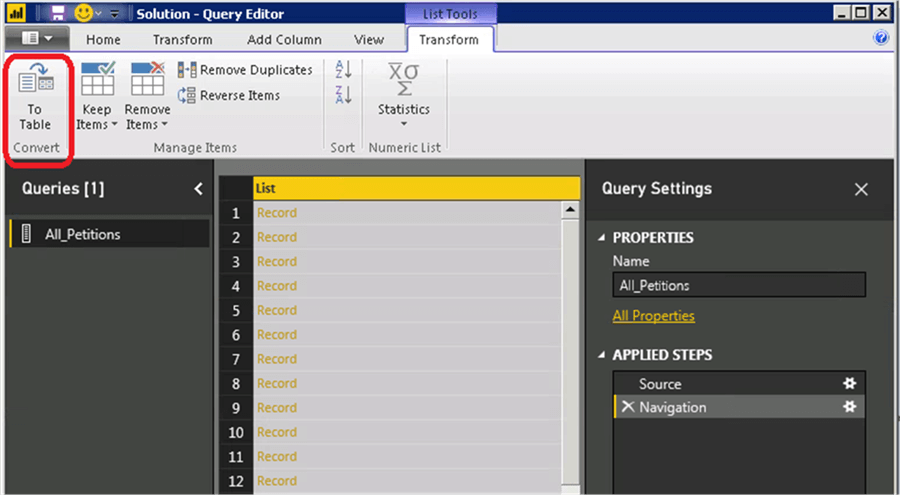
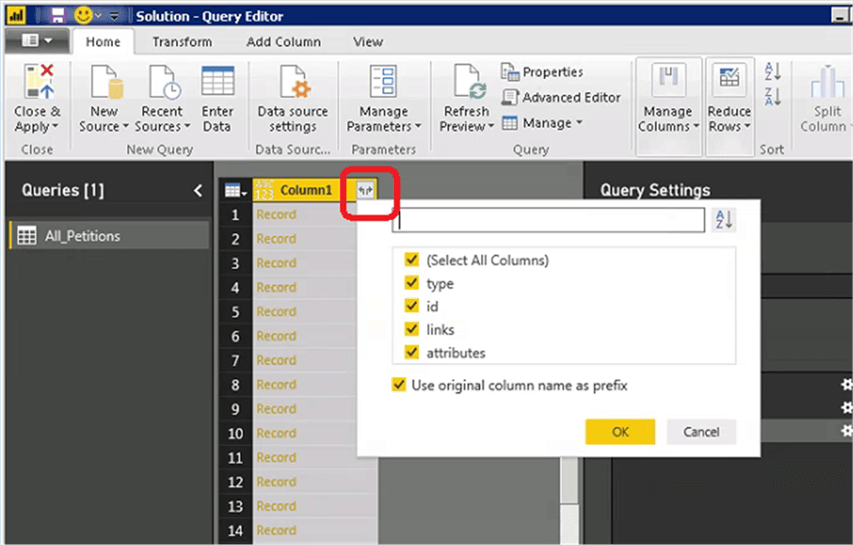
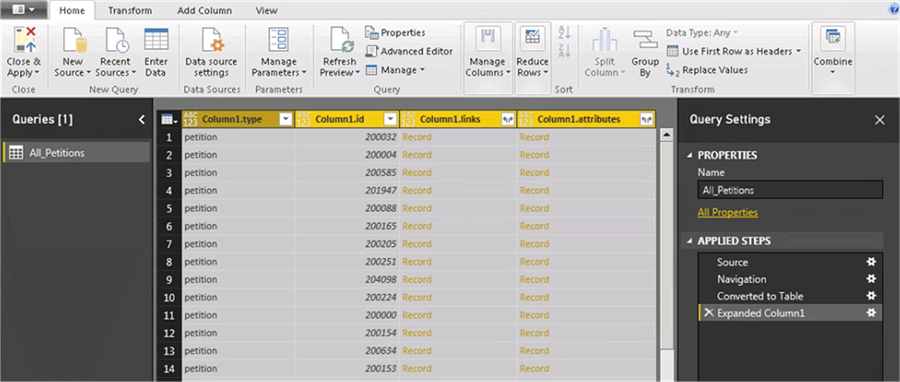
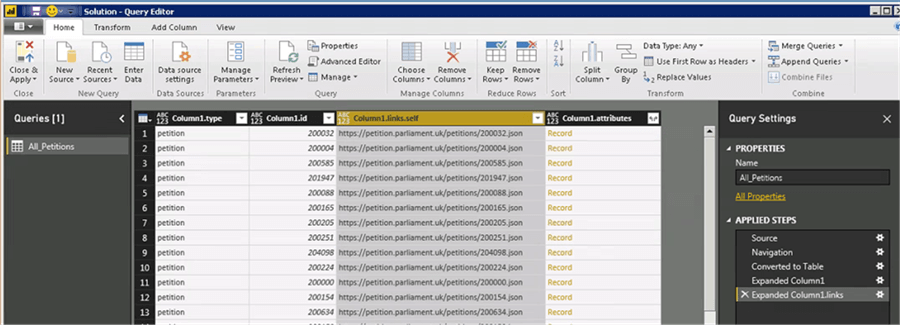
Now you have to convert this list item to a table by clicking on the button “To Table”. Click on the Split into Columns button to open a list of all possible columns. If you prefer, you can use the option “Use original column name as prefix” to add column name as prefix. I have decided to use the default option in this example. Also, I have selected all the columns (type, id, links and attributes) in the list. Once the columns have been expanded, you will see the output as per the below picture.
Now click on the Split into columns button on the “links” column to see the URL for the petition, as per the image below.
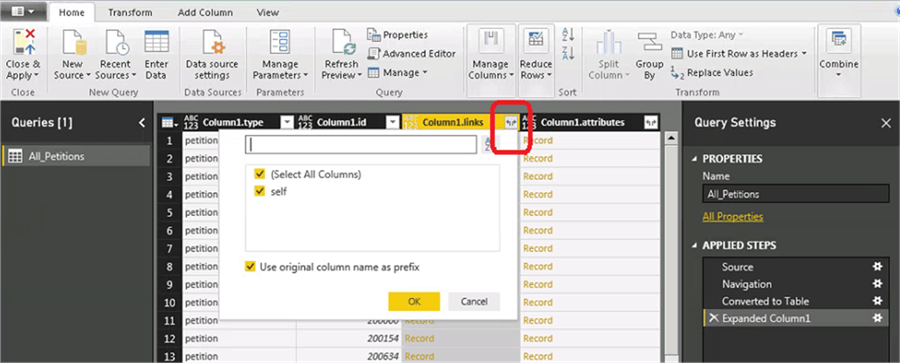
Once expanded, the URL details are visible in the table.
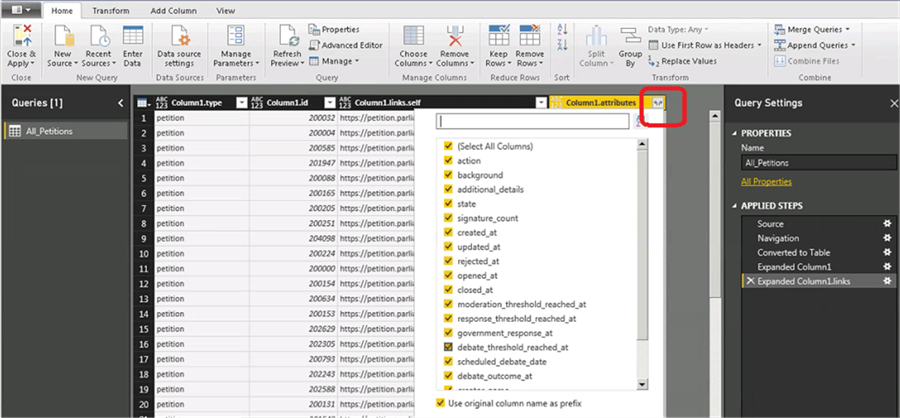
Let’s click on the Split into columns button on the attributes column as shown in the image below. This will open the list of all possible columns (action, background, additional_details, state, signature_count, etc.) as per the image below.
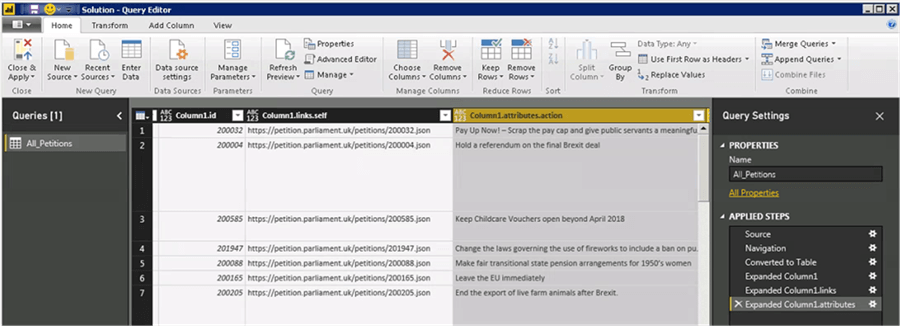
After the expansion, you will see all the additional columns in the table as per the image below.
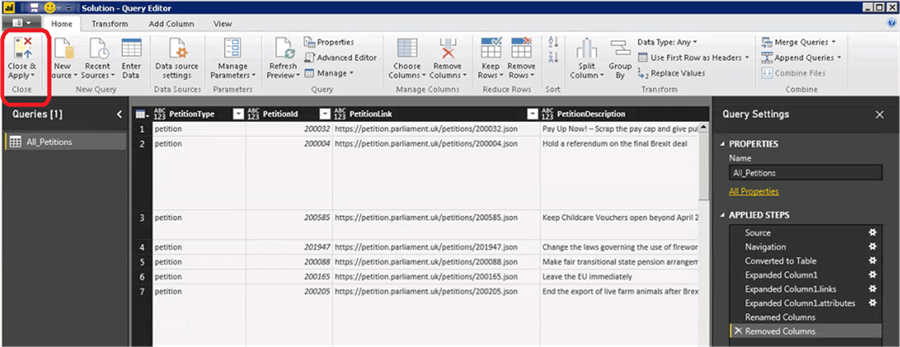
As there are so many unwanted columns in the tables, I have decided to remove the unwanted columns. After I have removed the unwanted columns, the table looks very clean and the below mentioned image represents the actual table. After clicking “Close and Apply”, the final query table has been successfully created.
Creating Top 20 Petitions
This simple table can be queried to generate useful reports. The weight of a petition depends on the number of signatures on the petition. So, let’s create a top 20 petitions based on the signature count.
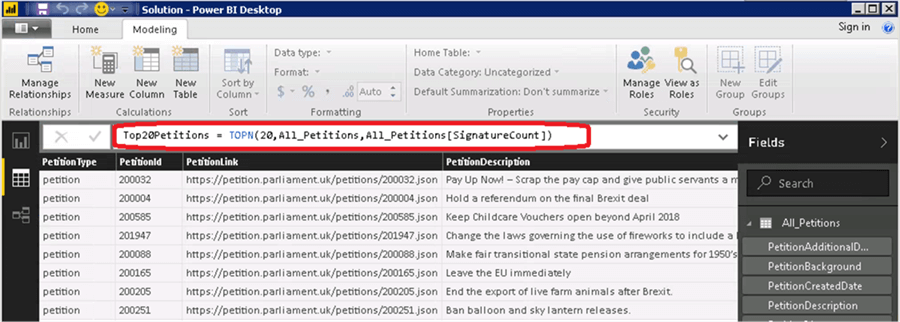
For this purpose, I am creating a “New table” with the below expression. This expression will filter the top 20 petitions based on the signature count.
Expression -- Top20Petitions= TOPN(20,All_Petitions,All_Petitions[SignatureCount])
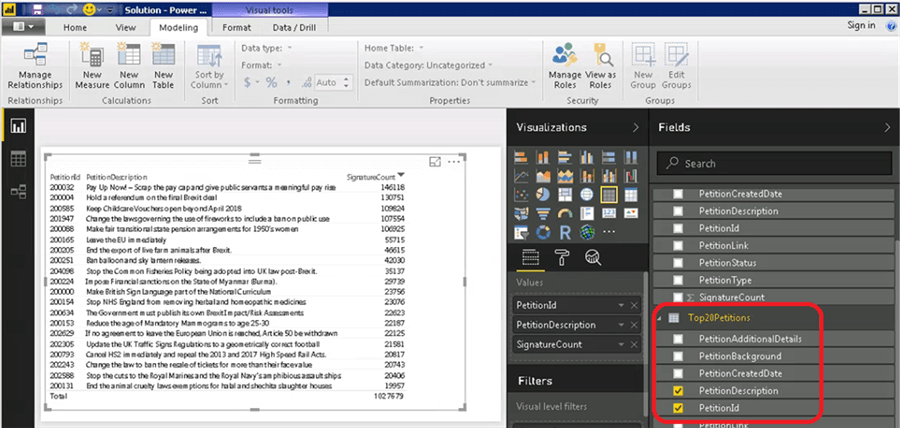
A report can be developed by adding a table into the report pane by selecting the columns PetitionDescription, PetitionID and SignatureCount as per the image below.
Petition Count by Month
As we have the “Petition created date” column in the original table, we can easily develop a report to see how many petitions have been created for each month. A simple report has been developed by adding the “petition created date” and the count of Petition ID to give the number of petitions. As the petition ID is a unique identifier, a count of petition ids can be used to count the number of petitions. After generating the report, it has been realized there were only 50 petitions overall.
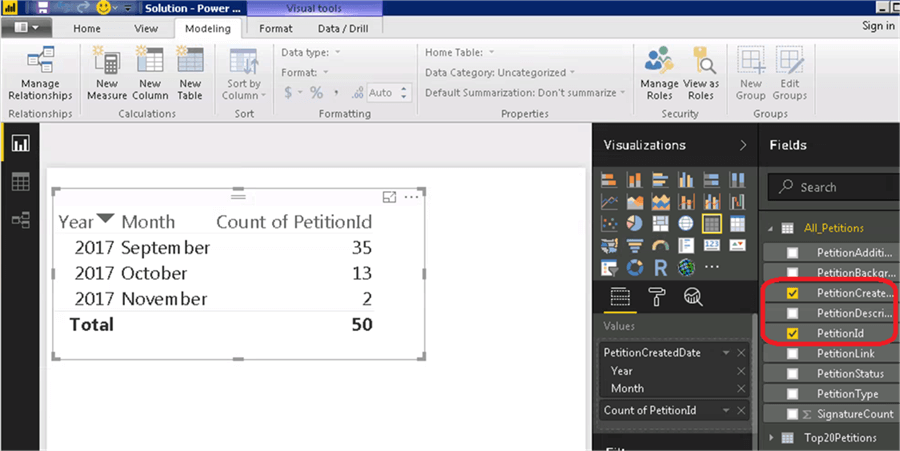
Due to a technical limitation, the parliamentary petitions system only allows you to download JSON data with 50 petitions at a given time. This means, to download the next set of 50 petitions you need to navigate to different URL. I will explain the details to combine multiple sets of petitions in the next tip.
Summary
In this tip we have learned how to extract UK petition data from JSON feed. Also, we have learned to develop a simple report to show the stats at very high level.
Next Steps
- Read other Power BI tips here.

Nat Sundar is working as an independent SQL BI consultant in the UK with a Bachelor’s Degree in Engineering. He has considerable years of experience with the UK Financial Services Industry (mainly in Insurance and Investment Banking).
He is passionate about SQL Server, SSIS, SSAS, SSRS and MDX. He has presented at SQLBits, SQLPass and the SQL London User Group. He has special interest towards Continuous Integration, Continuous Delivery and Deployment automation for the SQL BI (SSIS, SSAS and SSRS) stack.
He can be contacted at sqlnat@gmail.com, via LinkedIN and on Twitter at @SQLNat.


