By: Gauri Mahajan | Comments | Related: > SQL Server 2017
Problem
Data can come in many different ways such as different file formats, from various locations, other databases, web pages, etc. and in SQL Server the R programming language is one of the ways to read this data into SQL Server. Such data can be imported with built-in libraries in R and with the integration of Microsoft SQL Server and the R language, data professionals can import data from various sources and formats using R in SQL Server. There are times when the requirement is to process the data before it is loaded into SQL Server. Developers often find it challenging to do transformations and manipulations (like filtering, updating, rolling up, etc.) on data outside of the database, but this can be done with a SQL like querying mechanism in R to process the data easily for data analysts.
Solution
The data.table package in R addresses the above problem. It is one of the add-on packages for R and the advantage of working with data.table is that it treats data as if it were in a SQL Server database, resulting in providing developers the ease and comfort as with working with SQL Server tables. In this tip, we will cover how this can be done with data.table package.
Assuming your system has the required software components such as SQL Server 2017, SSMS, SQL Server R services (in-database), install the data.table package in R. In case, you are unsure on how to install R packages, have a look at this link to understand how to install packages on R server.
Once data.table is successfully installed in the system, open SSMS and execute the below code in a new query window.
EXECUTE sp_execute_external_script
@language = N'R,
@script = N'
library(data.table)
'
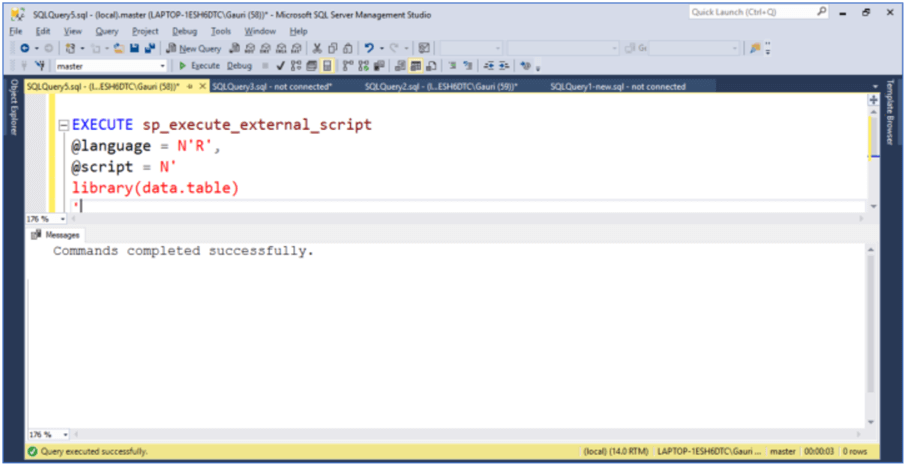
Let's quickly understand this code:
- We are using the sp_execute_external_script stored procedure to execute external scripts. Here we are passing R as an input parameter for the R language script that will be executed as an input parameter.
- The library function references the data.table package to access data.
- Successful execution of the code confirms that the installation of the data.table package has been done correctly and is accessible to SQL Server.
Creating a data.table
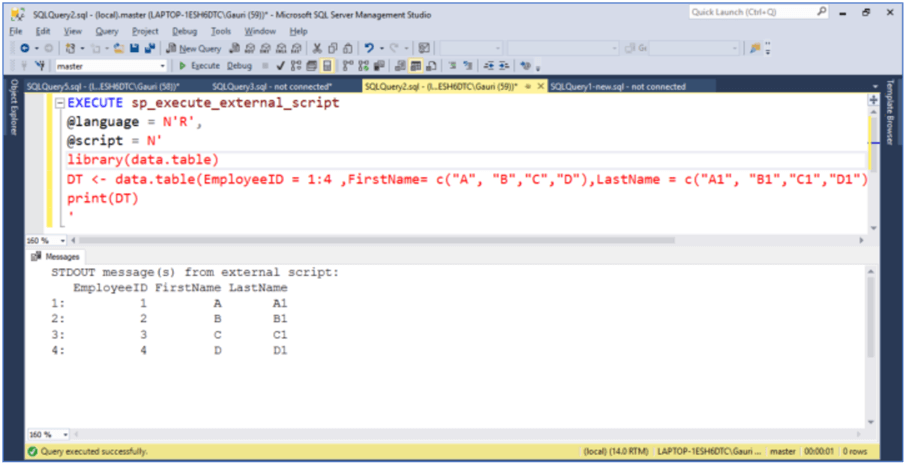
A data.table in an R package is an enhanced version for storing data in R. We can create a sample data.table using the data.table() function. Below is an example where we are creating a data.table with 3 variables and 4 rows. Type the code below and execute to create a data.table.
EXECUTE sp_execute_external_script
@language = N'R',
@script = N'
library(data.table)
DT <- data.table(EmployeeID = 1:4 ,FirstName= c("A", "B","C","D"),LastName = c("A1", "B1","C1","D1"))
print(DT)
'
To illustrate how a data.table works, we will make use of data from the housing dataset. It is one of the datasets contained in the package MASS. You have to make sure this package is also installed on your system to access data in the housing dataset. Basically, we intend to refer to a set of data that has both character and numeric values in it. Feel free to use any data sample available on R.
Type the code below to refer to the MASS package and also to display the housing data in the results window using the print() function.
EXECUTE sp_execute_external_script
@language = N'R,
@script = N'
library(data.table)
library(MASS)
print(housing)
'
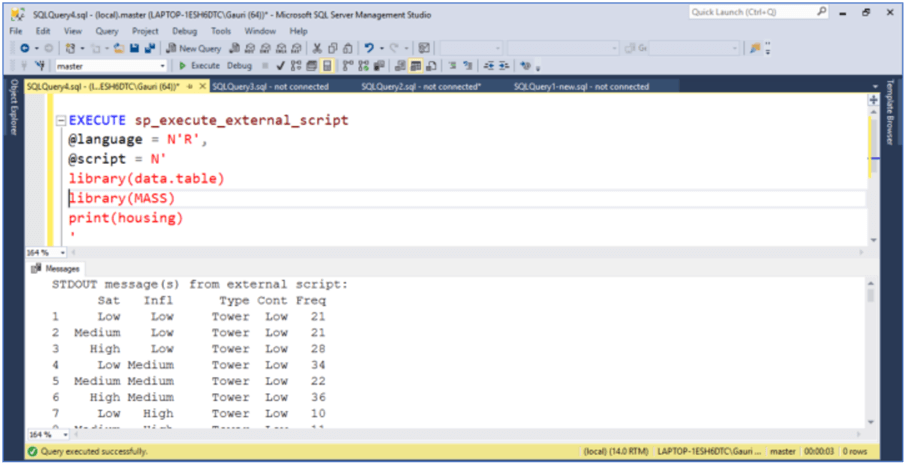
Before we actually get into the working of data.table, let's take a peek at the data in the housing dataset. It has 72 observations (rows) and 5 variables (columns). These 5 variables and their values are as follows:
- Sat - Satisfaction of householders (High, Medium or Low).
- Infl - Degree of influence householders have on the property management (High, Medium, Low).
- Type - Type of rental accommodation (Tower, Atrium, Apartment, and Terrace).
- Cont – Contact of residents with one another (Low, High).
- Freq – The frequency/numbers of residents in each class.
Syntax of data.table
The basic syntax of data.table is quite similar to SQL model DT[ i, j, by ]
- DT refers to data table.
- i refers to the row condition/ordering that we need in the result set.
- j refers to the columns or an operation on some columns.
- by specifies how to group the result.
In short, a data.table it equivalent in SQL as follows DT[ i, j , by] <-> SQL(where/order by, select, group by).
Since we have the base set up ready, let's go ahead and see how a data.table actually works.
Subsetting rows and manipulation on columns using data.table
1.1 Subsetting rows using i
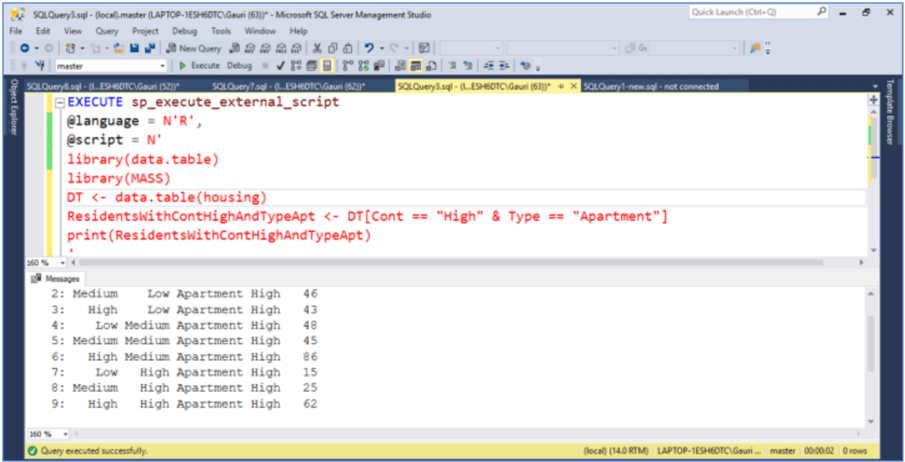
Let's say we want to select all the rows where residents have 'Apartment' as the type of accommodation and Contact with one other residents is 'High' from the Housing dataset. Based on this condition (Cont == "High" & Type == "Apartment"), rows are computed and are returned as a data.table as shown below.
EXECUTE sp_execute_external_script
@language = N'R',
@script = N'
library(data.table)
library(MASS)
DT <- data.table(housing)
ResidentsWithContHighAndTypeApt <- DT[Cont == "High" & Type == "Apartment"]
print(ResidentsWithContHighAndTypeApt)
'
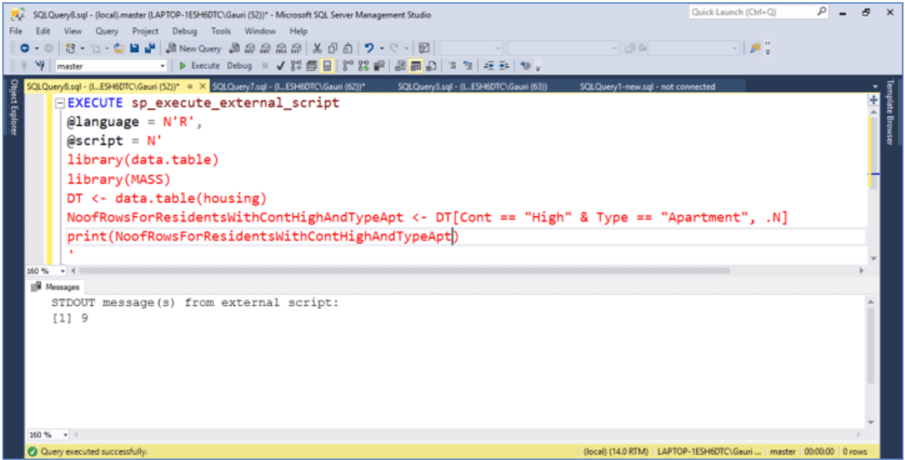
In case we want to see the number of residents that satisfies the condition in the above snippet, we can do so by using the special built-in variable – '.N'. It basically returns the number of observations in the subset. .N is similar to using nrow(), however using nrow() with data.table would be inefficient, it would have to subset the entire data.table first and return the rows using nrow().
EXECUTE sp_execute_external_script
@language = N'R',
@script = N'
library(data.table)
library(MASS)
DT <- data.table(housing)
NoofRowsForResidentsWithContHighAndTypeApt <- DT[Cont == "High" & Type == "Apartment", .N]
print(NoofRowsForResidentsWithContHighAndTypeApt)
'
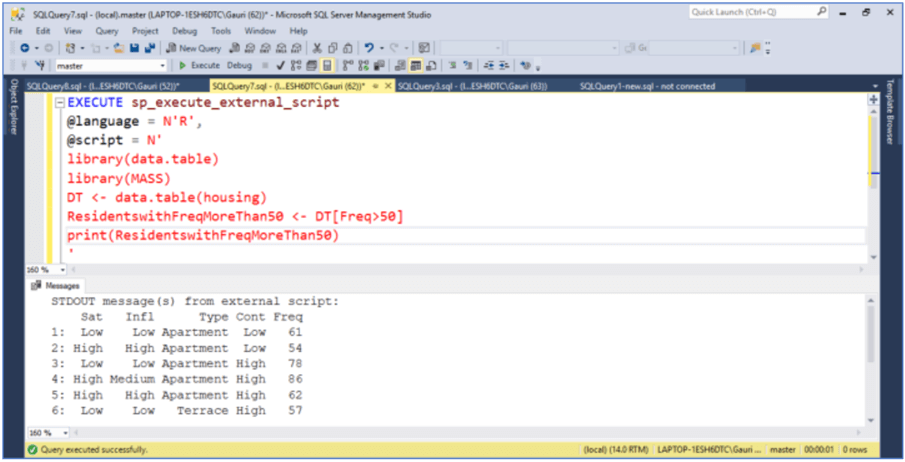
Below is another example where we are selecting all rows that have a value greater than 50 in the Freq column.
EXECUTE sp_execute_external_script
@language = N'R',
@script = N'
library(data.table)
library(MASS)
DT <- data.table(housing)
ResidentswithFreqMoreThan50 <- DT[Freq>50]
print(ResidentswithFreqMoreThan50)
'
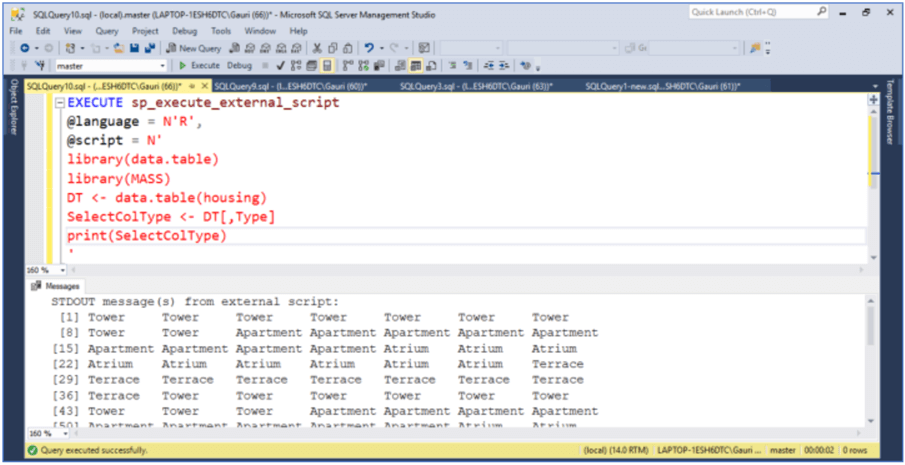
1.2 Working on columns using j
In a data.table, columns are referred to as variables, so we can directly refer to the column we want to select or compute. We can skip expressions in i since we want all the rows. The following code DT[,Type] will return column Type as a vector. After executing the code below, we will see it returns all the rows for the column Type. In case we want to select more than one column, we can make use of function c() like this, DT[, c(Sat,Type,Freq)] and the output will be a vector of values.
EXECUTE sp_execute_external_script
@language = N'R',
@script = N'
library(data.table)
library(MASS)
DT <- data.table(housing)
SelectColType <- DT[,Type]
print(SelectColType)
'
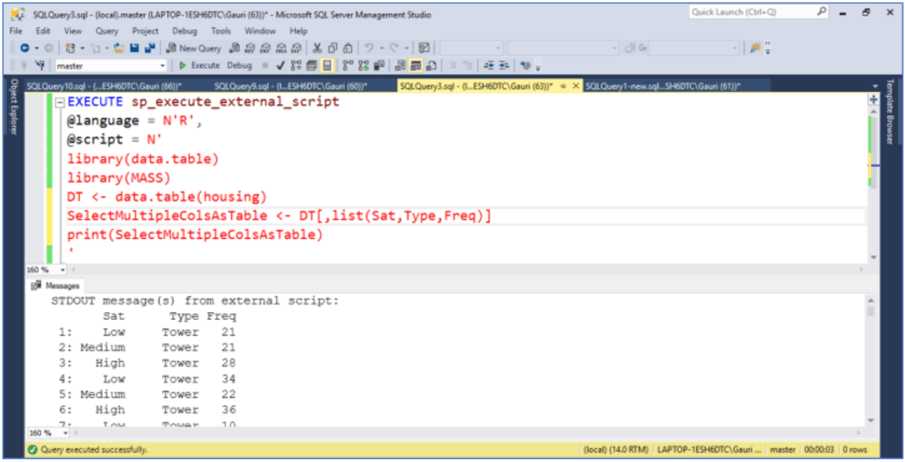
1.2.a - Making use of list function
Now, suppose we would like to select multiple columns and not return the data as a vector. For such a scenario, we can wrap the column names (or variables) within list() or using function .(). Both of them work the same, they make sure output is returned as a data.table.
EXECUTE sp_execute_external_script
@language = N'R',
@script = N'
library(data.table)
library(MASS)
DT <- data.table(housing)
SelectMultipleColsAsTable <- DT[,list(Sat,Type,Freq)]
print(SelectMultipleColsAsTable)
'
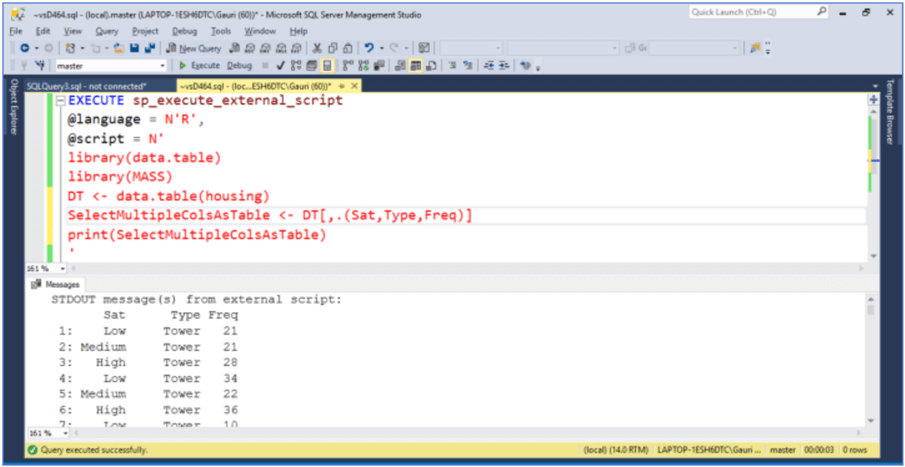
1.2.b Making use of .()
A data.table also allows enclosing columns with .() instead of list(). It becomes very convenient to work with complicated queries with .() in j-expression. Execute the below code to see how the function .() works the same way as list() does.
EXECUTE sp_execute_external_script
@language = N'R',
@script = N'
library(data.table)
library(MASS)
DT <- data.table(housing)
SelectMultipleColsAsTable <- DT[,.(Sat,Type,Freq)]
print(SelectMultipleColsAsTable)
'
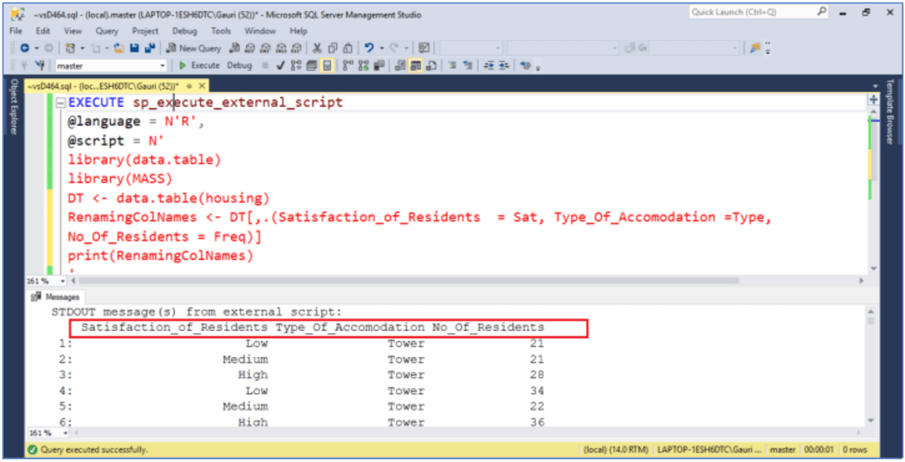
1.2.c Renaming columns names
In order to give meaningful names for end users to understand, we can also rename columns as shown below.
EXECUTE sp_execute_external_script
@language = N'R',
@script = N'
library(data.table)
library(MASS)
DT <- data.table(housing)
RenamingColNames <- DT[,.(Satisfaction_of_Residents  = Sat, Type_Of_Accomodation =Type,
No_Of_Residents = Freq)]
Print(RenamingColNames)
'
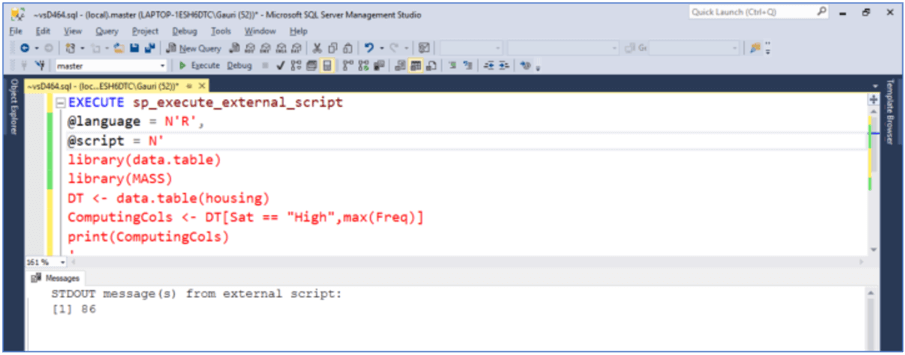
1.2.d Computation on columns or values in columns
We can also perform computations on the columns, since columns are referred to as if they are variables. We can make calculations by calling functions on these variables. In the below code, we are finding the maximum number of residents for whom the satisfaction level is "High".
EXECUTE sp_execute_external_script
@language = N'R',
@script = N'
library(data.table)
library(MASS)
DT <- data.table(housing)
ComputingCols <- DT[Sat == "High",max(Freq)]
print(ComputingCols)
'
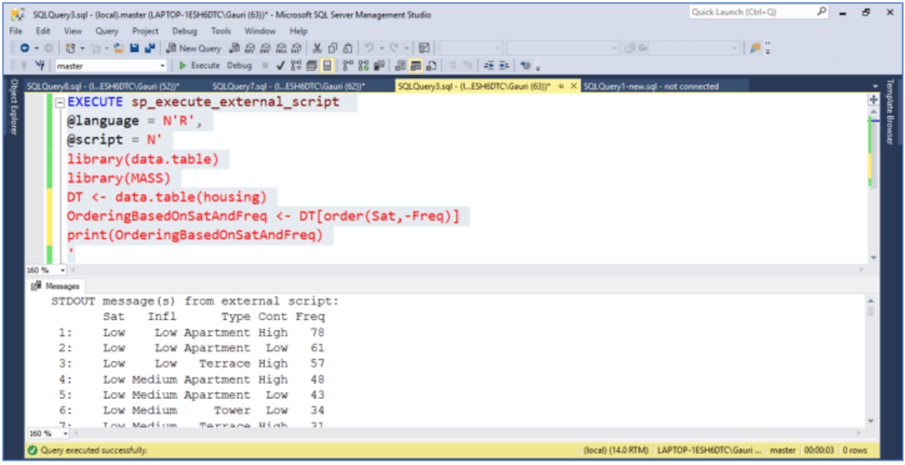
2. Sorting/Ordering using data.table
The order() function with the latest r-release has become internally optimized in a way that data.table uses radix order forder() for additional speed. The new algorithm supports logical, integer (even with large values), real, and character vectors. Therefore, it works much faster than the base function order().
Here, we are sorting the housing dataset first by column Sat in ascending order and then by Freq in descending order(- sign on Freq returns values in descending order). The – sign can be used on a character column in order() in a data.table due to the internal query optimization feature in a data.table.
EXECUTE sp_execute_external_script
@language = N'R',
@script = N'library(data.table)
library(MASS)
DT <- data.table(housing)
OrderingBasedOnSatAndFreq <- DT[order(Sat,-Freq)]
print(OrderingBasedOnSatAndFreq)
'
Aggregation using data.table
Data aggregation holds an important place in several processes in any organization. In the sections above, we saw how we can make use of i and j in the syntax : DT[ i, j, by ]. Now, let's go further and explore how i and j can be combined together with by to carry out aggregations by group.
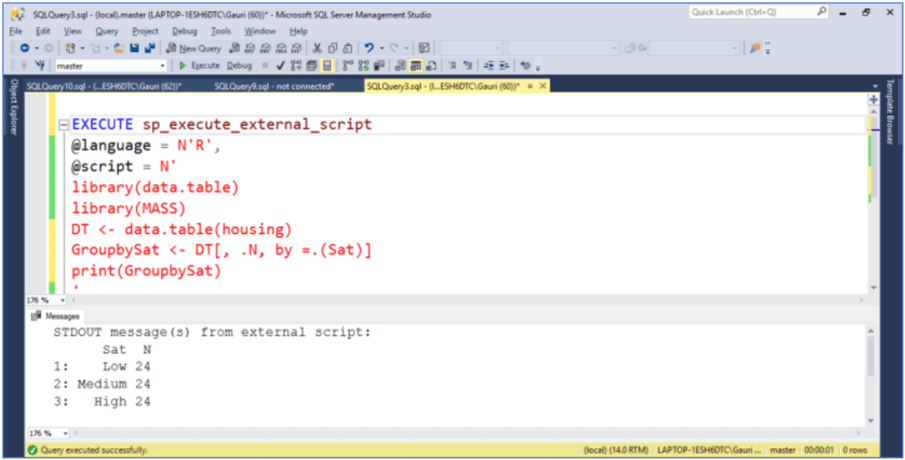
We already used .N in one of the examples above, it is a special built-in variable that returns the number of rows and speeds up the computing time by avoiding the overhead of function calls. In the code below, since we did not give a name for the column returned in j-expression, it automatically named it N by recognizing the special symbol .N. Execution of this code will return the number of residents for every group in Sat column to the output screen.
EXECUTE sp_execute_external_script
@language = N'R',
@script = N'
library(data.table)
library(MASS)
DT <- data.table(housing)
GroupbySat <- DT[, .N, by =.(Sat)]
print(GroupbySat)
'
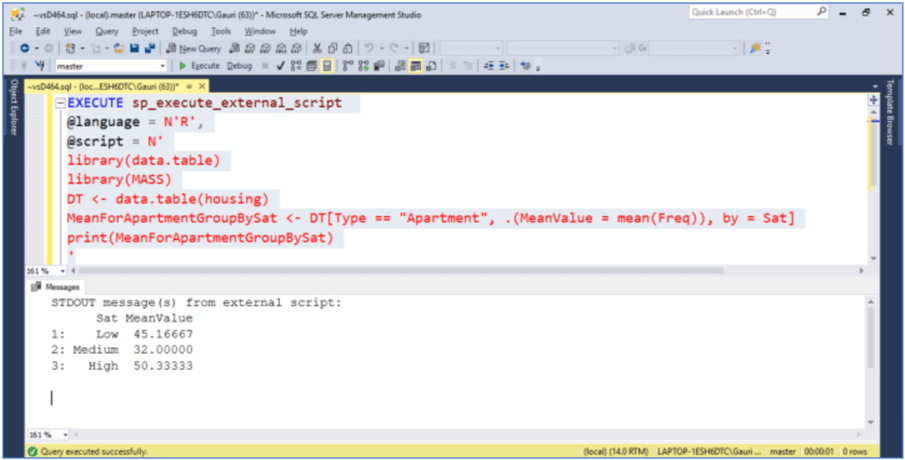
Let's look at one more example that calculates the mean of the Freq column for every group in Sat and for Type Apartment. Here, we first take the list for the expression Type == "Apartment" in i. Using this list, we get the number of rows that are grouped by Sat column. This is a faster and more memory efficient way since no columns are materialized here, as j-expression does not require any columns to be subsetted. Also, notice we have provided a column name for the aggregated data(mean) as MeanValue.
EXECUTE sp_execute_external_script
@language = N'R',
@script = N'
library(data.table)
library(MASS)
DT <- data.table(housing)
MeanForApartmentGroupBySat <- DT[Type == "Apartment", .(MeanValue = mean(Freq)), by = Sat]
print(MeanForApartmentGroupBySat)
'
3.1 Understanding groupby with Having clause and sorting data using chaining expressions in data.table
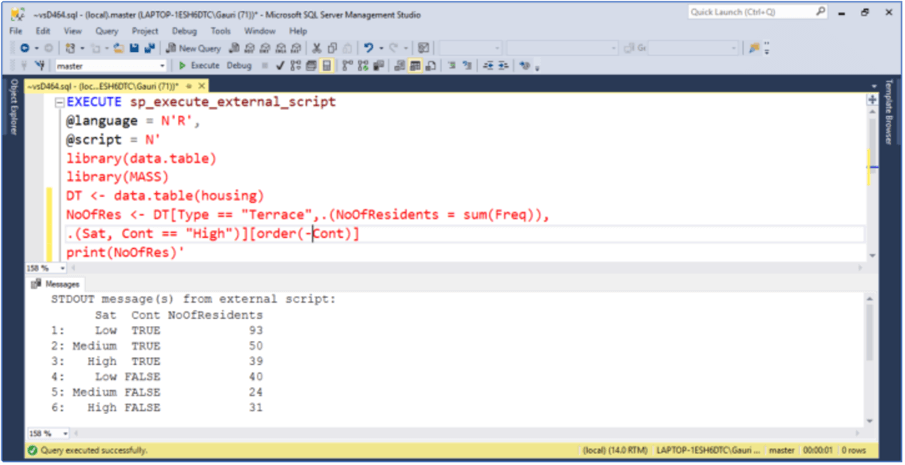
Let's reconsider the previous example and instead of mean values and Type Apartment, we want to know what are the total number of residents with a Terrace accommodation and have High Contact that are grouped on column Sat. And also, how can we order the result on the column Cont in descending order.
One way of doing this task is to store the intermediate result in a variable and then use order() on that variable. This is a straight forward approach, but at the same time comes with the overhead of overwriting the intermediate result. A better way is to make use of the chaining expression as shown below. We have used - on the Cont column to get results in descending order.
EXECUTE sp_execute_external_script
@language = N'R',
@script = N'
library(data.table)
library(MASS)
DT <- data.table(housing)
NoOfRes <- DT[Type == "Terrace",.(NoOfResidents = sum(Freq)),.(Sat, Cont == "High")][order(-Cont)]
print(NoOfRes)'
Working with DML commands using data.table
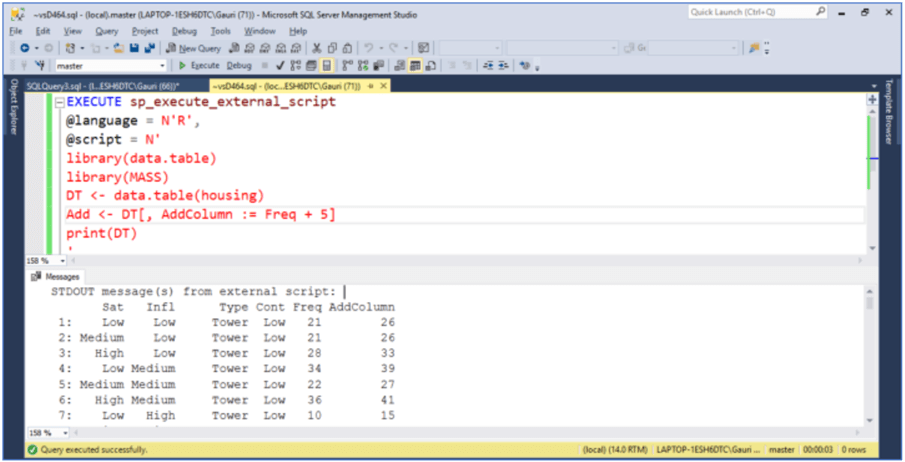
A data.table is not only used for subsetting, sorting and aggregation, but we can perform any function that we can do with a standard data frame. In a data.table everything is designed to modify the object by reference. := is an assignment by the reference operator, that means it does not make a copy, hence we have better performance with less memory usage. Just in case you require a copy, take a copy first before using this assignment operator(by using DTBackup = copy(DT)). This operator makes for faster add, delete and update subsets of columns. By reference, := is defined for use in j expression only.
Let's go over a few examples using := operator. With the code below, we have added a new column named 'AddColumn' by reference that has Freq + 5 value in it.
EXECUTE sp_execute_external_script
@language = N'R',
@script = N'
library(data.table)
library(MASS)
DT <- data.table(housing)
Add <- DT[, AddColumn := Freq + 5]
print(DT)
'
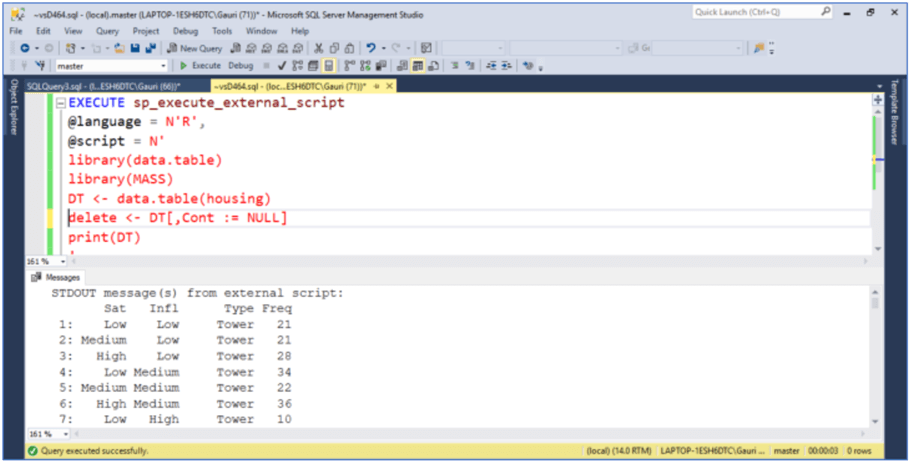
The following command shows how to remove the column Cont by reference from the dataset.
EXECUTE sp_execute_external_script
@language = N'R',
@script = N'
library(data.table)
library(MASS)
DT <- data.table(housing)
delete <- DT[,Cont := NULL]
print(DT)
'
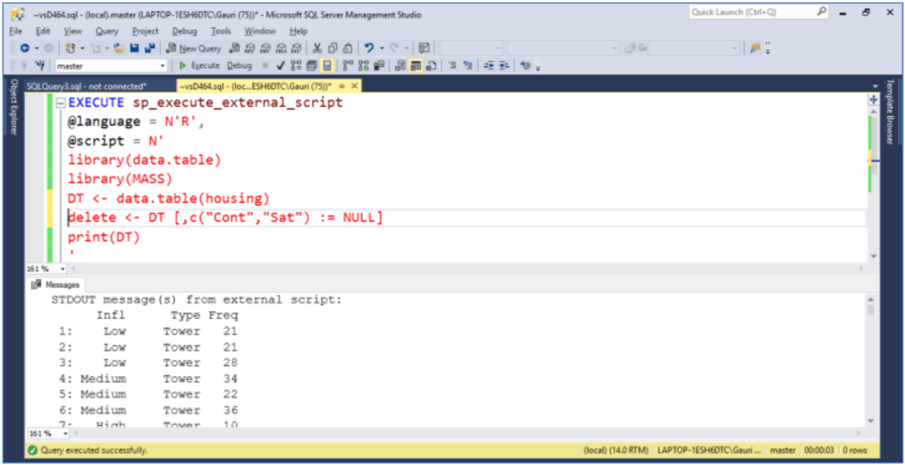
We can delete more than one column using the code below. After executing the below code, columns Cont and Sat are removed from the housing dataset.
EXECUTE sp_execute_external_script
@language = N'R',
@script = N'
library(data.table)
library(MASS)
DT <- data.table(housing)
delete <- DT [,c("Cont","Sat") := NULL]
print(DT)
'
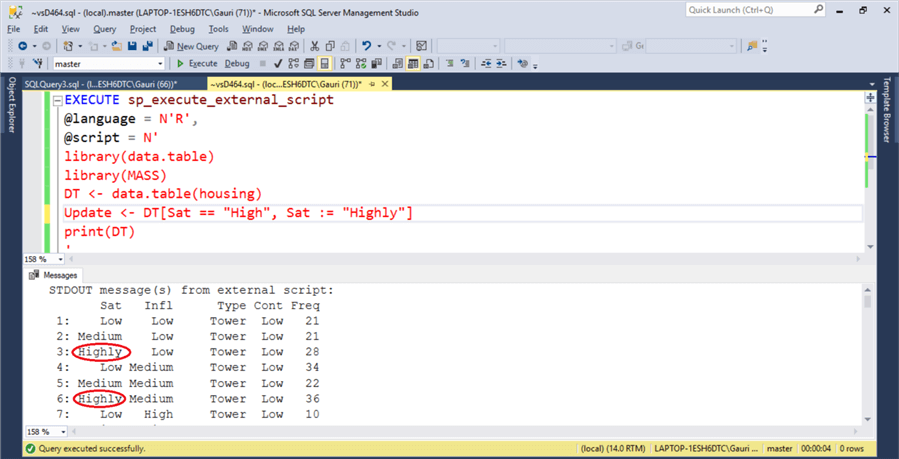
With the lines of code below, the column Sat is updated by what is after :=, "Highly" in this case.
EXECUTE sp_execute_external_script
@language = N'R',
@script = N'
library(data.table)
library(MASS)
DT <- data.table(housing)
Update <- DT[Sat == "High", Sat := "Highly"]
print(DT)
'
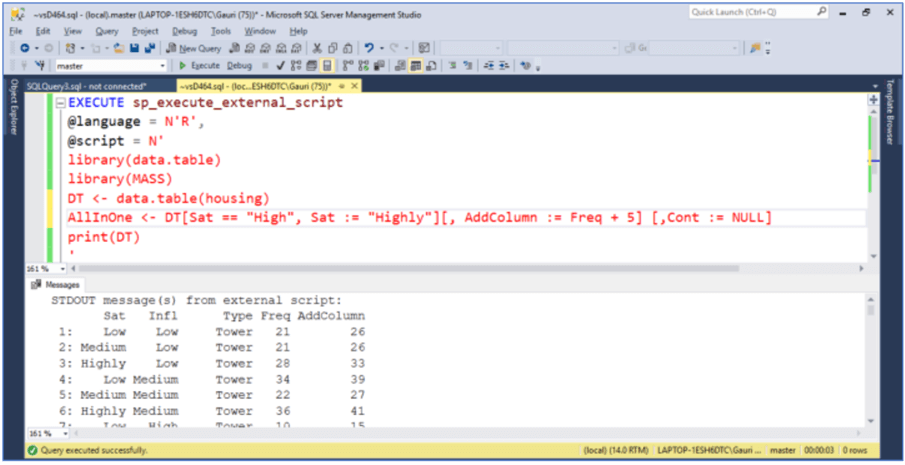
We can accomplish the same results by executing all three commands we ran above in one single command. This is called Chaining of commands.
EXECUTE sp_execute_external_script
@language = N'R',
@script = N'
library(data.table)
library(MASS)
DT <- data.table(housing)
AllInOne <- DT[Sat == "High", Sat := "Highly"][, AddColumn := Freq + 5] [,Cont := NULL]
print(DT)
'
fread() in data.table package
Besides the ease of use, programming speed and many other advantages of a data.table, developers can make use of fread() in a data.table package to load large datasets in SQL Server using R and that also without compromising on execution speed. Have a look at this to learn the syntax and basics of the fread function in a data.table package.
Summary
We have made use of a smaller dataset in this tip to emphasize the functionality of the data.table package, but feel free to load larger datasets and practice the exercises demonstrated above.
In this tip we learned how about the data.table package to operate on tabular data in R, using a mechanism similar to SQL based querying. Also, a data.table allows us to do blazing fast data manipulations causing programming and computing time to be reduced tremendously. Additionally, fread() in data.table package is valuable for those who regularly have to deal with reading large files. In a nutshell, it is one of the best packages for dataset processing in R.
Next Steps
- Install the data.table package in R and practice various operations explained in this tip.
- Refer to this link to learn more about the data.table package.


About the author
 Gauri Mahajan is very passionate about SQL Server Reporting Services, R, Python, Power BI, the Database engine, etc. and enjoys writing.
This author pledges the content of this article is based on professional experience and not AI generated.
View all my tips
