Problem
Does Power BI include any drill through navigation features? Can filters be applied to the drill through process?
Solution
Any time you are dealing with data, you inevitably will get the question: "What makes up that number?" Sure, you could write a query to get those details. Or you could ask the user to research the numbers on their own. However, the better answer is to provide a way for users to see the detail within your report or dashboard. One option in Power BI is to use the drill down capabilities of a matrix which works much like a pivot table in Excel. Drill down capabilities work within the same visual using the same dataset. Basically, you are looking at a more detailed level of aggregation all within that one visual. I would recommend taking a look at Siddharth Mehta’s tip on drill down and data analysis at: https://www.mssqltips.com/sqlservertip/5249/data-exploration-drill-down-and-analysis-using-decomposition-tree-in-power-bi-desktop/ . To the contrary, the drill through functionality pertains to a related but somewhat different concept. Drill through reports provide a path for moving from one tab in a report to a completely different tab within that report. You will be looking at a completely different visual to see a detail level of data.
Before you complete any part of the below examples, you need to be sure to download the latest version of Power BI desktop from: https://powerbi.microsoft.com/en-us/get-started/. The download and install process has changed, in that it now uses the Microsoft Store to complete the install. For those wanting the more traditional download and install method, you can still use this site: https://powerbi.microsoft.com/en-us/desktop/.
Power BI Drill Through Process
The first step in the drill through process is to plan your master report and your target report. As you decide on these report tabs, you can actually have multiple drill through reports for a report consumer to navigate to. Thus, a master report could have three "sub" reports that can be opened from the main report. Also, another item to keep in mind is that if you are using Power BI Report Server, some of this functionality may not work. Remember Microsoft pushes out updates for Power BI Desktop, Power BI Service (online), and Power BI Report Server just about every month or so.
For our example, we will be using the AdventureWorks2016 database as our data source ( take a look at these tips https://www.mssqltips.com/sqlservertip/4016/querying-sql-server-data-with-power-bi-desktop/ or https://www.mssqltips.com/sqlservertip/4170/connect-to-onpremises-data-sources-with-power-bi-personal-gateway/ as some examples for connecting to various data sources).
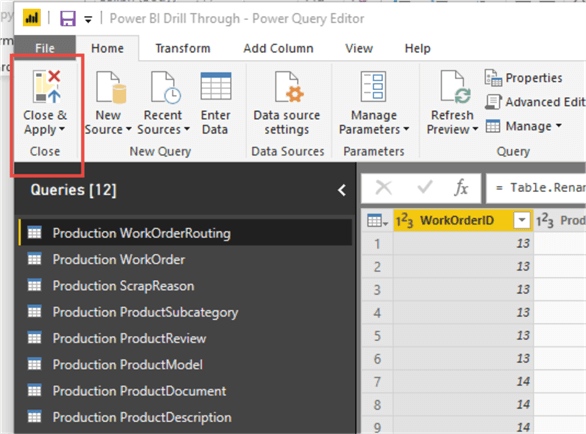
As shown in the below screen print, we add the Production schema tables from the AdventureWorks database to our data model in the Power Query Editor. For this example, no particular transformations other than a few columns renames (to add spaces between words) were completed on the data.

Next, we would select close and apply, in order to send the query data sets back to the main report design grid.
We are now ready to design our Main report tab. This report tab will be where we will drill through from. As illustrated below, the master contains a clustered bar chart and a few slicer visuals. The bar chart uses the actual start date year for the category along with the location for the legend. For the measure value, the actual cost is used from the Production.WorkOrderRouting table. The location name comes from the Production.Locaton table. The actual start date year and location will become the basis for our drill through action.

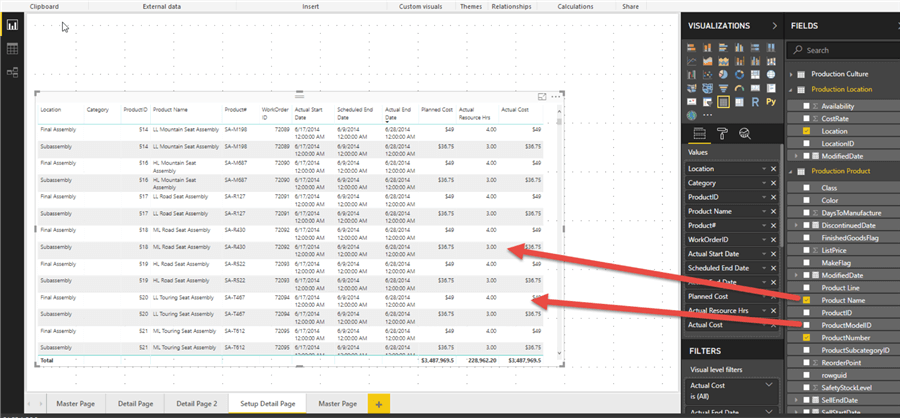
After setting up the main master page, the ensuing step is to create our detail report tab; this page will be the tab where the user will go to when drilling through. In the below example, a simple table has been created. It contains the location, category, productid, product name, product number, work order ID, actual start date, actual end date, scheduled end date, actual cost, planned cost, and actual resource hours.
We are now ready to add our drill through filters. For this example, drill through by actual start date year and location will be allowed; these fields are the two main component on bar chart visual on the main report tab. In order to complete this task, we first need to be on the detail page. Then, we will drag the Location name field and the actual start date year to the drill through section. Just above the area where the two fields were placed is an option that says Keep All Filters. Turning this option On allows filters used on the main or master page to be passed to the detail page which should allow for the synchronization of the master page filters with the values shown on the details page. Turning this filter off means only the specific fields placed in the drill through field list will be used as filters for the detail page.

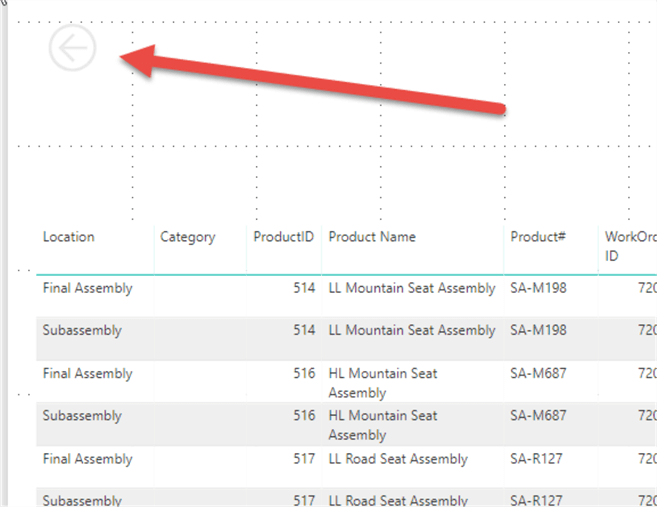
Once the filters are set, you will notice an arrow image is added to the detail tab. This arrow works as a back button to allow users to quickly navigate back to the original master page.
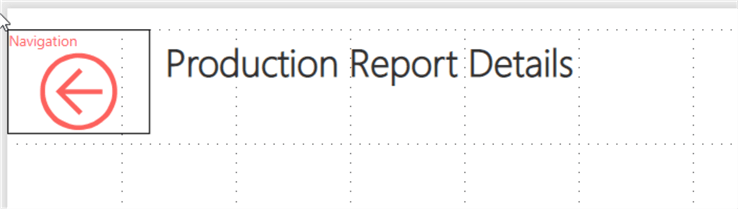
To make it stand out, I adjusted the color of the arrow and also added a title to the arrow image. Furthermore, a text box was added as a title for the detail report. I also added a duplicate tab of the detail report to allow for a second drill through detail page to appear in the drill through action (more on this item soon).
The drill through functionality can now be shown by first heading back to the master tab and right clicking on one of the bars within the bar chart visual. You will notice we have two drill through options. The original detail report and the second duplicate version that was just created.
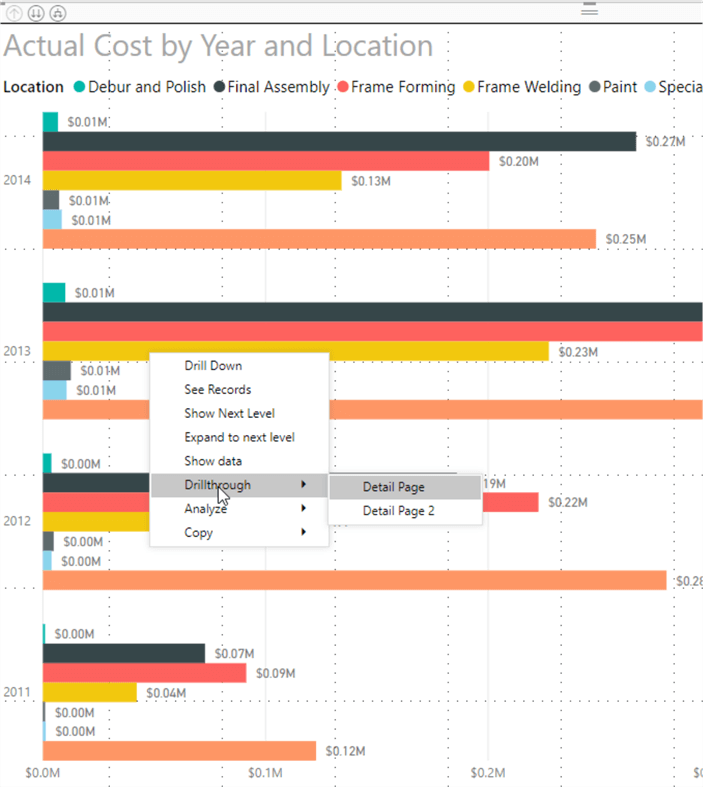
Upon clicking on the Detail Page option (notice how it shows Detail Page and Detail Page 2, the second is the duplicate tab that was created), we are directed to detail page and the visual is filtered by the values for the bar that was selected: 2013 and Frame Welding. You may also be wondering how I got the 2013 and Frame Welding values to show on the detail report. That item is a little trick that makes use of the Card visual. Since only one value can be selected for each of the added drill through filters (start date year and location in this example… more details on multiple values soon), we actually can drop a card visual onto the design grid and then add the corresponding drill through field to the card; thus we add one card for location name and one card for start date year. We are using the card visuals to create a title for the detail report. This setup allows for the report consumers to easily see what bar was selected on the master page.
One other item that should be noted about the navigation arrow that was automatically added. In Power BI Desktop, the Back arrow will only work if the ctrl key is held down while clicking the arrow. Within Power BI Service (online), the arrow only needs to be clicked.

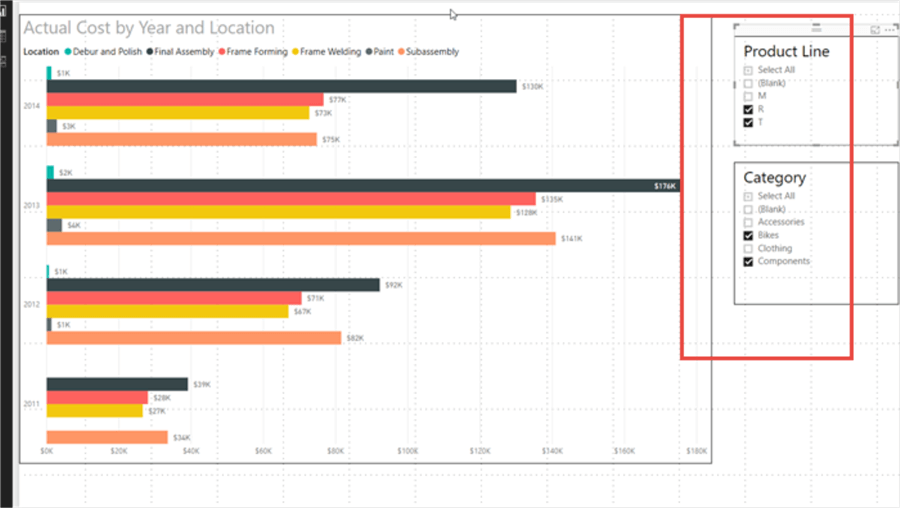
Heading back to the main page, let us filter the results using the product lines and categories slicers. As you can see in the below example, R & T are the selected product lines and Bikes and Components are selected for the categories.
Now when we drill down from the master page, the table results are not only filtered by the year and location, but also by product line and category. This effect is caused by having the Keep all filters set to On.

If this option is set to off, then only the year and location (the named drill through filters) are used, as shown below.

You may also be wondering how the product line and category are being show on the detail page similar to the year and location cards. The same concept is used whereby a card visual is utilized yet is expanded. Since these filters allow for multiple values to be selected, we instead use a multi-row card visual to display the values that are selected within the slicers.
As we wrap up our tip on drill through functionality, an additional enhancement that was recently added to the drill through functionality was the ability to add not only regular dimensional type fields, but also allows measures to be added as one of the drill through filters. As illustrates subsequently, adding the actual cost as one of the drill through measures allows that item to be included in the filtering process. Each of these drill through filters can be used as a category (most like especially for non-numeric field values) or summarized.

As you can see the drill though functionality adds a greater layer of interactivity to a Power BI report with multiple tabs; this functionality is a perfect complement to the summary visuals and KPI reports that are found on most high-level dashboards.
Next Steps
- Take a look at these other Power BI tips – https://www.mssqltips.com/category/power-bi/
- Power BI Advanced Q & A – https://www.mssqltips.com/sqlservertip/4308/power-bi-advanced-q–a-techniques/

I have a passion for crafting Business Intelligence Solutions for my user groups. My experience includes almost 15 years of SQL Server involvement with the last 12 years focused specifically on Business Intelligence, SharePoint, OLAP, SSRS, and Decision Support solutions. Currently, I am a Business Intelligence Architect in the healthcare industry, and I also teach database and analytics classes for Kennesaw State University, Southern New Hampshire University, and Reinhardt University. My education includes an MBA and an undergraduate in Accounting (yes I am a reformed accountant!), both from Kennesaw State University. I enjoy every day by trying to grow my faith and spend precious time with my family. I have been happily married to my wife of over 20 years, and we have two teenagers one who we home school with the help of a University Model School, Cornerstone Prep in Acworth, GA (cornerstoneprep.org). Our other child is a Construction Management major at KSU’s Southern Poly / Marietta campus. We are a soccer and Cross Country (XC) family who play, coach, and referee soccer or run for fun most every day. For several years, our family has volunteered (and played with the dogs and cats) at Etowah Valley Humane Society in Cartersville, GA.
- MSSQLTips Awards: Champion (100+tips) – 2016 | Author of the Year – 2015 | Author Contender – 2014, 2016-2021


In drill down process I got the icon and if I click on that , I got options under the icon. But my requirement is to get the options by side . Any option is there to get like that . If any let me know asap