Problem
Earlier this year (2023), the Power BI team released new updates to the Power BI desktop user interface, totally changing how we usually use features in the Power BI desktop. Among these updates was the new way to set up drill-through functionality in Power BI reports. Before, drill-through fields were usually dropped within the “Add drill-through fields here” of the visualizations pane. But now, this is done differently since the old visualizations pane no longer exists. In short, many Power BI developers/analysts are not so sure how this works nowadays, and for those new to Power BI, the old articles will not help.
In this article, I will demonstrate how to implement drill-through in Power BI reports using the new user interface.
Solution
To demonstrate, I have created a report page, as seen in the image below.

The plan is that when I choose a country in the “Top 10 Countries by Gold Medals Won” chart, I want to be able to drill-through to a details page to view more details about the selected country. Some business requirements might also specify that you create drill-through functionality on card (summarized) visuals, too. We will look at achieving both in the new Power BI report UI.
The following step-by-step approach simplifies how to set up drill-through.
- Create the main report page and the details page.
- Set up the drill-through details in the format pane of the details page.
- Add category or summarised fields to the drill-through well settings accordingly.
- Test your set up.
Step 1: Create the Main Report Page and Details Page
In this demo, I will use the report page in the image above as my main report page and create a table visual, that will include some details from the image below as my “Details page.”

Step 2: Set Up the Drill-through Details in the Format Pane of the Details Page
In the new Power BI desktop UI, navigate to the details page you created. This is the page you want to be able to drill through to.
While in the drill-through page, click on any empty space within your report canvas. This will allow you to view the page format pane, as seen in the image below.

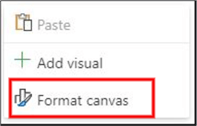
If you cannot view the page format pane after clicking on an empty space on your details page canvas, you can right-click on the empty space and click “Format canvas,” as seen in the image below.
Or you can also follow the steps on the image below to help you navigate to the page format pane.

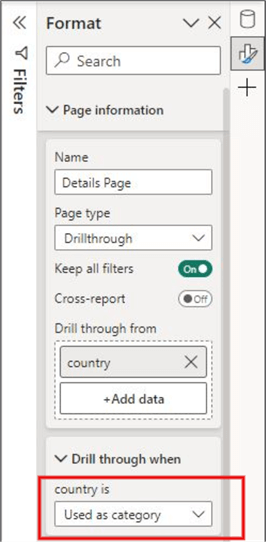
Once you can view the page format pane, expand the “Page Information” section, as seen in the image below.

Next, change the option in the Page type subsection to “Drillthrough,” as seen in the image below. This should automatically activate the “Keep all filters” functionality, which helps to maintain all applied filters cascaded from the Main Report page to the Details page when a drill-through is selected.

Step 3: Add Category or Summarized Fields to the Drill-through Well Settings Accordingly
The image below compares the old drill-through and the new one.

In the new drill-through well, let’s add a field from the Main report page to the Details page to display its details. This can be a category field or a summarized card visual (aggregated filed value).
For example, on the Main Report page, we have the country names in the charts, the “Top 10 Countries by Gold medals won” chart, and on the Details page, we also have the country names within the table visual. So, we can add the “country” category field into the “Drill through from” subsection of the Page Information.
To do this, click the “+Add data“, as seen in the image below. Select the field you want. For this demo, I will select the “Country” categorical field.

Since country is a categorical field, it will automatically show in the “Drill through when” section as “Used as category.”
If we needed to apply the drill-through on a numerical field like the summarized values on a card visual, we would need to follow the same steps earlier but instead select the numerical (summarized) field rather than the categorical field.
Step 4: Test the Set Up
The last step is to test the drill-through configuration. To do this, go back to the Main Report page and right-click on a single country point (as seen in the image below) or hover over a single country point on the charts, select drill-through, and choose the details page you need to drill-through to. In this demo, we will drill through to the Details page. See the image below.
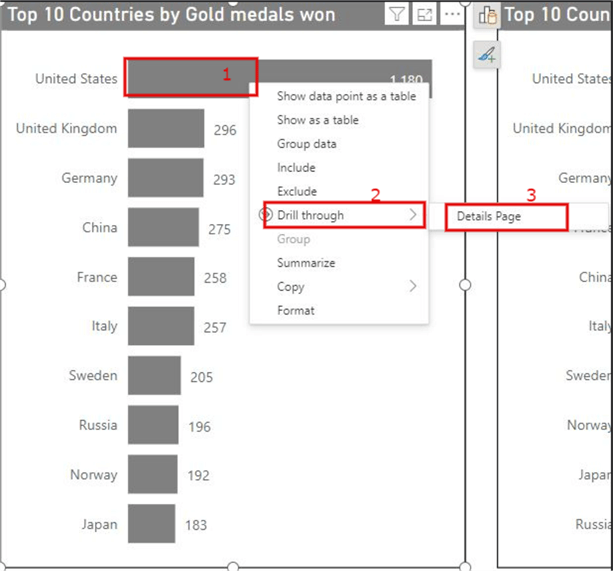
In the image above, I right-clicked on “United States,” selected “Drill through,” and clicked on “Details page.” This drills through to the Details page filtering out only United States information, as seen in the image below.

Note: A back navigation button is automatically created once you set up the Details page in Step 3.
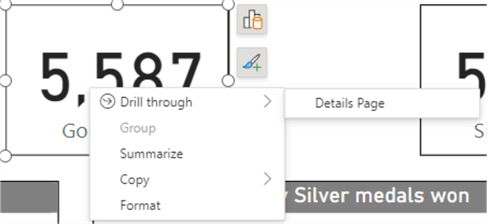
Also, if you added a numerical field to the fields well to a card visual in Step 3, you can drill through from the card visual to the Details page by right-clicking on the card visual in the Main Report page, as seen in the image below. However, note that the cascaded filter for the card visual will not be applied to the Details page as in the case of categorical fields.
In this article, I have demonstrated how to set up a drill-through in your report using the new Power BI user interface. See the Next Steps below if you need further study or investigation on what drill-throughs are all about.
Next Steps
- See this Microsoft documentation for more information about drill-throughs.
- Check here if you are interested in cross-report drill-through.
- Try out this tip in your own data as business requires.
- Here is an older article about this Power BI Drill Through Example

Kenneth A. Omorodion is a Microsoft Certified Solutions Associate (MCSA) with 12+ years of enterprise application experience in Power BI, DAX, Microsoft Fabric, Business Intelligence, data warehousing, SSRS, T-SQL, and Azure. Beyond his technical skills, Kenneth has expertise working with stakeholders’ and business leaders to help them better understand key insights. He has a great track record of successfully delivering full life cycle Business Intelligence and data solutions to organizations with measurable business impact.
- MSSQLTips Awards
- Achiever Award (75+ Tips) – 2025
- Author of the Year-2021
- Author Contender-2022/2023/2024


Hi, can you please let me know if we can download the data files to follow along your article? Thanks
Hi Chen,
I am not sure why you are unable to see “Preview features” on the options window though. But check with you Admin also and if you need to update your Power BI version and then click on “View” tab on your Power BI desktop, then under “Show panes” select “Format”. Then follow the rest in my blog.
Hi, I don’t have the option to add preview features under general options.
Maybe I should download the October version? do you recommend that ?
I also can’t activate preview features… under options -> global options, I don’t see preview features…
It is like I have my own self power bi desktop version that no one else has :-)
How are you ?
Thank you for replying
I already saw this post, and I can’t follow it. When I right-click the white part of the page – nothing happens. I can’t find a way to see “format” in the show panes.
How do I activate the features in previews?
Thank you
Hi Chen, you may need to ensure you have activated this option in ‘Preview Features’, even though you are using most recent PBI version, you would still need to activate the feature if its still in preview. If you have done that step, then click on your ‘View’ tab at the top of your PBI desktop –> under ‘Show panes’ select ‘Format’ –. then go follow the steps in my blog again to complete your work. Cheers!
I can’t find the page format or page info in power bi desktop 2023-september. any idea how should I di it on this version ?
Good to hear you find this article helpful. I appreciate the feedback too, thanks.
I wish I’d had this tip a month or two ago – took me forever to find how to do this.