By: Aaron Bertrand | Comments (1) | Related: > SQL Server 2019
Problem
Throughout my entire career, troubleshooting performance through execution plans has been tedious. You can find estimated plans in the plan cache, but these don't contain valuable runtime metrics that can be so important to help isolate specific issues. In single, one-off scenarios, it is easy to generate an actual plan in Management Studio, but what about when the queries are coming from an application? Particularly an application you can't control?
Solution
Up until now, there have been a variety of enhancements to execution plan troubleshooting, and I'll borrow an excerpt from a previous article of mine that talked about them:
SQL Server 2014 introduced the DMV sys.dm_exec_query_profiles, allowing the user running the query to also collect diagnostic information about all of the operators throughout the duration of the query. This information can be used after the query is finished to determine which operators actually did the most work and why. Any user not running that specific query could still get visibility into this data for any session that enabled STATISTICS XML or STATISTICS PROFILE, or for all sessions through the query_post_execution_showplan extended event – though that event specifically can put a potentially large strain on overall performance.
Management Studio 2016 added functionality to show the data moving through the execution plan in real time based on the information collected from the DMV, which makes it a lot more powerful for troubleshooting purposes. Plan Explorer also offers both live and replay capabilities for visualizing the data throughout the duration of a query.
Starting with SQL Server 2016 SP1, you could also enable a lightweight version of this data collection for all sessions, using trace flag 7412 or the query_thread_profile extended event, so that you could immediately get relevant information about any session without them having to enable anything explicitly in their session (particularly things that affect performance negatively). Much more information on this available in this blog post by Pedro Lopes.
In SQL Server 2019, this thread profile will be enabled by default – so you don't need a special Extended Events session running, or any trace flags, or STATISTICS options on in any individual query; you'll just be able to look at data from the DMV at any time for all concurrent sessions. You'll be able to turn this off using a new database scoped configuration called LIGHTWEIGHT_QUERY_PROFILING.
These options, however, require you to either catch live queries in the act via the sys.dm_exec_query_profiles DMV, or potentially place an incredible amount of overhead on most workloads. Without those, when you have a parameter sniffing scenario like this one, it can be hard to spot:
CREATE TABLE dbo.Objects
(
  id int PRIMARY KEY,
  name sysname,
  INDEX IX_name UNIQUE(name)
);
INSERT dbo.Objects(id, name)
  SELECT [object_id], name + RTRIM([object_id])
  FROM sys.all_objects; -- 2,398 rows on my system
GO
CREATE PROCEDURE dbo.FindObjects
  @pattern nvarchar(32)
AS
BEGIN
  SET NOCOUNT ON;
  SELECT name FROM dbo.Objects WHERE name LIKE @pattern;
END
GO
Now, let's call the stored procedure once with a parameter value that will be best optimized with a seek:
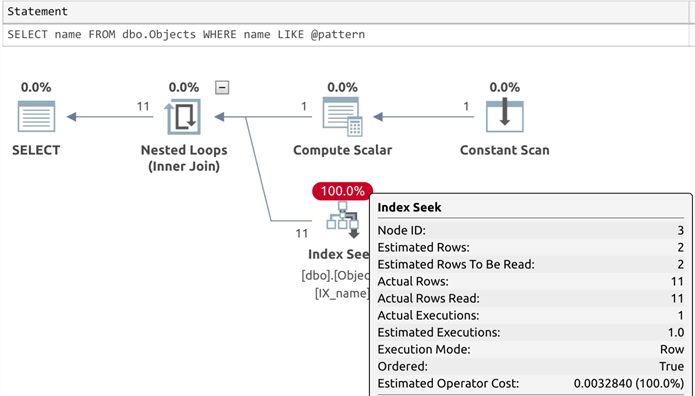
EXEC dbo.FindObjects @pattern = N'Q%';
The actual plan here, which you wouldn't always have at your disposal, looks like this (estimated rows of 2, actual rows = 11):
And then with a parameter value that should be best optimized with a scan:
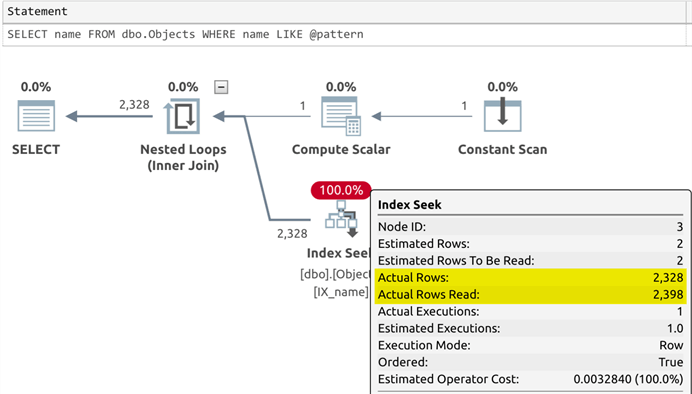
EXEC dbo.FindObjects @pattern = N'%S%';
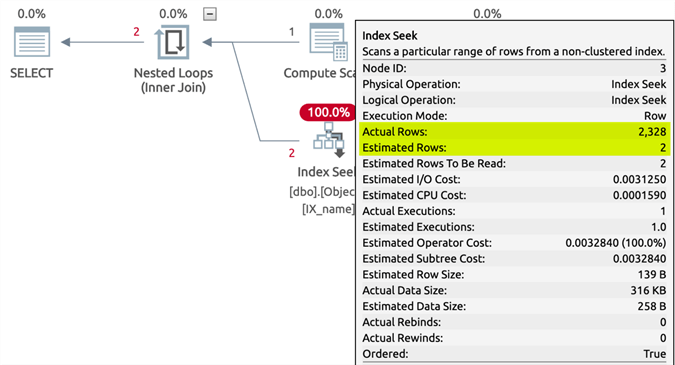
The actual plans here is slightly different (actual rows are much more realistic, at 2,328):
If we check the plan cache, we can confirm that the first plan was reused for the second query, even though this is not optimal:
SELECT
  p.usecounts,
  execcounts = s.execution_count,
  mintime    = s.min_elapsed_time,
  maxtime    = s.max_elapsed_time,
  lasttime   = s.last_elapsed_time,
  qp.query_plan
FROM sys.dm_exec_query_stats AS s
INNER JOIN sys.dm_exec_cached_plans AS p
ON s.plan_handle = p.plan_handle
CROSS APPLY sys.dm_exec_sql_text(s.sql_handle) AS t
CROSS APPLY sys.dm_exec_query_plan(s.plan_handle) AS qp
WHERE t.[text] LIKE N'%dbo.Objects%'
  AND t.[text] NOT LIKE '%dm_exec%';
Results (which show the reuse, and prove that the second execution took a lot longer, not solely because it returned more rows):

If we take that ShowPlanXML and open it with Management Studio, we see there isn't much information we can use to determine why this query was slow the last time it ran. Among other things, it only contains estimated rows, and not actual:
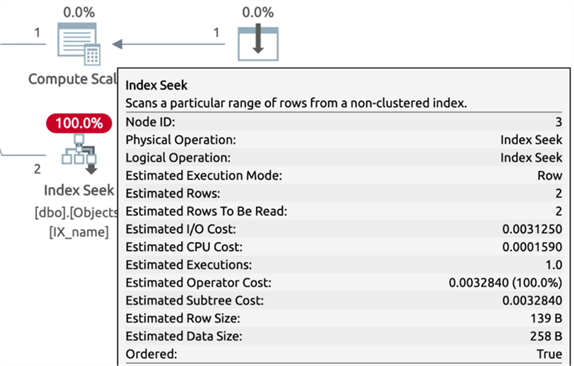
If you were unable to capture runtime metrics from the slow instances of this query, and were relying on this cached, estimated plan to see why the query has become slow recently, you'd be out of luck.
In the latest CTPs of SQL Server 2019, there is a new option. A new dynamic management function, sys.dm_exec_query_plan_stats, surfaces the last actual execution plan for any given query. This requires the lightweight query profiling functionality mentioned above, which is on by default, but you'll also need to enable LAST_QUERY_PLAN_STATS which, at the time of this writing, is off by default. So let's start by setting these options and clearing the plan cache:
ALTER DATABASE SCOPED CONFIGURATION SET LIGHTWEIGHT_QUERY_PROFILING = ON;
ALTER DATABASE SCOPED CONFIGURATION SET LAST_QUERY_PLAN_STATS = ON;

-- and then just to be sure:
DBCC FREEPROCCACHE;
Now, we can run our queries again, but in between, let's grab the plan from the new dynamic management function after each execution, and compare those. After each query:
SELECT
  p.usecounts,
  execcounts = s.execution_count,
  mintime    = s.min_elapsed_time,
  maxtime    = s.max_elapsed_time,
  lasttime   = s.last_elapsed_time,
  qp.query_plan
FROM sys.dm_exec_query_stats AS s
INNER JOIN sys.dm_exec_cached_plans AS p
ON s.plan_handle = p.plan_handle
CROSS APPLY sys.dm_exec_sql_text(s.sql_handle) AS t
CROSS APPLY sys.dm_exec_query_plan_stats(s.plan_handle) AS qp
WHERE t.[text] LIKE N'%dbo.Objects%'
  AND t.[text] NOT LIKE '%dm_exec%';
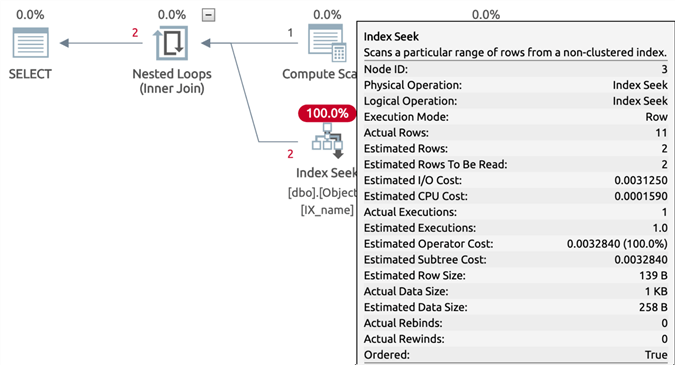
For the first query (LIKE N'Q%'), the plan has actual metrics (again, estimated rows of 2, actual rows = 11):
And for the second query (LIKE N'%S%'), we once again see the more realistic actual rows of 2,328:
This is much more useful for troubleshooting if you can't generate actual plans, can't simulate the same environment, or can't turn on diagnostics to capture actual plans for every query.
Summary
Microsoft continues to add more and more enhancements that give us a robust set of tools to troubleshoot query performance in SQL Server. This is just another example of a benefit you get from moving to a more modern version.
Next Steps
Read on for related tips and other resources:
- Extracting ShowPlan XML from SQL Server Extended Events
- SQL Server 2014 Real Time Query Monitoring
- New Features in SQL Server 2016 Service Pack 1
- New Features in SQL Server Management Studio for SQL Server 2016
- What's New in the First Public CTP of SQL Server 2019
- Different Approaches to Correct SQL Server Parameter Sniffing
- SQL Server 2016 Parameter Sniffing as a Database Scoped Configuration
- Analyzing SQL Server Performance Impact of Parameter Sniffing
- sys.dm_exec_query_plan_stats (Microsoft Documentation)
- Query Profiling Infrastructure (Microsoft Documentation)


About the author
 Aaron Bertrand (@AaronBertrand) is a passionate technologist with industry experience dating back to Classic ASP and SQL Server 6.5. He is editor-in-chief of the performance-related blog, SQLPerformance.com, and also blogs at sqlblog.org.
This author pledges the content of this article is based on professional experience and not AI generated.
View all my tips
