Problem
In operational SQL Server databases where there are many concurrent transactions, deadlocks can be a common problem. Developers and DBAs who have encountered deadlocks know there could be a real performance issue. Hence, monitoring and understanding the processes causing deadlocks is a key factor in improving database performance. Suppose, we need to monitor deadlocks in our production environment (SQL Server 2017) because sometimes we face database performance issues. Our task is to choose a corresponding way for our environment to capture and analyze deadlock information. In this article, we will illustrate how to monitor deadlocks in SQL Server Management Studio (SSMS) by using the system_health Extended Event session.
Solution
A deadlock, also called deadly embrace, occurs when transactions mutually block each other. This can happen when two or more transactions are trying to lock a resource on which the concurrent transactions have already placed locks. As a result, transactions wait for each other to release the lock to be able to lock the resource and complete. As a result, the transactions cannot be completed in this chain as they all depend on each other. This dependency is called a cyclical dependency and this process could be an endless loop if an external process did not solve this issue. Thus, the SQL Server engine has a mechanism for monitoring, detecting, and handling deadlocks. In the case of detecting a deadlock, the SQL Server engine terminates one of the processes in order to allow others to complete. The terminated process is called the deadlock victim and the database engine itself decides which process should become the victim, based on its analysis and estimations. If deadlocks are quite frequent, database performance can be significantly affected. Therefore, detecting the processes involved in deadlocks is important in terms of understanding the source of the problem. This can be helpful in designing solutions aimed at minimizing deadlocks.
There are different ways of analyzing deadlocks in SQL Server. For example, using Windows Performance Monitor, enabling trace flags 1204 or 1222, which writes deadlock information to the ERRORLOG file (by default deadlock information is not written to the ERRORLOG file), by using SQL Server Profiler or Extended Events and investigating the Deadlock Graph. In addition, we can use the System Health default trace which was introduced in SQL Server 2008 and it is built using Extended Events. For our environment, I recommend using the latest approach – the System Health default trace, because it is enabled by default and we do not need to make additional changes in our environment, such as starting SQL Server Profiler and so on. Moreover, starting from SQL Server 2012, it is possible to monitor deadlock information directly from SQL Server Management Studio and we do not need to manually run the query to get the deadlock information.
Creating a SQL Server Deadlock
Before illustrating the process of detecting deadlocks, let’s first create a test environment and simulate a simple deadlock. The following code creates two global temporary tables with sample data:
--Two global temp tables with sample data
CREATE TABLE ##TableA (
    ID INT IDENTITY,
    Val CHAR(1)
)
GO
INSERT INTO ##TableA (Val)
VALUES ('A'), ('B')
GO
CREATE TABLE ##TableB(
        ID INT IDENTITY,
        Val CHAR(1)
)
GO
INSERT INTO ##TableB (Val)
VALUES ('C'), ('D')
GO
Now, let’s open two query windows in SSMS and paste the following code to the first window:
-- code for query window 1
BEGIN TRANSACTION
SELECT @@SPID AS ProcessID
--1
UPDATE ##TableA
SET Val = 'E'
WHERE ID = 1
------------------------------------
WAITFOR DELAY '00:00:07'
--3
UPDATE ##TableB
SET Val= N'G'
WHERE ID = 1
-------------------------------------------------------------
COMMIT
SELECT Val, GETDATE() AS CompletionTime FROM ##TableA WHERE ID=1
SELECT Val, GETDATE() AS CompletionTime FROM ##TableB WHERE ID=1
On the second window, paste the code below:
-- code for query window 2
BEGIN TRANSACTION

SELECT @@SPID AS ProcessID

--2
UPDATE ##TableB
SET Val = N'F'
WHERE ID = 1
--------------------------------------
WAITFOR DELAY '00:00:07'

--4
UPDATE ##TableA
SET Val = N'H'
WHERE ID = 1

COMMIT

SELECT Val, GETDATE() AS CompletionTime FROM ##TableA WHERE ID=1
SELECT Val, GETDATE() AS CompletionTime FROM ##TableB WHERE ID=1
Then, execute the first set of code and immediately after that execute the second set of code.
As we can see, a deadlock is reported and the second transaction is chosen as the deadlock victim (Process ID 55). Therefore, only the first transaction (Process ID 54) is successfully completed and the tables are updated due to its code.

The reason for this is that both transactions are trying to update the same rows of the same tables in the opposite order. While the first transaction waits for the second to release the lock on the row of ##TableB, the latter, in turn waits for the first to release the lock on the row of ##TableA. As a result, they mutually block each other until the database engine terminates one of them (in this example, it is the second one).
Finding SQL Server Deadlock Details
Now, let’s see how we can monitor this deadlock using system_health extended event in SSMS. To do so, we connect to our instance on SSMS, go to Management > Extended Events -> system_health and right click on package0.event_file under system_health.

We can then see the below information. As we are only interested in deadlocks, we choose to filter to only find information about deadlocks. Click on “Filters…”.

The following Filters window opens.

We can set time range by checking “Set time filter”and choosing the desired time interval. Additionally, we set the name to be equal to xml_deadlock_report.

Hence, we have found information about the deadlock in our example:

We can see the information in XML format by double-clicking on the row under the “Details” tab:

We can also see the deadlock graph by clicking on the “Deadlock” tab:
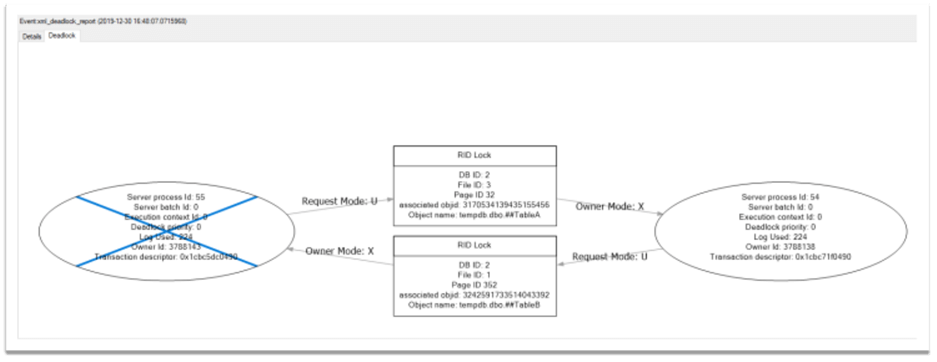
Here, we can visually investigate the deadlock. As it can be easily seen, process ID 55 has been chosen as a deadlock victim. Even more, we can see the database objects involved in this process causing the deadlock. Definitely, possessing such kind of information can be very useful while investigating deadlocks. Actually, to find all deadlocks occurring during a longer period, we just extend the time interval.

Being able to find and analyze more deadlocks during specific periods will help to understand the reasons and find solutions to avoid them.
Conclusion
In conclusion, it is possible to easily monitor deadlocks in SSMS using the system_health extended event. As compared to other ways of monitoring deadlocks, this approach is quite simple as it does not require to manually prepare the environment to capture deadlocks. This is because system_health extended event is enabled by default and integrated into SSMS. Thus, we can just set the filter to find information about the deadlocks and investigate them visually (using deadlock graphs) and in XML format.
Next Steps
For more information, please use the links below:
- Capturing SQL Server Deadlock Information in XML Format
- SQL Server Profiler Graphical Deadlock Chain
- Using a Clustered Index to Solve a SQL Server Deadlock Issue
- Transaction Locking and Row Versioning Guide
- Analyze Deadlocks with SQL Server Profiler
- Use the system_health Session

Sergey Gigoyan (LinkedIn) is a Senior Technical Architect specializing in data and databases with more than 15 years of experience. Sergey focuses on modern data architectures, database design and development, performance tuning and optimization, high availability solutions, BI development and DW design. He has worked with SQL Server, Oracle, and PostgreSQL databases, as well as cloud-based data solutions (AWS and Azure). Sergey also has extensive experience with modern data stacks such as Snowflake and dbt.
Sergey’s experience spans various industries. He had the privilege of working with IT giants such as Oracle as a Principal Data Engineer and BlackBerry as well as innovative startups. He helped deliver complex database solutions and advanced data strategies.
Sergey is also the author of “Building a Successful Career in IT – How I Did It” where he provides actionable advice on thriving in the ever-evolving IT industry.
- MSSQLTips Awards: Champion (100+ tips) – 2024 | Author of the Year – 2020


