By: Jeremy Kadlec | Comments (1) | Related: 1 | 2 | 3 | 4 | 5 | 6 | > Locking and Blocking
Problem
In your recent tips on SQL Server dead locks (How To: Graphical Deadlock Chain and Deadlock Priority Configuration) I can see the value of using Profiler to capture the process related information. Do any other options exist in Profiler to capture the information is an easier format that I can review? If so, what is the format and how can I begin to take advantages of this configuration in Profiler?
Solution
SQL Server Profiler has the ability to capture the deadlock related information as XML files which can be analyzed to determine the overall locking and blocking issue. Capturing this additional information can be beneficial if you experience long locking and blocking chains frequently.
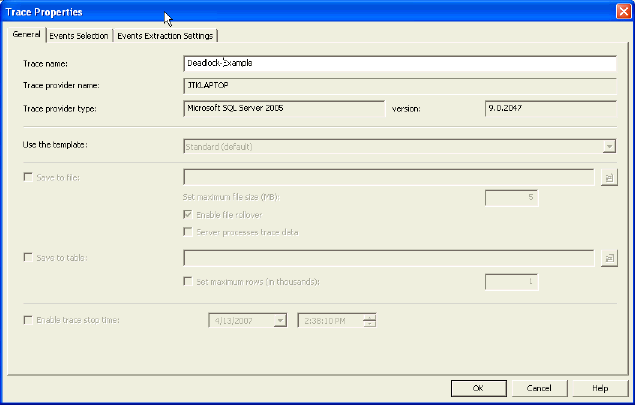
SQL Server Profiler - General Tab
Specify the name, template and save location (table or file).
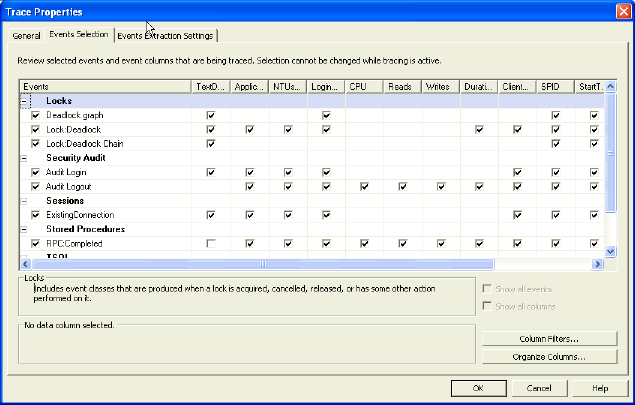
SQL Server Profiler - Events Selection Tab
Specify the deadlock graph, Lock:Deadlock and Lock:Deadlock Chain events in addition to any other counters desired.
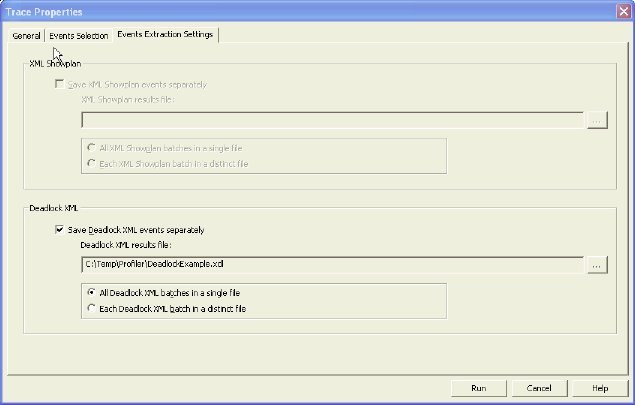
SQL Server Profiler - Events Extraction Settings Tab
Enable the 'Deadlock XML' check box and when you are prompted for the file location, browse to the needed directory and provide a file name. Once you have verified all of the configurations from all 3 tabs, press the 'Run' button to start Profiler.
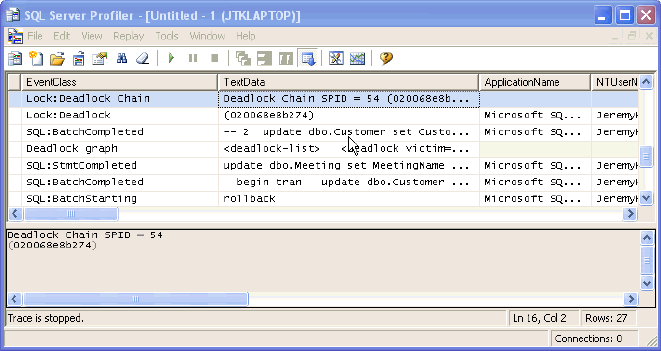
SQL Server Profiler Results
In this example, 2 processes are trying to update the same sets of data in two tables. One becomes a deadlock and the other succeeds. From the image below, you can see a portion of the deadlock chain.
XML Output
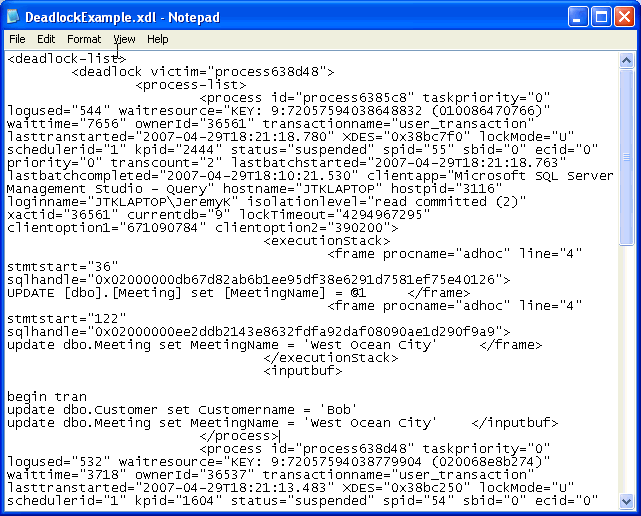
Once the Profiler session is stopped, then go and review the XML file specified on the Events Extraction Settings Tab. If you open the file with Notepad or XML Notepad, you can review the XML corresponding to the Deadlock chain that occurred. To download the example XML file click on DeadlockExample.xdl.
Deadlock - Graphical Representation
If you happen to double click on the XML file from above without reviewing it in Notepad (or XML Notepad), by default SQL Server 2005 Management Studio will load the file into a separate query window and give you a graphical representation of the deadlock similar to the Profiler representation.

XML Deadlock File Considerations
- The XML Deadlocks feature gives you the ability to capture the deadlock related information and review the deadlocks independent of the Profiler interface.
- Each of the deadlock files can be analyzed in order to determine trends with the deadlocks on your SQL Server.
- Each deadlock situation can be stored in a separate file for per deadlock analysis.
- The XML format gives you the ability to programmatically review the deadlocks.
Next Steps
- If you run into locking and blocking chains causing deadlocks frequently, then SQL Server 2005 Profiler can be used to capture the process related information to troubleshoot the situation. By using the Deadlock XML events, you have the ability to take this to the next level for analysis and troubleshooting.
- As you can see from the XML, it is helpful in determining the issue and really drilling down into the root cause, because all of the information needed for the analysis is stored in the file.
- If you are currently experiencing deadlocking, try out this new feature and see if it is helpful for the analysis process.
- If you are not currently experiencing deadlocking, keep this tip in your back pocket for the next time you encounter deadlocks.
- Check out the following MSSQLTips on SQL Server deadlocks:
About the author
 Jeremy Kadlec is a Co-Founder, Editor and Author at MSSQLTips.com with more than 300 contributions. He is also the CTO @ Edgewood Solutions and a six-time SQL Server MVP. Jeremy brings 20+ years of SQL Server DBA and Developer experience to the community after earning a bachelor's degree from SSU and master's from UMBC.
This author pledges the content of this article is based on professional experience and not AI generated.
View all my tips


