By: Alejandro Cobar | Comments (1) | Related: 1 | 2 | 3 | 4 | 5 | 6 | 7 | 8 | 9 | 10 | 11 | 12 | > Monitoring
Problem
When you are facing performance issues caused by problematic queries, one of the top things to look for is the queries consuming a high amount of CPU resources. As DBAs, we have stumbled upon the classic complaint from our end users stating that "the server is slow". Well, when that happens and it’s because of CPU spikes coming from SQL Server, you probably want to know which query (or queries) is causing the issue.
Solution
This module will gather information about the top 5 high CPU queries from all monitored instances. It will connect to each server that is listed in the inventory.MasterServerList table and capture the data for each of these instances. The connection to each SQL Server instance is based on the settings in the inventory.MasterServerList table.
The main objective of this PowerShell script is to give you a quick view of the top 5 high CPU queries from all the instances in your environment, so that you can plan your course of action.
*If you want to have more or less rows returned, you can adjust the value in the queries to customize the script.
Prerequisites
In order to use this module, you need to create the core objects found here.
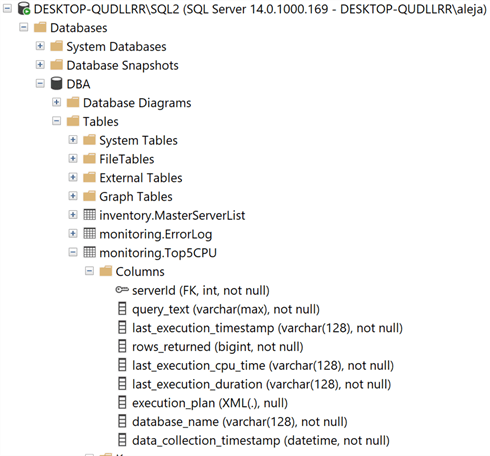
Database Objects
For this particular module, only one table will be created. If you want to add more fields to this table, make sure to adjust the structure within the PowerShell script and adapt the respective logic that will handle that additional fields.
Here is a link from Microsoft’s website if you’d like to dig deeper as to other data you can collect.
- monitoring.Top5CPU
- serverid- serverid ties back to inventory.MasterServerList
- query_text - actual query text
- last_execution_timestamp- last date and time of execution
- rows_returned - number or rows query returned
- last_execution_cpu_time- cpu time for last execution
- last_execution_duration- overall duration for last execution
- execution_plan - query plan for the query
- database_name - name of the database
- data_collection_timestamp- when data was collected
Important Note:
There will be times when you simply don’t want to collect this information from all the registered instances you have in your Master Server List. To address this, simply modify the query text inside the variable $instanceLookupQuery within the PowerShell script and you should be good to go.
There’s one very important thing to keep in mind while using this script, and it is the fact that the information that’s obtained from each instance is collected from the system DMVs sys.dm_exec_query_stats and sys.dm_exec_query_plan. This means that the results fetched from each instance will be from those queries whose execution plans are still stored in the plan cache. This will vary from system to system as many things can trigger the queries being flushed from the plan cache, like a memory constrained system, an instance restart, a server restart, or the execution of DBCC FREEPROCCACHE.
One last thing to keep in mind is the fact that the results fetched are for queries whose execution have completed, not for queries currently being executed.
PowerShell Script
The PowerShell script that creates the above object and inserts data into the monitoring.Top5CPU table is called:
- Get-MSSQL-Instance-Top5CPU.ps1.
The script has some validations that will help you check if some key elements are missing for the script to run successfully. For instance, it will confirm that the inventory.MasterServerList table exists and that it has at least 1 active instance registered to be able to have something to work with.
If you have followed along the other modules, you will notice that we have been storing all objects in "C:\temp", but you can use any folder you want. If you make a change to the central folder location, you will need to edit the first line in the following PowerShell script to specify the new folder location.
How to Use
Navigate to the folder where you created the files and you can run the PowerShell script as follows:
Option 1
- Right click on Get-MSSQL-Instance-Top5CPU.ps1 and select Run with PowerShell
Option
- Open a command window and navigate to the folder where you saved the above files and run
powershell "C:\temp\Get-MSSQL-Instance-Top5CPU.ps1"
Option 3
- Schedule this as a SQL Server Agent Job to run on a regular basis.
Option 4
- Schedule this as a Windows Task Scheduler job to run on a regular basis.
Check Creation of Database and Objects
After running the PowerShell script, we can see the objects that are created.
If we query the monitoring.Top5CPU table, we can see the data that has been collected.
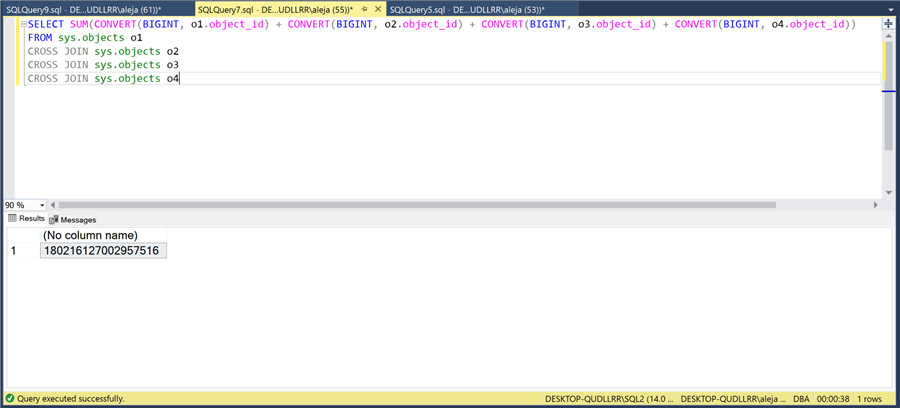
I would like to show you not only what the monitoring.Top5CPU table looks like, but also test an example high CPU query in one of my instances and see if it’s captured by the script. Here’s a screenshot of a custom test query that generates high CPU activity. As you can see, it took 38 seconds to complete and it returns only 1 row.
After capturing the data with the PowerShell script, this is what was collected:
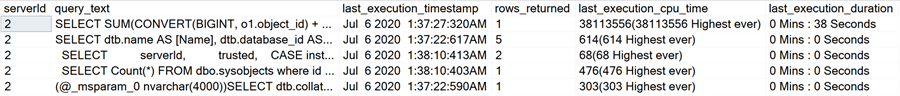
Note: The PowerShell script will store only the information from the last execution, no historical data is retained. If you’d like to keep information from previous executions, you would have to modify the script and adapt it to your particular use case.
As you can clearly see, the first row contains the precise query from the above screenshot and it correctly grabbed the information of the amount of rows returned and the time that the execution took. The screenshot was trimmed a bit so that it can be legible to the reader, but one cool thing is that this table also stores the execution plan of the queries (for detailed post analysis, if necessary), which can be very helpful in certain scenarios.
Checking for Errors
To check for errors query the monitoring.ErrorLog table using the following query:
SELECT *
FROM monitoring.ErrorLog
WHERE script = 'Get-MSSQL-Instance-Top5CPU'
If you’d like to know the SQL Server instance that got the errors, you would have to issue the query like this:
SELECT
   CASE WHEN msl.instance = 'MSSQLSERVER' THEN msl.server_name ELSE
   CONCAT(msl.server_name,'\',msl.instance) END AS instance,
   e.script,
   e.message,
   e.error_timestamp
FROM monitoring.ErrorLog e
JOIN inventory.MasterServerList msl ON msl.serverId = e.serverId
WHERE e.script = 'Get-MSSQL-Instance-Top5CPU
Useful Queries
Out of all the high CPU queries captured across all the instances, I would like to see them from slowest to fastest. The trick to make this work is to grab the "last_execution_duration" field and convert the value to seconds, so that it can be properly sorted in the intended way.
SELECT
*,
CONVERT(INT,SUBSTRING(last_execution_duration,0,CHARINDEX('Mins',last_execution_duration)-1))*60 + CONVERT(INT,SUBSTRING(last_execution_duration,CHARINDEX(':',last_execution_duration)+2,CHARINDEX('Seconds',last_execution_duration)-11)) AS 'seconds'
FROM monitoring.Top5CPU
ORDER BY seconds DESC
Download Scripts
Next Steps
- Download the PowerShell script to collect data for SQL Server Top 5 high CPU consuming queries.
- Check out the other parts of this series
- Monitoring SQL Server with PowerShell Core Object Setup
- Monitoring SQL Server with PowerShell Instance Data Collection
- Monitoring SQL Server with PowerShell Instance Jobs Collection
- Monitoring SQL Server with PowerShell Instance Jobs Last Execution
- Monitoring SQL Server with PowerShell Instance Backups
- Monitoring SQL Server with PowerShell Instance Database and Database Files
- Monitor all Indexes in SQL Server with PowerShell


About the author
 Alejandro Cobar is an MCP, SQL Server DBA and Developer with 10+ years of experience working in a variety of environments.
This author pledges the content of this article is based on professional experience and not AI generated.
View all my tips
