Problem
I am working to improve the performance of a piece of SQL Server T-SQL code and I’m just not sure much the changes I am making are helping or hurting. I need to be able to accurately track and report the performance improvement of my code changes.
Solution
The obvious answer is to look at the SQL Server query execution time, but that alone isn’t always enough to determine that there is or isn’t an improvement – or if that new index is helping. If the query was already finishing in a second or 2 that just isn’t enough precision to determine if there is improvement. There are other things like caching and parallelism that can cause query execution time to be a misleading statistic.
This tip will look at how to analyze query executions to determine how many system resources were used and how long the query took to execute with far more precision than the query execution timer in SSMS so that a more definitive answer can be determined about whether – and to what extent – query optimization was changed.
All of the demos in this tip will use the WideWorldImporters sample database which can be downloaded from here.
Measuring SQL Server query execution time with precision
Consider this query and execution.
SELECT *
FROM [WideWorldImporters].[Sales].[Invoices]
WHERE InvoiceDate='2014-03-15';

Executing this query reports an execution time of 00:00:00 on this author’s laptop. It seems unlikely that improving the speed of this query will be useful as it is already running in less than 1 second. But what if this query runs 1,000x per second? Such occurrences are not uncommon in SQL Server OLTP workloads. How can an improvement be measured against 0?
The answer is that SQL Server offers a method to get execution times measured at the millisecond level which is 1000x more precise than the timer on the bottom right of the query results pane in SSMS. The method is called STATISTICS TIME and can be enabled in one of 2 ways.
In SSMS the setting can be enabled on the session by right-clicking white space in the query pane and choosing query options. It’s all the way at the bottom of the context menu. When the menu comes up choose “Advanced” on the left then check the box next to SET STATISTICS TIME.

The best part about this method is that it is not limited to SSMS connections. This feature can be enabled on SSMS or any SQL Server session by running this simple command.
SET STATISTICS TIME ON;
Now that the feature is enabled the query can be executed again and it will include additional output. The output of STATISTICS TIME can be found on the messages tab in SSMS. To read this information in other applications the connection must be able to read the InfoMessage event. It can be read in PowerShell by using the – verbose option of the invoke-sqlcmd cmdlet. The output from the messages tab of SSMS is below.

Focus on the “SQL Server Execution Times:” section. The output shows that this query executed in 19 milliseconds. Running it repeatedly showed numbers between 12 and 30 milliseconds on this laptop. With this level of precision measuring improvement will be far easier.
Measuring SQL Server resource usage for a query
SQL Server offers a method to measure the resources used by the query. This feature is called STATISTICS IO and it is enabled and used very similarly to STATISTICS TIME. Looking at the screenshot above the checkbox for STATISTICS TIME is immediately beneath the highlighted checkbox. It has a similar query also.
SET STATISTICS TIME ON
This feature and the prior feature can be enabled at the same time using this query.
SET STATISTICS TIME,IO ON;
Enable the feature and then execute the same query for a 3rd time. Now there will be more output on the Messages tab.

There will be one new row in the output for every table referenced in the query. Since this query only touches one table, there is only one new row listed. It shows that the table ‘Invoices’ was queried and there is a lot of information on the row — more than the screenshot even includes. Focus should be placed on the “logical reads” section. This statistic shows the number of 8kb data pages that were read from this table in total. The “physical reads” section shows how many of those reads were taken directly from disk. Since this reports a zero that indicates all pages were found in the buffer pool and were read from memory.
Note that the execution time result remains since both features are enabled. The execution time output also includes the CPU time used by the query. This is another great metric to watch when working to improve the query.
When combined, the CPU time, amount of data pages read (from disk or memory), and execution time measured to the millisecond provide a wonderful baseline from which to compare future executions for performance improvement.
Comparing multiple SQL Server query executions
SSMS offers a tool that allows the user to compare multiple query executions and easily compare the performance of them. This feature is called Client Statistics. It can be enabled in one of 3 ways – a button, a keyboard shortcut, or a context menu. The button is shown in the screenshot below. The keyboard shortcut is Shift+Alt+S. Finally, it can be found near the bottom of the context menu of the query text pane labeled “Include Client Statistics”.

Running the sample query for the 4th time now includes a 3rd tab in the output. This table is labeled “Client Statistics”. For the purposes of this demo, the query was run a total of 3 more times after the client statistics were included.

The output is really great! It shows the execution time along with some useful statistics for each of the 3 new executions so that they can be compared. The most useful line for this demo is the “Wait time on server replies” as this is the number of milliseconds that were spent waiting for SQL Server to execute the query. Nothing was changed between executions so most of the values are the same or very similar. As changes are made to the query or to the schema of the database the query can be executed again and the values compared to see if there is an improvement or not.
Improving SQL Server query execution
The sample query that has been run during this tip queries against the column InvoiceDate which is not indexed. The query below will create an index on the column InvoiceDate of the Sales.invoices table. For this demo the index creation will be done in a different session than the one used for testing thus far.
CREATE NONCLUSTERED INDEX MAKE_ME_FASTER ON [Sales].[Invoices]([InvoiceDate])
Now that the index has been created the sample query can be run one final time. STATISTICS TIME, STATISTICS IO, and Client Statistics should all still be enabled. For the purpose of this demo, the query was run 3 more times to better show the pattern.
The first values checked are those from STATISTICS TIME and STATISTICS IO. This output shows that after the index was created the execution time dropped to below 1 ms from a value between 12 and 30 as seen above. The number of pages read dropped by over 99% from 6,558 to 2 and the CPU time dropped from 16ms to under 1ms. This proves that the index creation definitely helped the query in a significant way.

Next, the output from Client Statistics should be reviewed. The screenshot below shows 6 executions total. 3 came before the index was created and 3 after.
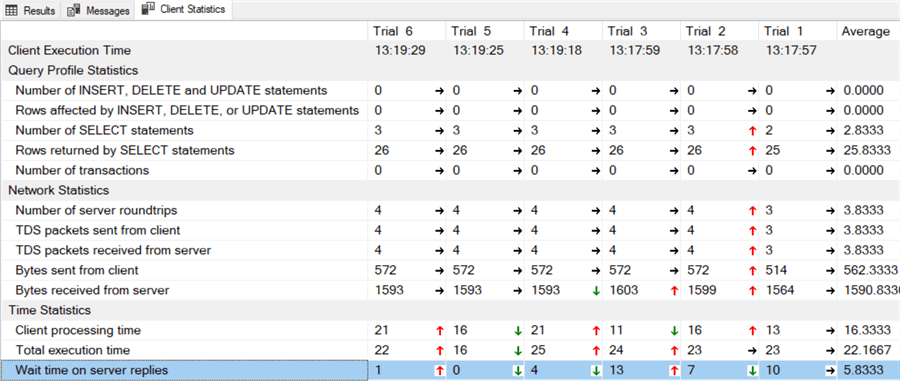
The output shows that the 3 executions before the index were created took 10, 7, and 4 milliseconds respectively. After the index was created the execution times dropped to 4, 0, and 1 millisecond(s) each. This further confirms that the query is running much faster and doesn’t require the programmer write down or remember any previous execution times.
Next Steps

Eric has been a SQL Server DBA and Architect in the legal, software, transportation, and insurance industries for over 10 years. Currently he is the Sr Data Architect for Squire Patton Boggs, a leading provider of legal services with 47 offices in 20 countries.
Eric is a 2018-2019 Idera Ace and has co-authored 2 Idera Whitepapers.
He has been a presenter at PASS Summit, IT/DevConnections, SQLSaturdays, the in.sight transportation conference, and the Ohio North SQL Server User’s Group.
- MSSQLTips Awards: Author of the Year Contender – 2021, 2022 | Trendsetter (25+ tips) – 2021