Problem
SQL Server Reporting Services (SSRS) is great if you want to build reports and charts, but it may not be available for you to use. Also, you may just have the need to create some quick charts or reports based on your data without using SSRS. In this article, we look at another way to generate charts for your data using Python Flask and reading the data from SQL Server.
Solution
Below is the workflow for this solution. We will be using Python and SQL Server to query data from a database table and render the chart in a web page as shown below. There are some additional modules that will be used as stated below.

Below are the different resources we will be using.
| Resource | Description |
|---|---|
| Flask | Flask is a lightweight Web server gateway Interface (WSGI) which allows for Rest / Web application endpoint hosting. In this example it will interact with SQL Server through SQLAlchemy, PYODBC and Pandas. |
| PYODBC | PYODBC is a python module which simplifies the connection process to ODBC for Python |
| Pandas | Pandas is a high-performance data analysis and data manipulation module which utilizes array-based storage for Python |
| SQLAlchemy | Connection string generation framework / data and transaction manager Python Module |
| ChartJS | A java script library for data visualizations, includes a wide array of chart types and display options |
Step 1 – Initiate the Database
For this example, we will be using a SQL Server backend to connect to and feed the front-end application. Run the Displaying Data With Flask And SQLServer Init.sql script to generate the example database and sample data that we will be displaying on our web page.
Step 2 – Unzip the Displaying Data with Python Flask and SQL Server File
Download the zip file that contains two folders, one app.py file and a requirements.txt file. Note, this download file is 70MB.
Here is a brief explanation of each item in the zip file:
| Resource | Description |
|---|---|
| App.py | Holds all the Python import statements and routes for the web application |
| Templates Folder | Holds the HTML5 files that will display the report from the SQL Server query data |
| Venv Folder | The virtual environment for our application, holds the dependent libraries necessary to host and display the report |
| Requirements.txt | Holds a list of Python libraries required to be installed by pip |
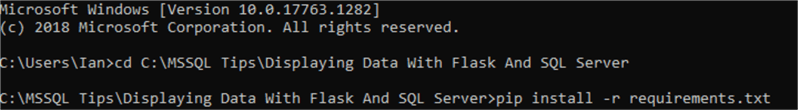
To install each of the required packages, open the directory where you extracted the zip.
Issue the following command to install the prerequisite Python modules:
pip install -r requirements.txt
Step 3 – Review and Edit app.py
To better understand what is actually happening, before we run our application let’s review and edit the connection in our app.py file.
The SQLAlchemy library is responsible for the authentication into the SQL Server instance, therefore we must edit the following python code in lines 12-14:
ServerName =   '' #Change to Your Server
InstanceName = '' #Change to your Instance Name, if you do not have an instance name leave blank.
DatabaseName = 'FlaskMVC'
To find your server and instance name, run this query: select @@servername
Replace the values from the query with the corresponding server and instance name of your environment.
We are not specifying a SQL Server account, SQLAlchemy infers to use integrated Windows authentication.
Additional details regarding manipulating this logic can be found on the SQLAlchemy connection string documentation page.
Step 4 – Review and run the application
After the engine is initialized, a connection can be made with lines #24-25 in the app.py file:
with MSSQLengine.connect() as con:
    rs = con.execute('SELECT YEAR(SALEDATE) AS [Year],SUM(SALESAMOUNT) AS SalesAmount,ProductName FROM SalesData GROUP BY YEAR(SALEDATE),ProductName ORDER BY PRODUCTNAME,[YEAR]')
This query will provide the source data necessary to feed the front end of our application and display the data from our database. The data is broken out by 4 products over 10 years, the data from the query will be read into four separate lists and combined into a Pandas data frame object.
The way the web page picks up the data frame is in line #46 :
return render_template(chartjs.html', data = data)
The display layer utilizes an external data reporting JavaScript framework known as ChartJS. ChartJS offers an extensive number of chart types and options and it is free. For this example, we used a simple line chart.
Now all we need to do is open a command prompt, navigate to the location of the app.py and issue the following command:
Cd C:\MSSQL Tips\Displaying Data With Flask And SQL Server
Python app.py
We should receive a message as follows:

In a browser, go to localhost:8081 to view the report!

Next Steps
- Try the procedure SPX_RESET_SALES_DATA in the FlaskMVC data base to reload the sales database with random values and see the charts visual change.
- Review the connection string properties in the SQLAlchemy link if you want to try to use SQL Server authentication instead of integrated Windows authentication.
- Review the plethora of reporting charts available in ChartJS, try different charts and options.
- Manipulate the query and connection string to pull some of your own data to display

Ian Fogelman is a MCSE in Data Management and Analytics and Amazon Web Services Certified Solutions Architect. Ian currently works as a Senior ETL Developer with American Family Life Assurance Company. Ian has over 7 years of experience in database technologies primarily in SQL Server, reporting and data integrations. Other technologies that Ian enjoys are Docker, data science and predictive analytics, AWS – Deep racer and Linux. Ian is also the founder and primary contributor to SuperFunSql.com where he covers many topics such as AWS services, Machine Learning, Python, SQL Server, Power BI and various programming language topics.
- MSSQLTips Awards: Rookie of the Year Contender – 2020


There is something missing in the file , result is displaying on the console but its not showing on the chart.