By: Kenneth A. Omorodion | Comments (2) | Related: > Azure
Problem
Sometimes, some stakeholders in an organization would prefer to create Azure metrics dashboards in an external tool like Power BI. This enables embedding the visuals in their websites or SharePoint, creating more complex reports in Power BI, and provides a common interface for some stakeholders that are not accustom to the Azure UI.
To be able to create Power BI visuals utilizing Azure Resource data, we need to first create a Log Analytics workspace and then enable logs for the Azure Resource we need to create visuals for in Power BI. See my article, Setting up Azure Log Analytics to monitor Performance of an Azure Resource for more information on this. Log queries are then used to query the data collected in the Azure Monitor Logs, from which we can then generate queries to be used in Power BI. Let us see how this is done.
Solution
This solution has been separated into five different steps as follows:
- Navigate to the Log Analytics workspace where the Azure Monitor Logs are collected
- Select a Resource Type to query its data
- Export the Power BI (M Query) for the metric
- Create the visual in Power BI Desktop
- Publish to Power BI service and configure the Data source Credentials
Step 1: Navigate to the Log Analytics workspace where the Azure Monitor Logs are collected
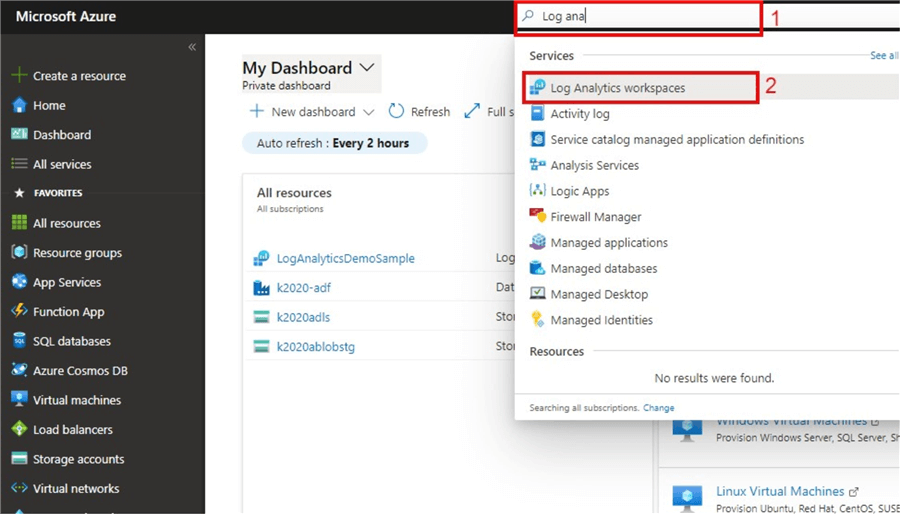
To do this we first log into our Azure account, then search for "Log Analytics workspaces" on the search bar at the top of the page as seen in the diagram below. Please note that there are several ways to navigate to the Log Analytics workspaces, and I have just used one approach in this tip.
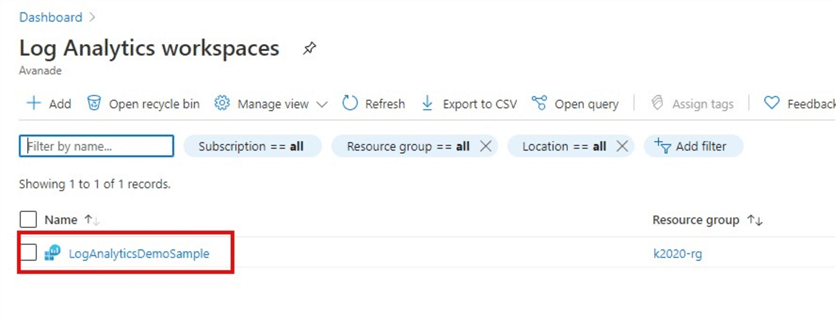
Click on the Log Analytics workspaces, and this should navigate you to the "Log Analytics workspaces" page where you can select the Log Analytics workspace you have enabled and the Azure Monitor Logs on as shown in the diagram below.
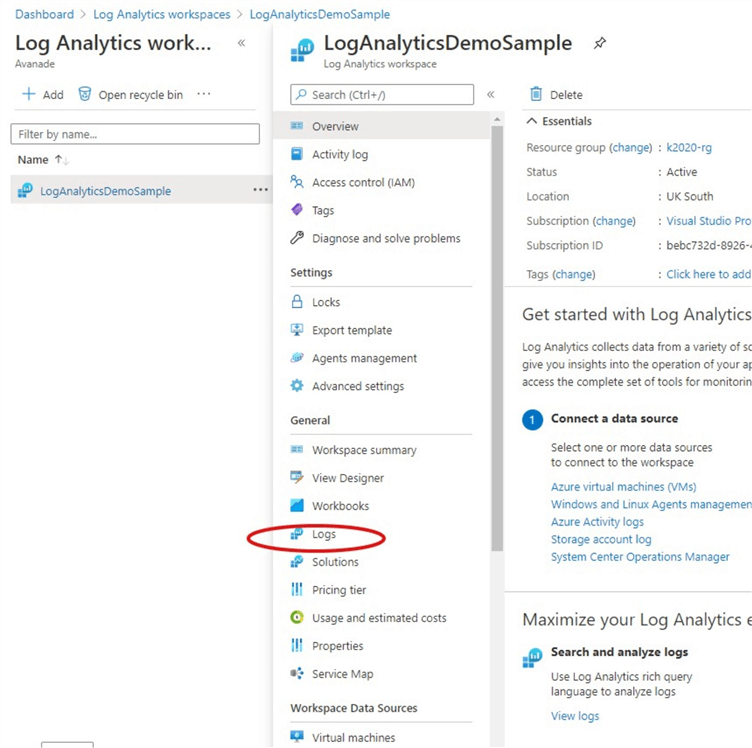
This would take you to the Workspace environment where you can view the different blades for the workspace in Azure. But for the purpose of this tip, we are only going to be looking at the Logs blade. See diagram below.
Step 2: Select a Resource Type
Next is to click on the Logs blade and select the Resource Types that we wish to query its data. For illustration purposes in this tip, I have chosen to select the "Virtual machines" Resource Type as seen in the diagram below.
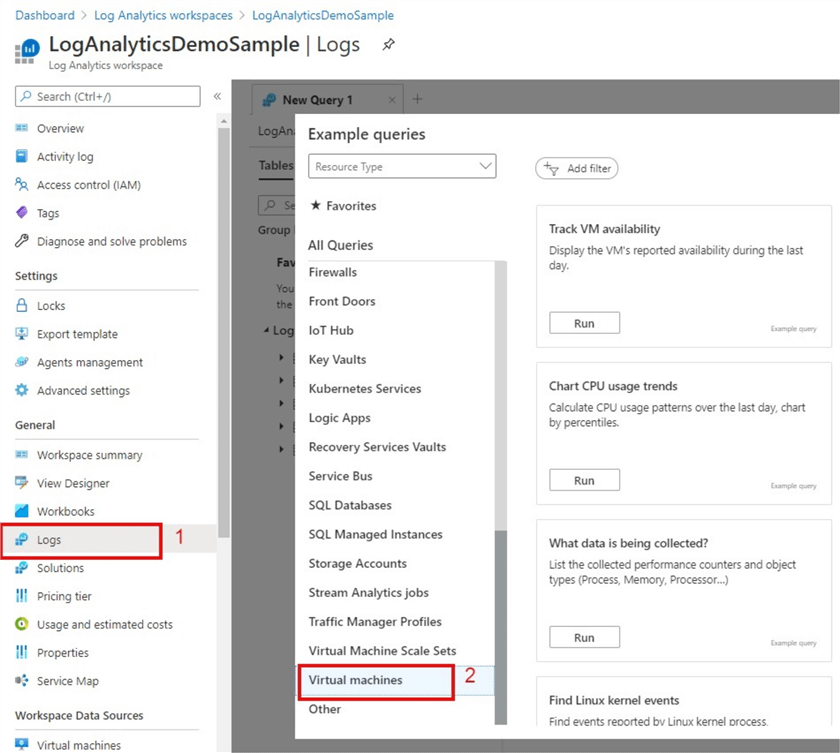
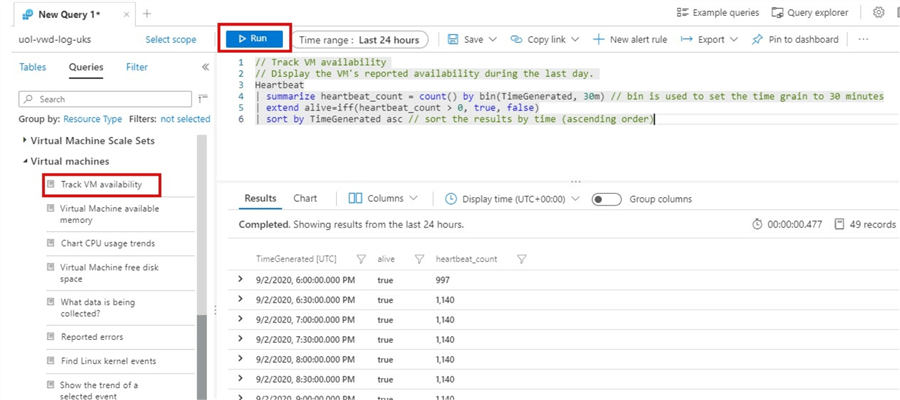
To start with, I will just click the "Run" on the "Track VM availability" as shown in the diagram above, this would then expose the default Kusto query used to generate the VM availability metric in the Virtual machines Resource Type. A Kusto query is simply described as a read-only request to process data and return results, just like SQL queries in most ways. For the purpose of this tip, I am not going to talk more about Kusto queries here, but you can read more about Kusto queries and its syntax here. Moreover, the Kusto query language allows you to join data from more than one table, it can aggregate large datasets and with minimal code it can perform complex operations. The Kusto queries can answer virtually any question if the supporting data has been collected, and the right query is written.
The diagram below shows the default Kusto query to generate the VM's reported availability during the last day.
To adjust the query to show VMs reported availability in a bin of every one-hour, we adjust the query as shown below.
// Track VM availability
// Display the VM's reported availability during the last hour.
Heartbeat
| summarize heartbeat_count = count() by bin(TimeGenerated, 1h) // bin is used to set the time grain to 1 hour
| extend alive=iff(heartbeat_count > 0, true, false)
| sort by TimeGenerated asc // sort the results by time (ascending order)
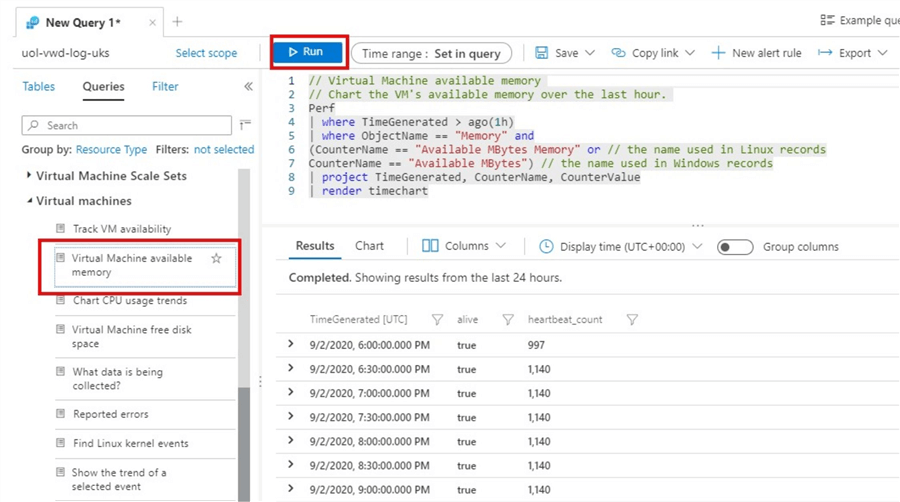
To select a query for another default metric like "Virtual Machine available memory" we just need to click on the metric under the Virtual machines Resource Type then the default Kusto query is revealed in the Query Editor as shown in the diagram below. This current query looks at VMs available memory in the last hour. Please do note that you can create more complex custom queries to meet your project needs accordingly. The sample queries used here are for illustration purposes only.
To adjust the query to show VMs available memory in the last seven days we adjust the query as shown below.
// Virtual Machine available memory
// Chart the VM's available memory over the last seven days.
Perf
| where TimeGenerated > ago(7d)
| where ObjectName == "Memory" and
(CounterName == "Available MBytes Memory" or // the name used in Linux records
CounterName == "Available MBytes") // the name used in Windows records
| project TimeGenerated, CounterName, CounterValue
| render timechart
Step 3: Export the Power BI (M Query) for the metric
To export out the M query to be used in connecting to Power BI and creating the visual for a particular metric in Power BI, we need to run the Kusto query for a particular metric in a Resource Type like the ones we have done in Step 2. Then we click on "Export" at the top right corner of the Query Editor as shown in the diagram below. This reveals the "Export to Power BI (M query)" option.

When we click on the Export to Power BI (M query) option, it downloads the M query as a Notepad text document as seen in the diagram below.
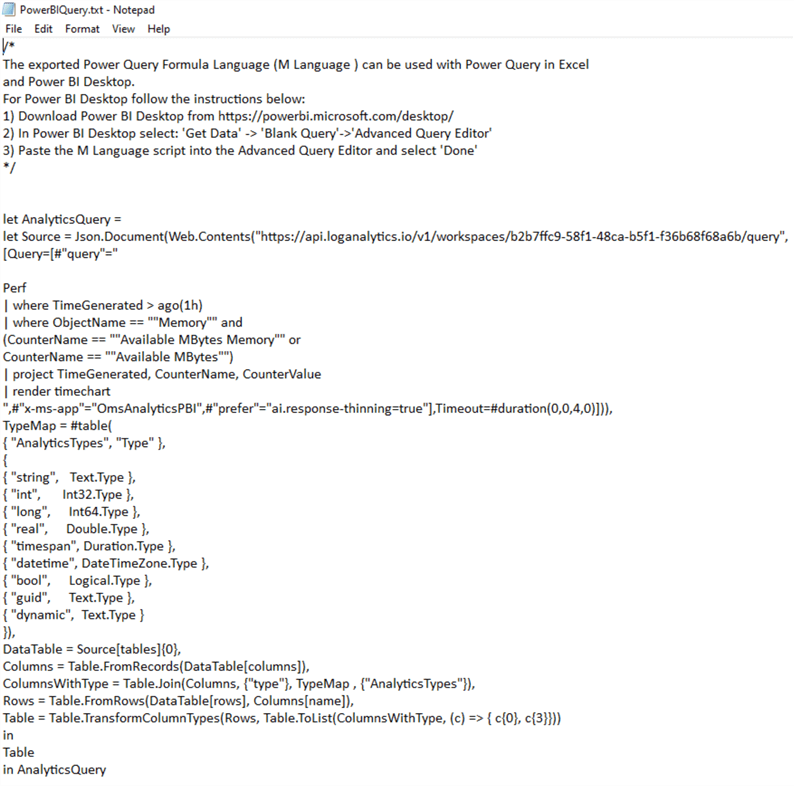
Open this download in Notepad and copy the code (you can just simply copy from the "let" and leave the upper comments). See an example of a copied M query as below.
let AnalyticsQuery =
let Source = Json.Document(Web.Contents("https://api.loganalytics.io/v1/workspaces/b2b7ffc9-58f1-48ca-b5f1-f36b68f68a6b/query",
[Query=[#"query"="
Perf
| where TimeGenerated > ago(1h)
| where ObjectName == ""Memory"" and
(CounterName == ""Available MBytes Memory"" or
CounterName == ""Available MBytes"")
| project TimeGenerated, CounterName, CounterValue
| render timechart
",#"x-ms-app"="OmsAnalyticsPBI",#"prefer"="ai.response-thinning=true"],Timeout=#duration(0,0,4,0)])),
TypeMap = #table(
{ "AnalyticsTypes", "Type" },
{
{ "string",   Text.Type },
{ "int",      Int32.Type },
{ "long",     Int64.Type },
{ "real",     Double.Type },
{ "timespan", Duration.Type },
{ "datetime", DateTimeZone.Type },
{ "bool",     Logical.Type },
{ "guid",     Text.Type },
{ "dynamic",  Text.Type }
}),
DataTable = Source[tables]{0},
Columns = Table.FromRecords(DataTable[columns]),
ColumnsWithType = Table.Join(Columns, {"type"}, TypeMap , {"AnalyticsTypes"}),
Rows = Table.FromRows(DataTable[rows], Columns[name]),
Table = Table.TransformColumnTypes(Rows, Table.ToList(ColumnsWithType, (c) => { c{0}, c{3}}))
in
Table
in AnalyticsQuery
Step 4: Create the visual in Power BI Desktop
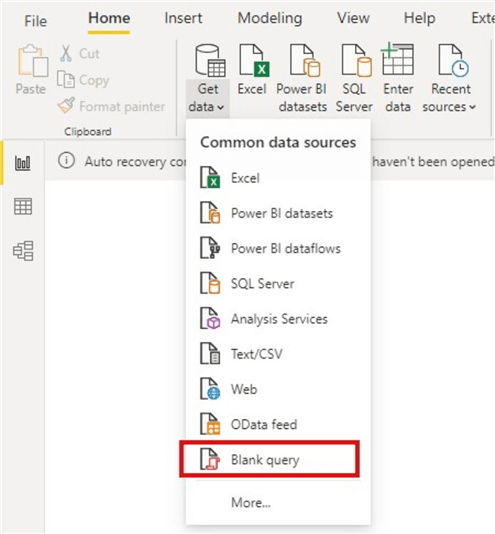
Open Power BI Desktop and paste the copied M query into a Blank Query source as shown in the diagram below.
Then click on "Advanced Editor", paste the M query you copied earlier into the editor as shown in the diagram below. Then click "Done".
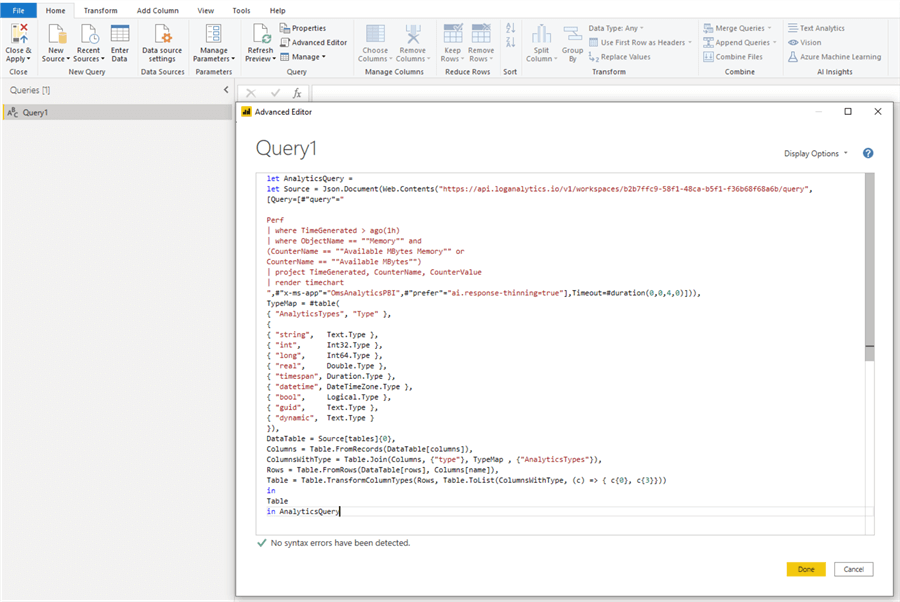
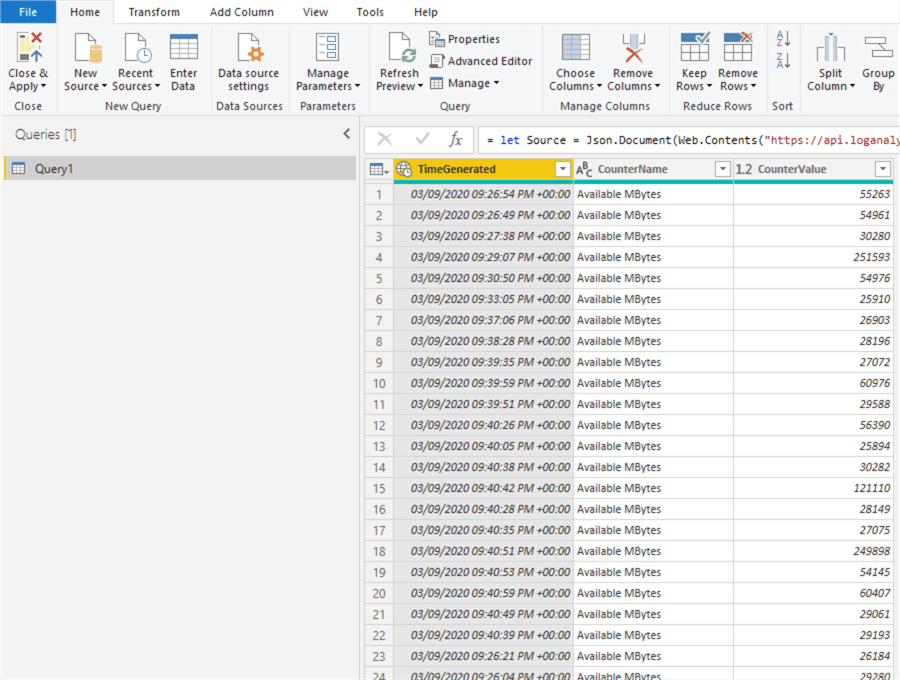
This then creates the dataset as shown in the Power Query Editor in the diagram below. You can now do any data cleansing or transformation as you would any other dataset in Power Query. You can also change the name of the dataset, but in this example, I have left it as "Query 1" just for illustration purposes. Then Close and apply the query.
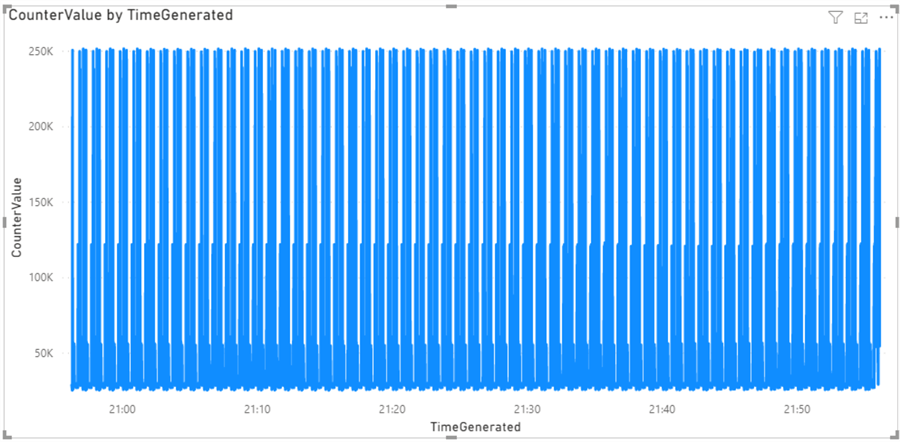
To create a visual for this dataset (metric) I have created a line chart with "TimeGenerated" in Axis and "CounterValue" in Values as shown in the diagram below.
You need to repeat this process from Step 1 to step 4 for each metric you need to create, although you can adjust the same queries within Power BI to generate a different metric look. For instance, instead of "VMs Available memory over last hour" we can adjust the M query in Power BI to look at a time range for the last 7 days instead, so we do not have to go back to the Kusto query to adjust this before copying to Power BI again. Also note that you can also create a more complex query before exporting to Power BI.
Step 5: Publish to Power BI service and configure the Data source Credentials
After creating the visuals for each metric as required then save and publish to the Power BI service. You would still need to configure the Data source credentials so that the dashboards can refresh. See the diagram below for an error related to correcting the credentials.
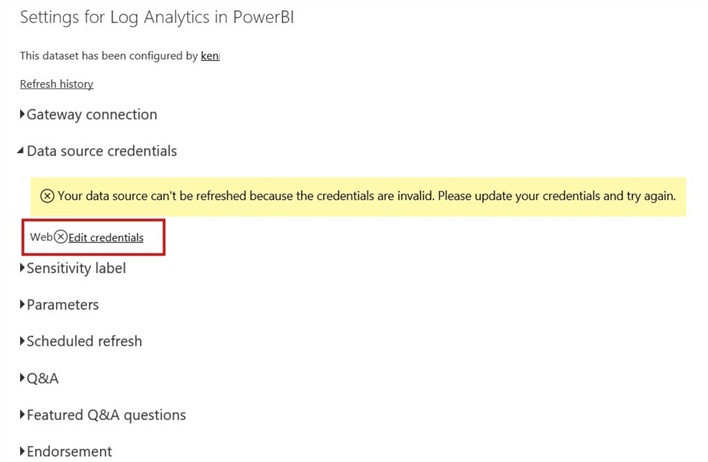
Click on the "Edit Credentials" and you only need an "OAuth" and "Organizational" authentication to configure this. After authentication, you should now be able to see the warning sign disappear as seen in the diagram below.
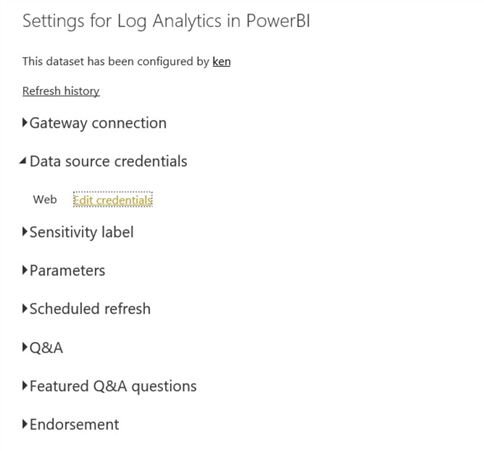
Finally, you can then schedule your refresh accordingly.
Next Steps
- See more information on Kusto queries here.
- You can read more about simple Log experience here.
- You can read more information on Azure Monitor for VMs here.
- Get some more sample Kusto Queries here.
- Read my other tip about Setting up Azure Log Analytics to monitor Performance of an Azure Resource here.
- SquaredUp.com has this comprehensive Kusto Query tutorial that is worth checking out too.
- You can also get more information on Kusto Queries and the syntax on Azure Training Series.
- Try this tip out in your own data as business requires.
About the author
 Kenneth A. Omorodion is a Business Intelligence Developer with over eight years of experience. He holds both a bachelor’s and master’s degree (Middlesex University in London). Kenneth has the MCSA, Microsoft Data Analyst - Power BI and Azure Fundamentals certifications. Kenneth is a Microsoft Certified Trainer and has delivered corporate training on Power BI, SQL Server, Excel and SSRS.
This author pledges the content of this article is based on professional experience and not AI generated.
View all my tips


