Problem
Recently I was working on a client project and there was a requirement for me to create a table visual so that the business users can export the underlying data to Excel/CSV and further analyse the data according to their needs. As part of the requirement, the client also wanted me to create a description within the report on how the business users can export the Power BI table data to Excel.
My initial plan was to create a Card visual or Text box and write a description on how this is done to help the business users. Later, I figured out that creating a GIF page and using the GIF as a tooltip would be the better approach. This led me to creating an animated GIF in Power BI. I have detailed in this article how I was able to achieve this. Please note that this could have been done in several other ways and that GIFs can be created for many other tasks in Power BI. This is the way I approached the task and found success.
Solution
I will walk through this step-by-step basis as outlined in the four steps below.
- Install the ScreentoGIF GIF creator
- Record the action you want to show in Power BI
- Save the file as a *.gif file in your chosen location
- Add as an Image to Power BI
STEP 1: Install the ScreentoGIF GIF creator
There is other software that can achieve the same thing as ScreentoGIF to create good GIF recordings, but I have chosen ScreentoGIF for its ease of use and clear recordings.
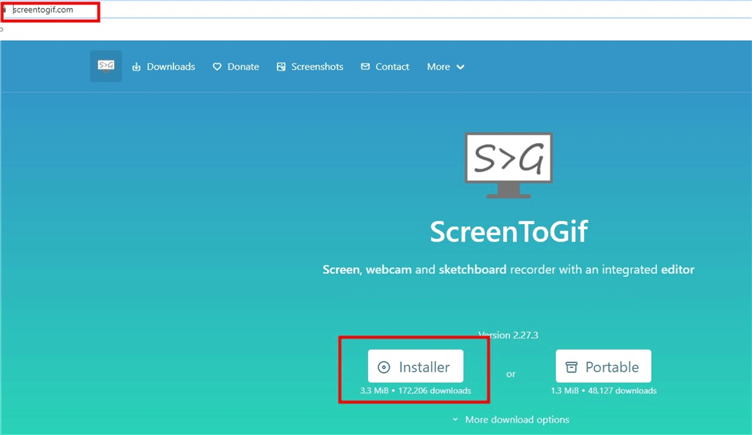
To install the software, go to www.screentogif.com as seen in the diagram below and click on "Installer".
Once installed, you should be able to see the shortcut on your desktop (this depends on how you installed it though).
STEP 2: Record the action you want to show in Power BI
To record the actions to show up in Power BI, you should open your Power BI either in the service or Power BI desktop and then open the ScreentoGIF shortcut on your desktop. Just like a macro in Excel, record every action you need to demonstrate to your business users on how to perform an action in your report in Power BI. I have done my best to detail these as seen in the diagrams below.
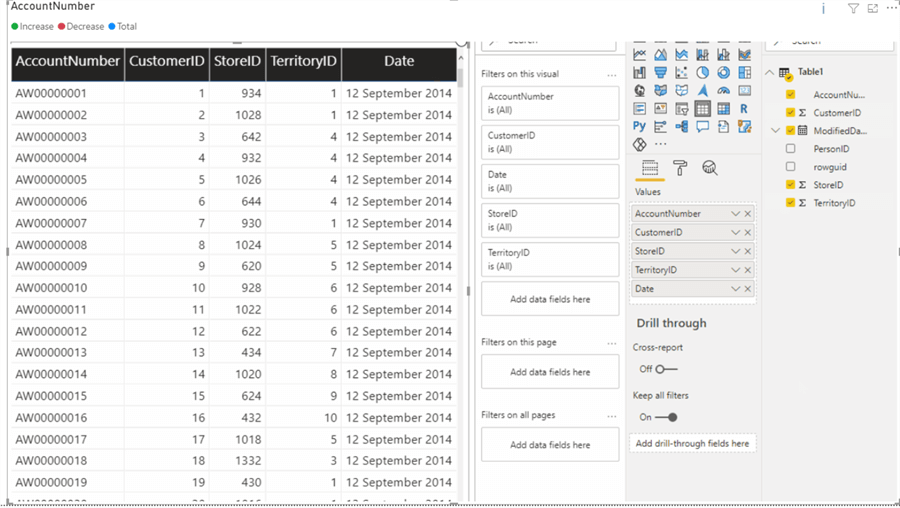
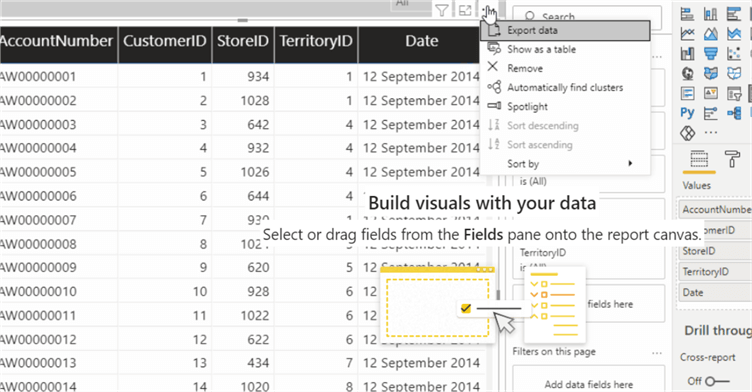
First, let’s say I have an already created report in Power BI as shown below.

I now need to open the ScreentoGIF app on my desktop over the Power BI report to record a GIF on how to export this table data to Excel as seen in the diagram below.
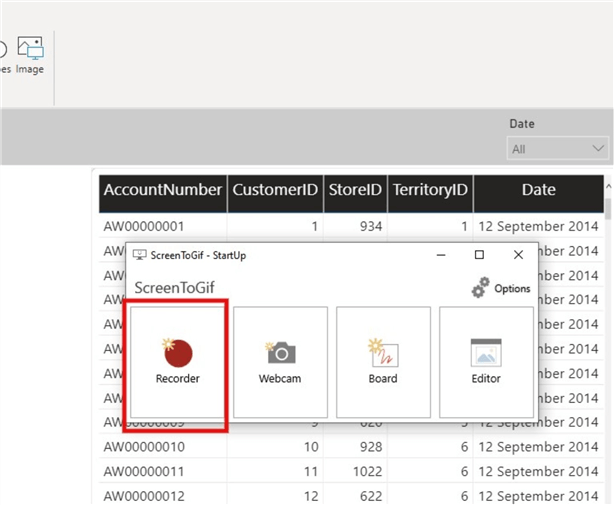
After clicking on "Recorder", a capture screen is spread over the Power BI UI and you can now adjust the screen size of the ScreebtoGIF recorder as needed. Click on "Record" as seen in the diagram below.
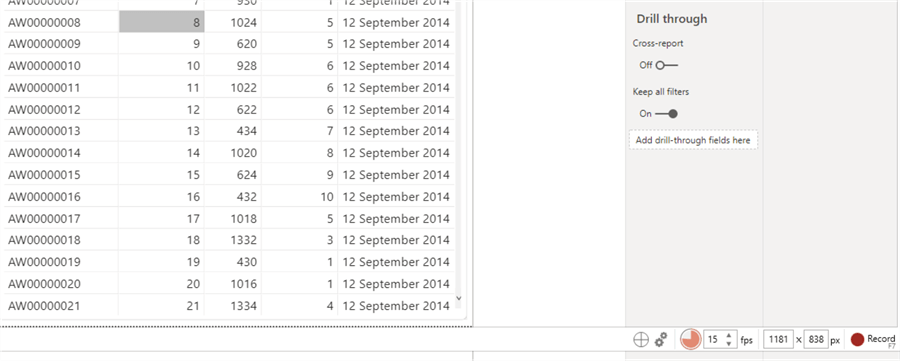
Once the recording starts, a timer is seen at the top right of the screen. Once you are okay with the actions recorded, click on "stop" and the app will automatically take you to the editing page where you can edit and/or save the recording.
STEP 3: Save the file as a *.gif file in your chosen location
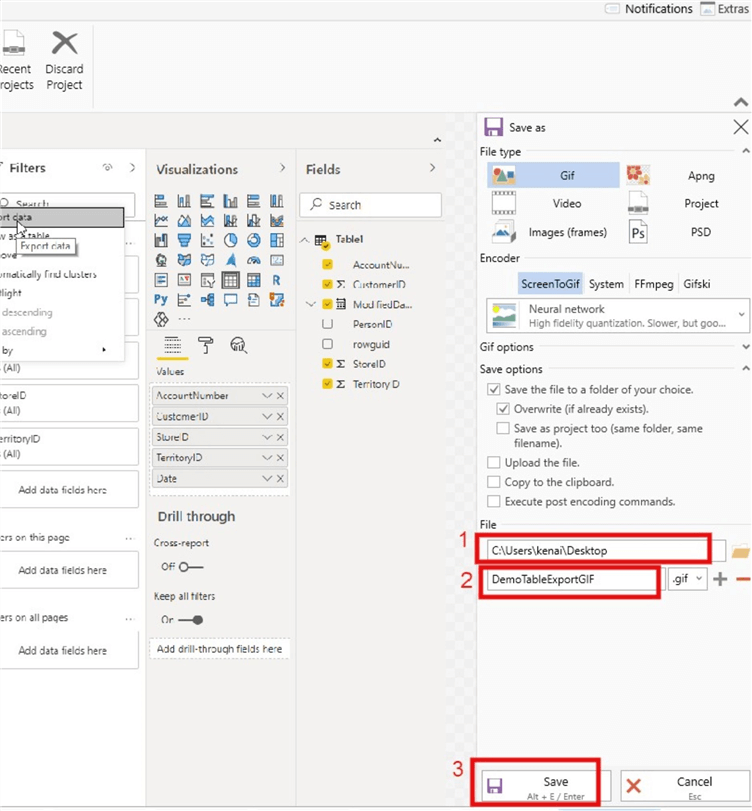
To save the recording, click on "File" and then "Save As" as seen in the diagram below.
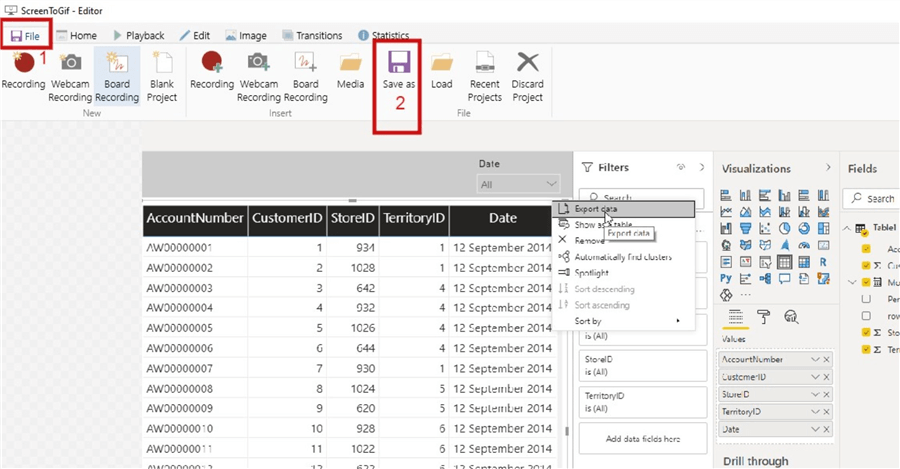
After clicking "Save As", a window opens at the right side of the screen where you can enter a location and a name for your GIF. For this article, I have saved mine in my PC desktop folder and called it "DemoTableExportGIF" as seen in the diagram below. You can leave the other properties in default if you are okay with that. I have used the default settings in this post. Then, save it.
Once saved, you would be able to see the GIF recording on your desktop.
STEP 4: Add as an Image to Power BI
Now we are ready to use the recorded GIF in Power BI. Please see this tip by SQLityBI on ways to use GIFs in Power BI. However, in this article I will be demonstrating two ways to bring GIFs into Power BI.
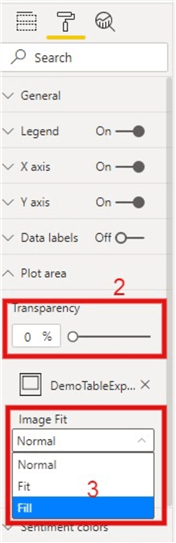
We need to bring GIFs to Power BI. We can achieve this by using any visuals that has "Plot Area" in its Format properties. These include all Area Charts, Bar Charts, Column Charts, Line Charts, and Waterfall Charts. All that we need to do is select one of these charts and drag any field into the category area. Go to the "Format" settings and expand the "Plot area" section as shown in the diagram below.
Click on the "Add image" spot to bring in the GIF created earlier. Then, reduce the transparency to zero from 100 and change the "Image Fit" to "Fill" as seen in the diagram below.
After this you can now expand your visual and the GIF is live as seen in the static diagram below.
We can improve the view of the GIF by removing the visual header and any other things like legend, X and Y axis titles. To do these we must go back to the Format settings and deactivate the X and Y axis titles, and/or deactivate the Legends and Visual title. After this the GIF will be much better fit for its purpose as seen in the static diagram below.

Another way to bring in GIF recordings to Power BI is to use the "Page background" in the Format settings when applied on a blank Power BI desktop canvas. This is very similar to the set up as discussed in the earlier method of using any visual with "Plot area". See the diagram below which illustrates this.
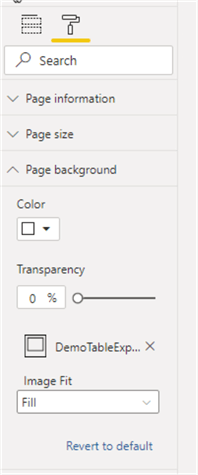
Once the "Image Fit" is changed to "Fill" and "Transparency" reduced to Zero from 100, you will see the GIF recording playing in Power BI canvas. If you are using the new Power BI default canvas you will observe that the GIF is overlayed by the default build visuals image on each canvas as seen below.
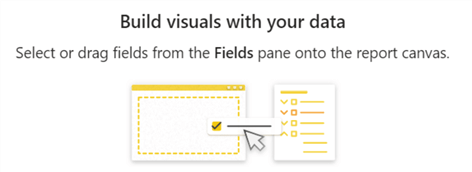
The overlayed GIF would be like the diagram below.
To resolve this, we need to do the following:
- Click on Card Visual
- Create a simple measure with DAX Measure = "."
- Drag the measure into the card visual
- Go to the Format settings and change the color of the "Data Label" to white color to remove the dark spot
- Deactivate "Category"
- Set "Background" transparency to 100
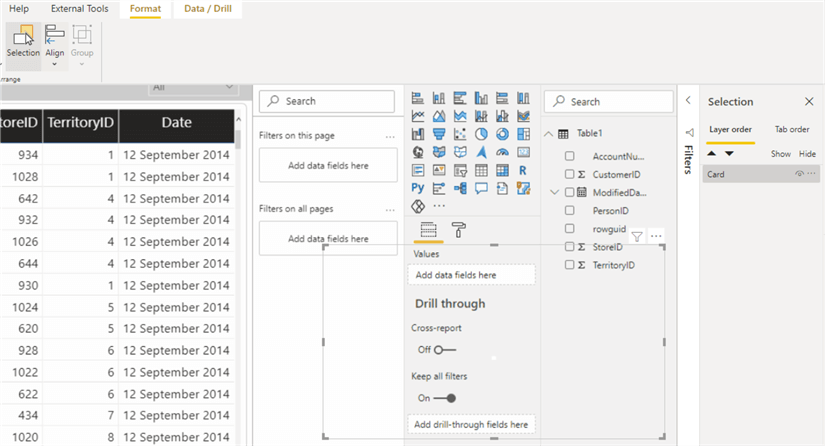
Or, simply go to the tabs at the top of the Power BI desktop page and select "Format". While still highlighting the Card Visual, select "Selection" and hide the card visual as seen in the diagram below.
You will see a perfect GIF recording playing as needed as seen in the static diagram below.

One way to use the GIF in Power BI is use it to show a demonstration as a recording on how to use a created report. For instance, in my case it was created to show business users how to export data from Power BI to Excel. To achieve this, all I needed to do was to label the page "How to export data to Excel" as seen in the diagram below.

Another way I have seen people use GIFs in Power BI is to use it as a tooltip associated to visuals. To ensure this article is not too long, I will write another Tip on how to use GIFs in tooltips in Power BI to provide a detailed demonstration.
In this article, we have successfully demonstrated how to create a GIF recording, how to bring the GIF recording into Power BI desktop, how to ensure the GIF recording plays in Power BI seamlessly, and also some ways to use GIFs in Power BI.
Next Steps
- See a YouTube video from BI Elite on using GIFs in Power BI here.
- You can download ScreentoGIF here.
- Check out this Animated GIF backgrounds in Power BI article in DataVeld here.
- Get some more use cases of GIFs in Power BI reports from SQLityBI here.
- Try this tip out with your own data as business requires.

Kenneth A. Omorodion is a Microsoft Certified Solutions Associate (MCSA) with 12+ years of enterprise application experience in Power BI, DAX, Microsoft Fabric, Business Intelligence, data warehousing, SSRS, T-SQL, and Azure. Beyond his technical skills, Kenneth has expertise working with stakeholders’ and business leaders to help them better understand key insights. He has a great track record of successfully delivering full life cycle Business Intelligence and data solutions to organizations with measurable business impact.
- MSSQLTips Awards
- Achiever Award (75+ Tips) – 2025
- Author of the Year-2021
- Author Contender-2022/2023/2024