By: Bernard Black | Comments (12) | Related: > Tools
Problem
You're being very productive when your boss calls and says: "What version of SQL is SERVERA?". Or maybe: "How big is database XXXX?". And of course: "The users say the app is running slow...".
You'd like to create a simple tool to show SQL Server information to the above questions. But delving into the different development environments is time consuming not to mention expensive. Setting them up with SQL Server Management Studio can be problematic and there are security issues when they run queries. Explaining what a cross product is would take time. Making web reports requires a big infrastructure setup, not to mention learning web development. You'd like to create a program that you can stick on their desktop. A quick windows form would fit the bill, but that's CSharp and Visual Studio and again a big investment in learning. Or maybe not...
Solution
In an earlier article Csharp Windows Form I showed how to make a simple Window's form with a CSharp compiler which is on your PC at this very moment. With this compiler you can take the CSharp code found below and compile it into a CSharp exe tool that you can give your power users. Its adaptable and auto formatting.
Your end user can choose a server, click a button, and see the following:
- General DB info including DB sizes and % full.
- What process are running and if there's a queue.
- See sp_who2 and all the spids connected. Shows if blocking is present.
- See what jobs are on the server and when they last ran.
- Top wait statistics.
Step 1: Find the CSharp compiler aka the csc.exe program
Run "dir csc.exe /s" at the root or C: and the pick one to compile with.
The compiler I used was: C:\Windows\Microsoft.NET\Framework64\v3.5\csc.exe.
I have about a dozen csc.exe compilers on my pc. I'm not sure why I have so many. I never installed any CSharp stuff on my pc. My guess is that new versions of SQL Server Management Studio or SQL Server Express come with an updated compiler.
Step 2: Put the code into .cs file and compile
Put the code into a text file called "Csharp_SQL_TOOLKIT_Combo.cs" (or whatever you want to call it).
Compile it with the csc.exe compiler of your chose.
Note: before you compile, you can put a list of your own servers in the combo box. Look for "///AAA" in the code and add your servers.
You can download the entire script here.
I put everything in a folder "C:\Junk\Csharp2". Go to that folder and compile it like this:
C:\Windows\Microsoft.NET\Framework64\v3.5\csc.exe Csharp_SQL_TOOLKIT_Combo.cs
Step 3: Run the Executable
At a DOS prompt run the following or just double click on the exe.
c:\Junk\Csharp2\Csharp_SQL_TOOLKIT_Combo.exe
Enter a SQL Server or choose a server from the dropdown you added before compiling the code. Below are examples of mine, note, I crossed out the server name in the examples.
Note, this uses a trusted connection to run the queries. You just need to enter a server name and then click on a button and the data will be retrieved. If you don't have access or privilege to run the code it will not return data and return an error.
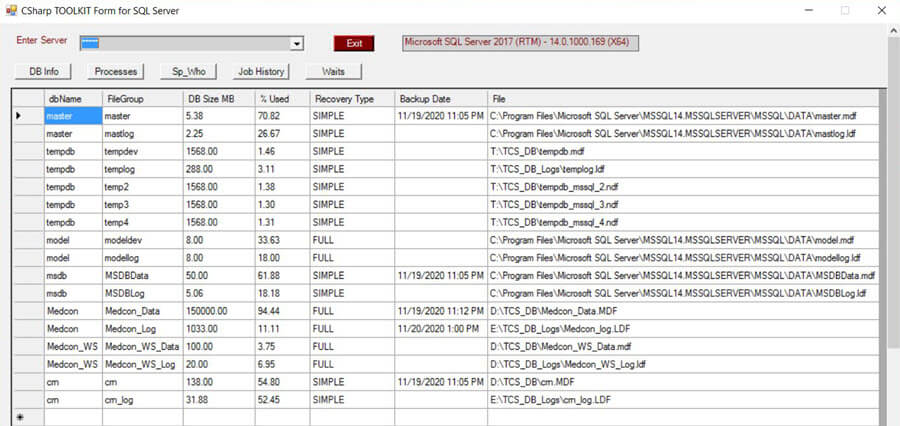
SQL Server Database Information
The first button is "DB Info". This runs a query that shows database information for all databases in the instance. This outputs database name, file group, size, percent used, last backup date and physical location of the database files.

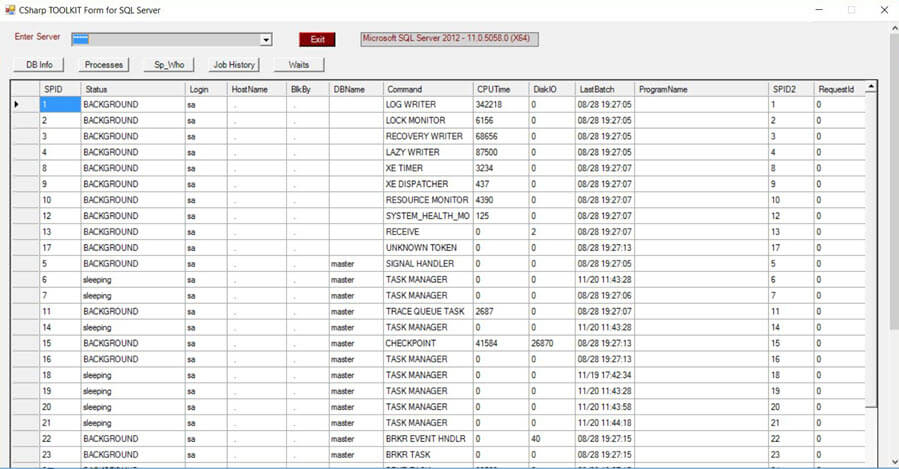
Current SQL Server Processes
The second button is "Processes". This will run a query that shows what queries are actually running on the server.
It's been my experience that a slow server has queries backing up. This will show you what's backed up and if there is any blocking going on. The query with the biggest elapsed micro seconds is probably your culprit. It also shows the first 200 characters of the text of the query.
I've used this query many times to examine slowness on a server. With this button, your power user might be able to see the culprit which may disappear by the time he calls you to tell you its slow.

SQL Server sp_who2 Results
The next button is "Sp_Who". This button executes sp_who2 and shows all connections for the SQL Server instance.
This is used to show blocking and to give the end user an idea of how many connections are hitting the server. It also shows the SQL connections associated with the engine, these are SPIDs with a value of 50 and less.

SQL Server Agent Job History
The next button is "Job History". This will retrieve SQL Server Agent job history data.
End users may want to know if a job finished and when it finished. This button will show all enabled jobs who have a run that is recorded. The output includes the job name, current status, run date, run time and duration in milliseconds.

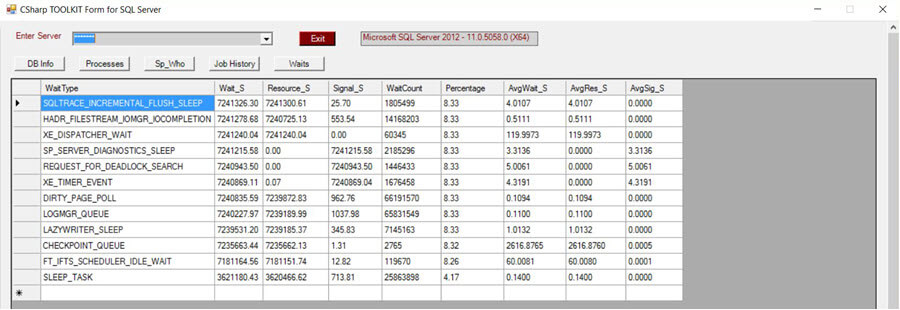
SQL Server Wait Statistics
The next button is "Waits". This button retrieves Wait Statistics for the SQL Server instance.
This button may open a can of worms for the DBA. We all know something has to be the leading wait statistic, but is it relevant? The query for this output retrieves all wait stats. There are several that are not that important to review, so the query could be expanded to exclude specific waits stats. I can't remember where I got this query, but somebody else wrote it. You could take a look at this article to get a different set of data and also filter out some of the wait stats. You could replace the query before compiling the code.

Summary
I've used this setup to create some reports for end users. If you have a query that someone wants to run, look at the button code and add another or modify the existing query. Put the query in the button pressed area and VOILA!
You can review the code before compiling and update any of the queries to ones you use most often.
Next Steps
- Add some more buttons and queries to the form.
- Read these related articles:
About the author
 Bernard Black is a DBA for Beacon Health System in South Bend, IN and has been working with databases for over 15 years.
This author pledges the content of this article is based on professional experience and not AI generated.
View all my tips


