Problem
If I am just starting out with Microsoft SQL Server Reporting Services (SSRS), what are 5 things I should know to get started with this business intelligence solution?
Solution
Working with Microsoft SQL Server Reporting Services over the past two decades (I cannot believe it has been that long) has been such a pleasure and great learning experience. Although there have been a few times when I wondered if SSRS would survive, I certainly feel Microsoft has again breathed life into SSRS by allowing paginated reports to be uploaded onto the Power BI Service (that is the name for reports coming out of SSRS as opposed to an online dashboard through something like Power BI). Even so, the Reporting Services website and related service are still an integral part of any reporting infrastructure. Report consumers still need to produce consistent reports that can easily be viewed or printed in Excel, HTML, Word, or PDF. With such importance still placed on SSRS, in this tip we will convey the 5 things you must know to successfully plan, develop, and deploy a SSRS report.
To follow along with the tip, you will need to install SSRS which is now a standalone installation. For SSRS, you can take a look at this tip for assistance centering on the installation and setup of SSRS (SSRS Install, Setup and Configuration). Additionally, to develop reports, either Visual Studio with the SSRS extensions must be installed (SQL Server Reporting Services SSRS 2017 Installation and Configuration Setup) or Report Builder (Report Builder 3.0 Tutorial).
With out any further delay, at a high level, the 5 items you need to know to be successful with SSRS are:
- Plan your report data source, data sets and related T-SQL queries for your new report
- Mind your design specifically the placement of visuals, the use of groups and the implementation of page breaks and sizes
- Make use of charts or tablix within a tablix for each grouping
- Plan and configure appropriate security both at the data set / source and SSRS folder level
- Enhance reports look with formatting, interactivity, and subscriptions
SSRS Data Sources / Data Sets
Although not as extensive as Power BI through the use of various ODBC based drivers, many data sources can be queried through SSRS; this list includes:
The list of available data sources for SSRS includes the following:
- Microsoft SQL Server (relational database)
- Microsoft SQL Server Analysis Services (SSAS) – multi-dimensional and tabular
- Microsoft Azure SQL Database
- Oracle
- SAP BW
- Hyperion Essbase
- Microsoft SharePoint List
- Teradata
- OLE DB
- ODBC
- XML
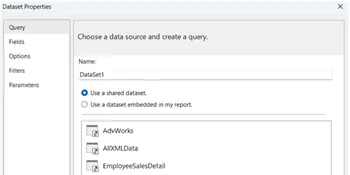
In addition to selecting the data source type, it can be advantageous to use shared data sources and data sets as they allow the same connection and data set to be used by multiple queries. It is important to note that these connections and sets must be published to the SSRS Services to allow for utilization by multiple reports.
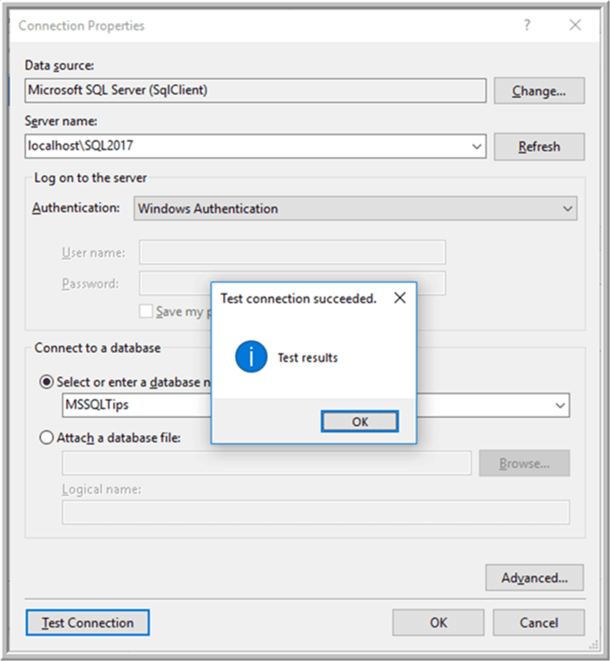
As a data source is defined, you must be sure to think about factors with the setup. First, the security arguments surrounding the connection need to be researched and referenced. For instance, if using SQL Server, you could run into issues with using a Windows Account and Authentication and facing such issues as potential double hoop issues) (SQL Server Reporting Services 2012 Permissions). Also, you will need to review connection details surrounding items such as timeouts, retries, packet sizes, database names, and encryption routines. However, you would also need to consider that if you are developing locally and you install any drivers locally, these same drivers and applications must also be installed on the SSRS server, with the appropriate permissions. Finally, if the data sets or data sources are shared, appropriate permissions must be set for the shared sources and sets, or the report will not run because access is not available to them.
Design Palette
Once significant, timely, and accurate data is available to use via the data sources and data sets, the next item that must be ascertained is how to display that date. To be frank, often this situation is the most daunting and difficult part of the report development process. The data must be conveyed in a way that tells the best story possible, and a story that is easy to understand without additional details from the report designer, as the report designer will likely not be there to tell the story. Folks sometimes say the data must tell a story, but I do not feel that is the correct answer. The visuals are actually telling the story of the data; of course, the visual must have function as the conduit between the data and the report consumer and report viewer. Likewise, the placement, location, drilldown, and other parts of the design palette play a part conveying the data story. Thus, being sure to set up appropriate page breaks, groupings, and coloring all play a part in conveying the appropriate story.
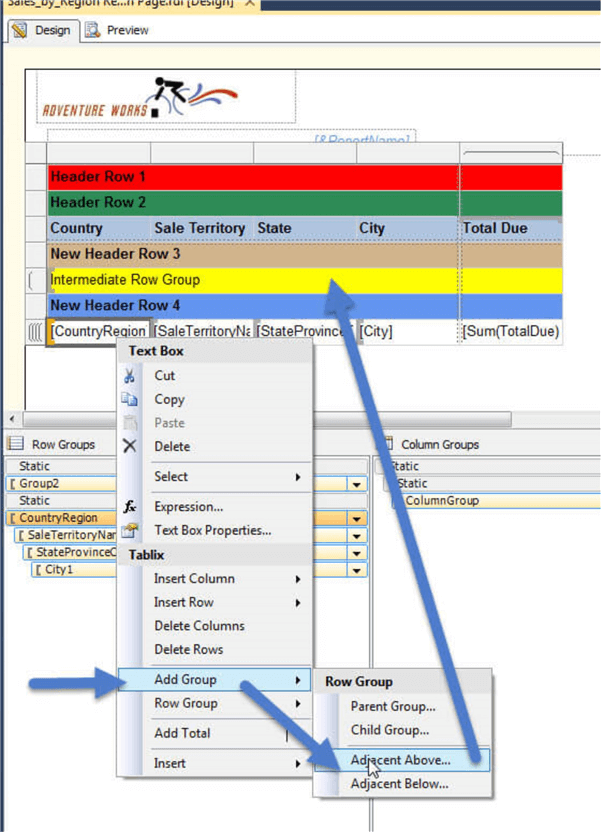
One of the most advantageous methods of converging onto a data story is establishing a solid grouping strategy, similar to what is conveyed in: Multiple Row Grouping Levels in SSRS Report and SQL Server Reporting Services Repeating Headers On Pages. The first tip covers strategies for layering groups to allow for a consistent and positive drill down effect while the second tip covers the process of exposing the proper headers on reports while moving from one page to the next.
Equally important to groupings is using a consistent page break strategy. As part of that strategy, solid decisions should be made about both the interactive page size which is the size of the page when viewed online, and about the size of the page when exported to a file, such as a PDF or Word. These sizes are shown in the below screen print as PageSize and InteractiveSize.
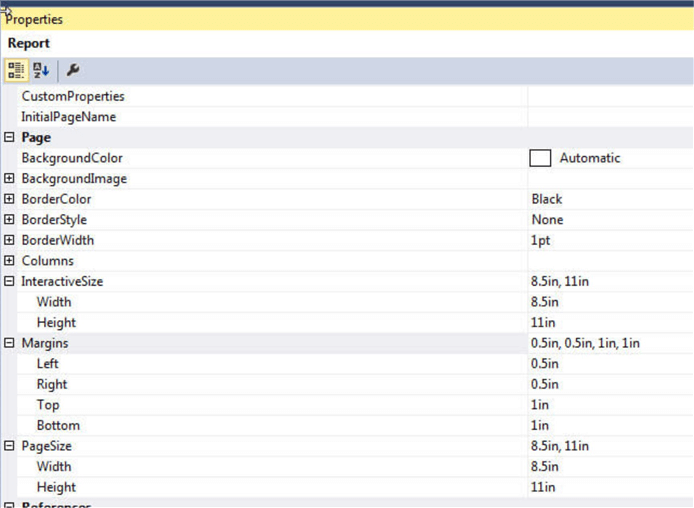
Full details about other page break type techniques can be found at: SQL Server Reporting Services Controlling Report Page Breaks.
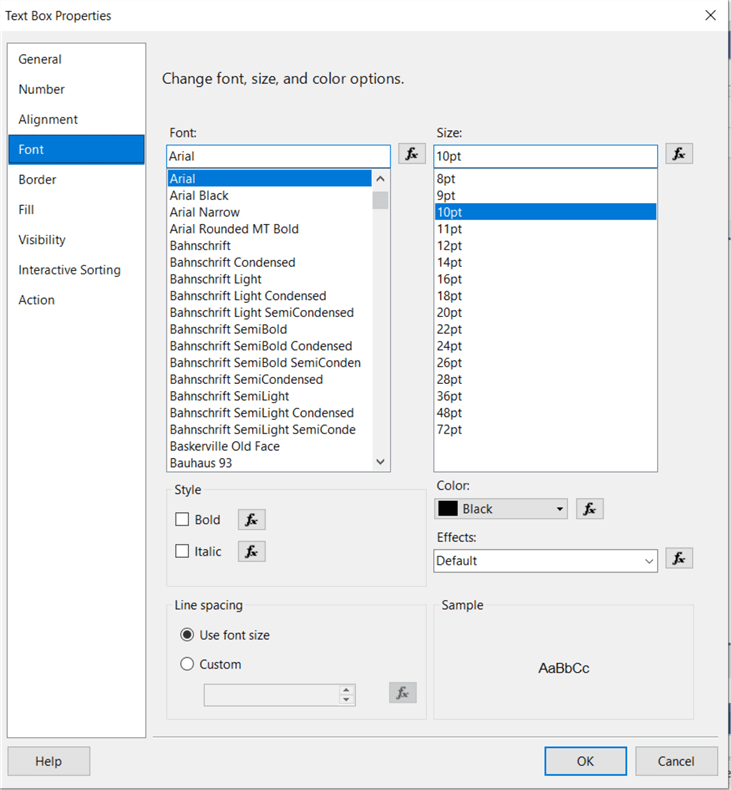
Finally, as part of the process of conveying a story, it is also equally important to make use of specific formatting related to font size, color, bolding and moving into dynamic or conditional formatting. As shown below, we can adjust the font, font size, font color, font effects, bold, and italics among other times. You could also switch to the Border or Fill windows to adjust the border around a textbox or the background fill color for highlighting.
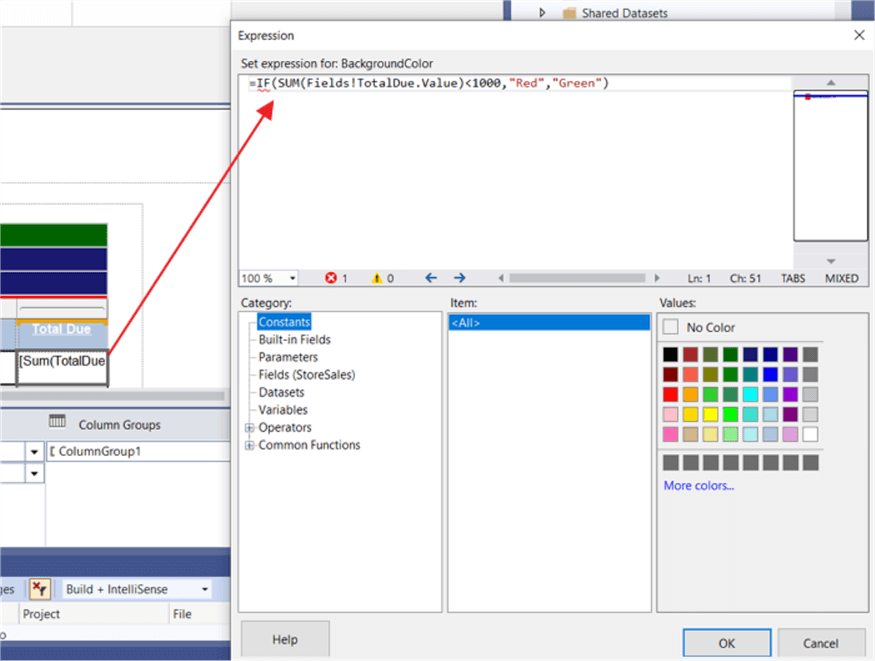
These font changes are nice, but an even better option is to use conditional formatting to make a specific cell only be highlighted based on a specific condition (see Conditional Formatting for SQL Server Reporting Services Reports or Alternate Row Background Color in SQL Server Reporting Services Tablix and Matrix). In order to utilize conditional formatting in SSRS, we need to think in the frame of applying a Boolean formula to set the coloring and sizing for a specific cell (see illustration below). The changes are applied to the same areas where static formatting is made, but instead of using a set color, size, or border.
Tablix and charts within tablix
As with so many tools, you want to efficiently and effectively display data without having to use significant parsing techniques or complex queries and functions. One of the neat tricks within SSRS is the ability to drop a chart, table, or matrix within the textbox of another object. This trick allows a report developer to quickly create a visualization or table for the specific level and each group specified in your row AND column. The alternative to this trick is to create a visual for each grouping you desire to show the table or visual; If you only have two or three groups, that is fine and easy to do. When you have more than those numbers, this tip provides significant design time improvements. Additionally, you are able to provide a consistent look and feel across all visuals instead of attempting to apply a specific formatting to each and every visual instead of just one visual. One additional benefit to this trick, is that you can actually add multiple textboxes within another textbox. As you can see in the below illustration, we can easily drop a pie chart within a textbox on a matrix style report.
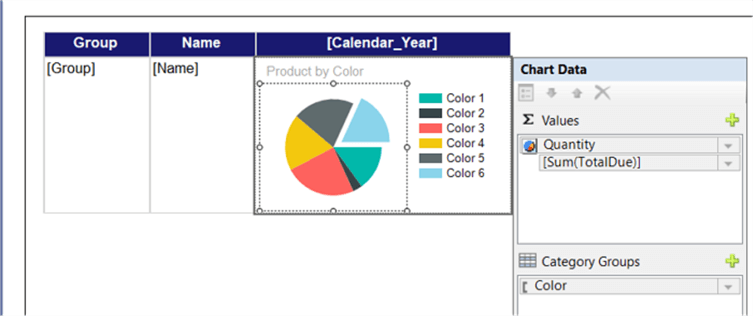
The result from this sort of setup is shown below:

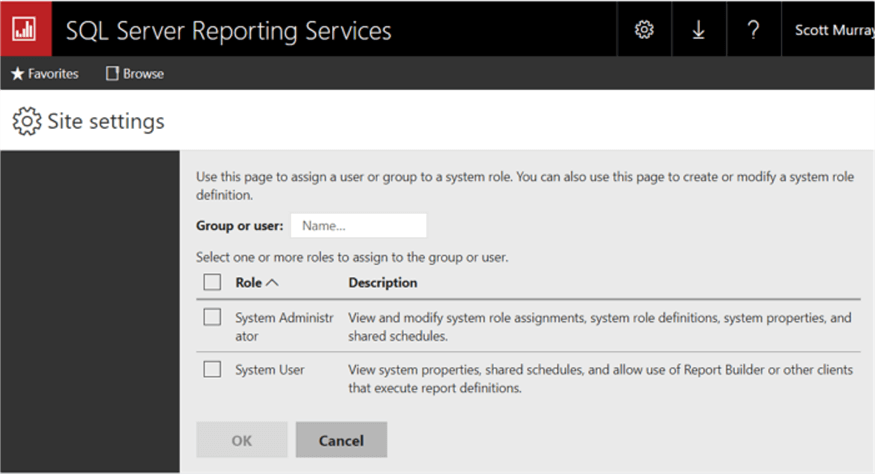
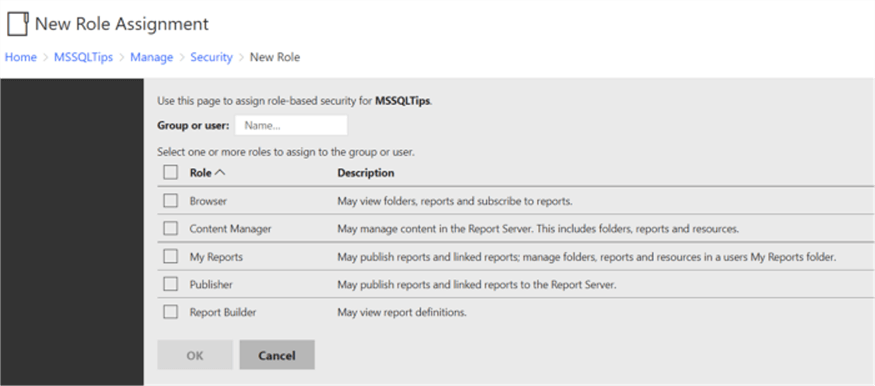
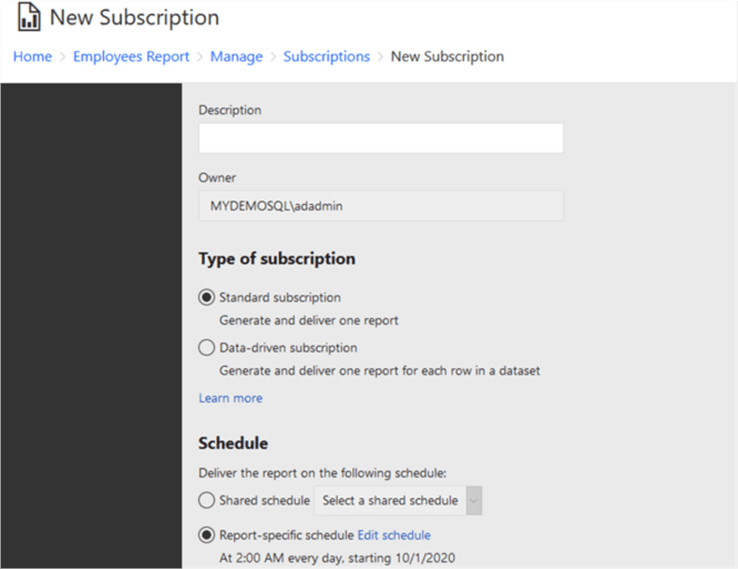
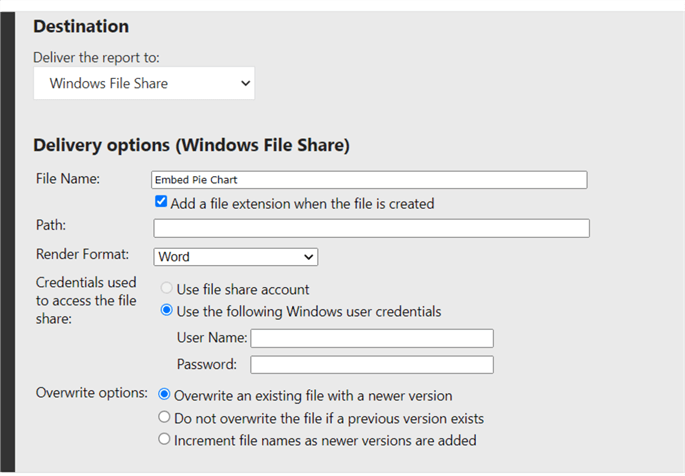
The one last pointer in the development process is to develop the chart outside the matrix or table before dragging it and placing it within the textbox in the matrix or table. Using this process provides a larger size development grid to get all the formatting and view correctly; also, some folks like to remove the legend when you clearly have a set color for each category or series. Please see this tip: SSRS Textbox Tips and Tricks Security is ultimately a very important consideration for both tools. Through the use of Folder access in SSRS (see this tip for details SQL Server Reporting Services SSRS 2017 Website Security and Options), a report designer can limit who has access to see a report or dashboard. However, before deciding who has access at the folder or report level, a decision must be made about who administers SSRS. This user or group assigned to the System Administrator role maintains the system level roles assignments, definitions, properties, and schedules while the System User role maintains shared schedules and system properties. Next permissions at the home folder and any subfolders and reports must be defined. In these cases, individual users and network AD groups can be assigned to view or publish related permissions within SSRS. However, it is recommended to not assign individual users, but instead to apply permissions at the group level. As shown below, these permissions provide various permissions staring with the basic browser role all the way up to publisher role which can provide the ability to publish data sets, data sources, and reports to that folder. For full details, please review this tip: SQL Server Reporting Services 2012 Permissions. Although row level security is possible in SSRS, it requires significant time to implement and maintain. Nai Baio Zhou provides an excellent and detailed method of implementing row level security for SSRS: SSRS Dynamic Row-Level Security with Recursive Hierarchy Group. This tip provides a step-by-step guide on achieving row level security at a specific category level. One area that SSRS shines is its subscription functionality; SSRS allows both simple and data driven subscriptions to be emailed or saved to a file location. The format in SSRS is any export format available in SSRS and includes file types such as PDF, Word, Excel, and Power Point, along with HTML based email. This tip provides an excellent basis for implementing data driven subscriptions: Reporting Services Subscriptions in SQL Server 2019. Likewise, this tip provides details on the basics of setting up a SSRS subscription: SQL Server Reporting Services 2016 Subscription Enhancements. Once you select type of subscription and then the schedule, the report subscriber decides the destination, either file share or email destination. The destination options include the file type, file name, and incremental update decisions. With all these features for customization of subscription emails, SSRS is the clear winner for functionality and delivery of standard types of report. Many folks who have not fully utilized SSRS may not have an expansive view of the full power and breath of SSRS. SSRS continues to include new features including allowing paginated SSRS report being loaded into the Power BI Service. The 5 above items are the pinnacle of features that any SSRS report developer needs to master. Next Steps I have a passion for crafting Business Intelligence Solutions for my user groups. My experience includes almost 15 years of SQL Server involvement with the last 12 years focused specifically on Business Intelligence, SharePoint, OLAP, SSRS, and Decision Support solutions. Currently, I am a Business Intelligence Architect in the healthcare industry, and I also teach database and analytics classes for Kennesaw State University, Southern New Hampshire University, and Reinhardt University. My education includes an MBA and an undergraduate in Accounting (yes I am a reformed accountant!), both from Kennesaw State University. I enjoy every day by trying to grow my faith and spend precious time with my family. I have been happily married to my wife of over 20 years, and we have two teenagers one who we home school with the help of a University Model School, Cornerstone Prep in Acworth, GA (cornerstoneprep.org). Our other child is a Construction Management major at KSU’s Southern Poly / Marietta campus. We are a soccer and Cross Country (XC) family who play, coach, and referee soccer or run for fun most every day. For several years, our family has volunteered (and played with the dogs and cats) at Etowah Valley Humane Society in Cartersville, GA.Security and Row Level Security
Alerts and Subscriptions
SSRS – Still Growing