Problem
SQL Server Reporting Services has been part of the Microsoft SQL Server platform for 17 years, but not everyone has taken advantage of all the features this component of SQL Server has to offer. In this article we look at various aspects of SSRS and plenty of resources to get you started as well as build upon your existing knowledge.
Solution
Wow, Microsoft SQL Server Reporting Services (AKA SSRS) is celebrating its 17th birthday this year; next year it will be considered a full-fledged adult, although I would suspect that many people would say that it is already quite mature. Even with all the hype around Power BI, SSRS still holds its own on what it does best, generate paginated report in various format all from a central website. As of right now, you can download the latest version of SSRS. The install process was initially a component of the SQL Server install, but over the last few versions, SSRS was separated from the SQL Server database engine install and became a stand along option. Furthermore, the integration of SSRS paginated reports into Power BI shows that SSRS in one form or fashion is here to stay; we need to remain ingrained in with what SSRS can and cannot do well and continue to grow with the enhancements that will be add to it in the future.
SSRS Getting Started with Installing SSRS
So how do you get started with reporting services? The first step is understanding the components that make up SSRS and how they interact. One set of components is the web service and relational database components that need to be installed as an add on to SQL Server. Generally, these items would be considered both the behind-the-scenes database supporting the forward-facing web front end. The install and configuration process does require SQL Server, but it does not have to be on the same server as the database. In fact, the process uses a standalone installer now which is outlined in this tip. However, you must have SQL Server license to install the product to begin authoring new reports. To see this process in action, these tips would be a great staring point: Install SSRS and Install SSRS on RDS SQL Server Instance. The first tip reviews the basic install process and then moves into configuring SSRS for use while the second covers installing SSRS on AWS. These configuration items include:
- Connecting to a Microsoft SQL Server instance
- Setting a service account and execution account
- Creating the SSRS databases (regular and temp)
- Inputting email settings and subscription settings
- Create a Power BI integration point
Once all these steps are completed, you will have a working website to which reports can be deployed. The website provides end report consumers the ability to run reports from the web interface.
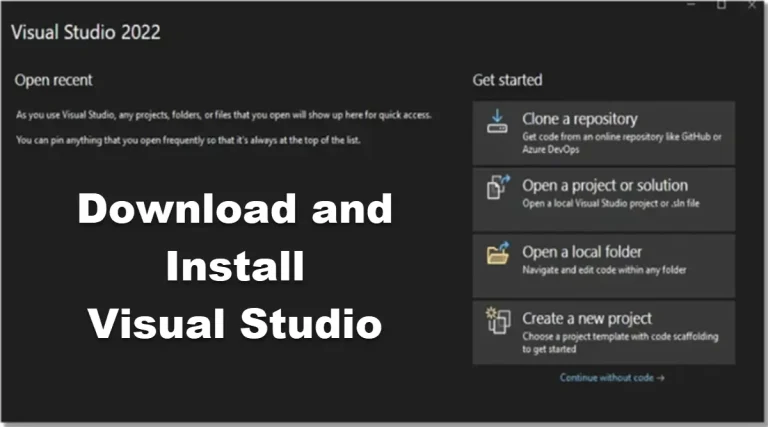
Tools to Develop Reports
Now that the SSRS databases and website are created, the next step is installing the tools needed to develop reports to be deployed. Again, several options are available in order to develop reports, either Visual Studio or SSRS Report Builder. Both options allow for the development of reports, but most Business Intelligence report developers find that the Visual Studio option provides more flexibility in report design, although most functionality is also available in Report Builder. This tip, on installing Visual Studio 2019 for the Production DBA, reviews the install process for getting Visual Studio installed on your local machine. Of particular interest is the section which discusses installing extensions including the Microsoft Reporting Services Projects extension. This extension is needed to design, develop, and maintain SSRS reports in Visual Studio. Furthermore, the Visual Studio extension allows for importing existing SSRS report files into a SSRS project which in turn allows for using a source control tool. Finally, the SSRS Project extension includes a wizard that guides you through the report project creation and the report file design process. It is helpful for first time report developers.

As an alternative, SSRS Report Builder can be used to develop reports that will be deployed to the SSRS webserver. Many consider Report Builder to be a light weight and easy way to create and maintain a report without all the details of Visuals Studio and SSRS Projects (of course that comes at the risk of creating and maintain reports outside of source control and projects). It is often the case, though, if you need to quickly look at a report, Report Builder is the prime tool to complete that task efficiently and without much trouble. The Microsoft download center, is the place to download the most current version of Report Builder.

To show the process of creating a report in Report Builder, this tip outlines the process while using a manual data source. Furthermore, to show that Report Builder is keeping up with the advances in Power BI, the tip, SQL Server Reporting Services Report Builder with DAX Query Support shows how to configure a data source via DAX (the language of Power BI) within Report Builder. Finally, it should be noted that recently a Report Builder for Power BI version is available for download that specifically addresses reports being deployed to Power BI; I am hoping to have future tip on this product soon.
In either Visual Studio, SQL Server Data Tools (SSDT) or Report Builder, we can easily create a new blank report / rdl file (Report Definition Lanuage) which means we are ready to start the actual design and development process.
Report Design – Data Sources and Data Sets
Now that our design tools are installed, we can actually start to work on the report details within the RDL file. However, before we get started it is best to review several best practices for report design. Ghanesh Prasad established three sets of Best Practices that note several considerations that should be followed in your design:
- SSRS Best Practices for Performance and Maintenance
- SSRS General Best Practices
- SSRS Best Practices for Report Design
- Export SQL Server Reporting Services Report Data into Multiple Excel Worksheets
Data sources in SSRS are as varied as the data itself. Of course, you can connect to most DBMS’s such as SQL Server, Oracle, or Teradata; however the ODBC connection expands that list to list as wide as there are ODBC drivers for that source while connections to Azure SQL and Synapse databases are also available.

Additionally, custom assemblies can be designed to generate extensions to allow for the creation of other data sources. To see details on creating connections to various data sources, here is a sample of tips which outline various data source connections in SSRS:
- Creating a SSRS Report using a MySQL Data Source
- Developing a SSRS Report using a SQL Server Reporting Services (SSAS) Data Source
- Enable SSIS as a Data Source Type on SSRS
- SSRS Report with Teradata Data Sources
- Using JSON as a Data Source for a SQL Server Reporting Services Reports
- Join Multiple SharePoint Lists to build SQL Server Reporting Services Report
- Execute a SQL Server Reporting Services report from a SQL Server Integration Services Package
Of course, sometimes you need to dynamically connect to a sundry of sources; in that case, Daniel Farina’s tip, covers the process of switching data sources on the fly.
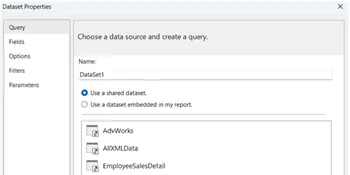
In additional to connecting to the actual data source, consideration must also be made on whether to use a shared or embedded data source. A shared data source can be shared by multiple reports (when published to the SSRS service) whereas an embedded source is embedded within the report itself, and can only be used by that report. To see these two difference sources, take a look at this tip: SQL Server Reporting Services Data Sources.
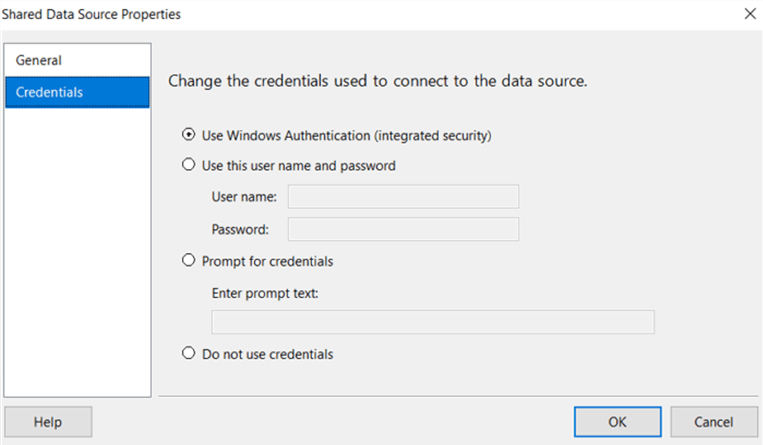
Finally, as the data sources are setup, consideration must be made on how to connect to those data sources with the appropriate credentials.
Data sources are the connection to the data to be used in the report, but they are just that, the connection. The next step in the design process is establishing data sets that use queries to connect via the established data sources. Just as the data sources are varied, so are the data sets and the queries that generate the data sets. For instance, as shown in this tip, the data set could be based on a MDX query to SSAS, or the query could be a simple SQL query against an Oracle or SQL Server database. In addition to using the fields that are included in the query results, calculated fields can be added to the data set.

Likewise, filters can be created within a data set to limit data results. This tip from Tim Cullen reviews how to establish a filter on a data set while Ghanesh Prasad further describes this feature and several alternate solutions.
Report Design – Design Grid
Now the data feed is set up via data sources and data sets, the actual display of the report considered. These considerations include:
- What parameters and filtering will be used to select the data?
- What data will actually be shown and in what format (tables, visuals, charts)?
- What header and footers will be used at the page and visual levels?
- What groupings and page breaks are needed?
- What formatting is needed including conditional formatting?
- What visibility and drill down are needed?
Reviewing the above list, many complex considerations need to be made to show the very best and clearest report, as we must remember that the report tells a story.
The first consideration in our design is the use of parameters; these objects serve many purposes including dataset, query, report, object, and group filtering. Parameters can be visible or hidden while allowing their source to be based on a data set, or the values in the parameter can be hand entered. Additionally, a default value (or values) can be set for a parameter which allows a report to run automatically when a report consumer first opens that report.

Ghanesh Prasad, again, created several excellent tips covering parameter setup and usages including:
- Selecting "All" values in a parameter list
- Showing selected report parameters on the report itself
- Allowing Null values in report parameter list
- Using cascading report parameters
- Refreshing Date Parameters
Likewise, one of my past tips shows how to use Multivalue parameters to filter data. If you use MDX and SSAS, using cascading parameters is explained by Siddharth Mehta.
Based on the sheer number of parameter-based tips, you can see how powerful parameters can be when creating and running a report. A final tip on SSRS parameters covers some of the more esoteric methods of interacting with parameters.
Once the parameters are squared away, the next consideration is establishing what headers and footers will be used on the report and within each graphic on the report. To set the report headers and footers, it would be best to review: this tutorial. Additionally, as objects, especially tablix and matrix objects are added to the report, thought must also be given to the what headers and footers should appear within these objects and whether they should repeat when viewing and printing. This tip completes an in-depth dive into how to establish repeating row, column, and group headers on a report. Repeating headers within groups quickly can get very complex as the layers of those groups increases.
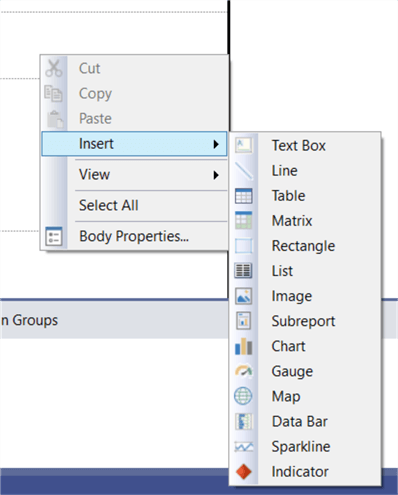
Our next step is to determine the best graphic for the job / story we are attempting to show and tell. The variety of objects begins with more tabular forms and traverses all the up to creative visuals and charts. As shown below, the assortment and availability of different objects basically is broken out by tables / matrix, charts, and lines /rectangles. Deciding on these objects provides the ability to select the best object for the data story. This tip includes a review of the available objects in SSRS. The report designer will need to determine what objects, tables, matrices, visuals, and charts should be included.
The various authors at MSSQLTips.com have done a tremendous job detailing the creation of various specific reports and charts.
- For instance, this tip from Nai Biao Zhou outlines the process of creating a crosstab report.
- Extending into the creation of line charts, Koen Verbeeck covers the creating of Line Charts which includes an index line and Calculated Series to a Graph.
- Furthermore, creating more complex charts such as a range chart is covered in these tips: SQL Server Reporting Services Range Charts or How o Create a Slope Chart in SQL Server Reporting Services.
- Likewise, Koen reviews adding a second axis on chart in this tip: How to Create an Index Line Chart in SQL Server Reporting Services.
- You can also create a group of small multiples of the same chart in SSRS.
- In a similar fashion, you can utilize groupings within your chart series values.
- Finally, Siddharth analyzes the options that are available when you have blank values in a chart series.
All these tips help you to get the data from the T-SQL query (queries) to the screen or to the page.
Once you have the data showing on your selected matrix, table, or visual, you will want to insert groupings and page breaks. For page breaks, you will need to decide how the report breaks when viewing online versus when exporting to a file such as pdf. To see the various page break methods, I would head to this particular tip. Often when inserting the page breaks, a report designer will want to decide which potential headers should repeat when inserting such page breaks. To achieve these repeating headers, the techniques described in this tip, are helpful to complete this process. In addition to page breaks, report designers need to add grouping at the row and column level. Row groups and column groups provide the ability to categorize, summarize and aggregate measure values within visuals. Groupings can be a single group, or could be more complex, such as the multi-group methods. Likewise, groupings can be used to limit the number of rows that are potentially displayed on a single page. Ghanesh details how to complete this setup.
Subsequently, a report designer can move into completing the desired look of a report by implementing formatting on the report. One of the most basic formatting options is to format alternate rows on a table or matrix; to achieve this method use this tip. Another common need is to implement conditional formatting within a report object.
Sometimes you need to even format a particular item or part of a textbox. Alternatively, sometimes you need format a part of a chart or indicators; indicators can be easily formatted using the methods outlined in this tip. Finally, many of the above tips and suggestions are summarized in this What I Wish I Knew tip.
A final part of the report designs surrounds how to decide what to show and hide on a report. In its most basic form, Rob Fisch covered this topic at a high level. Included in this process are methods to toggle the showing or hiding of rows or columns in a report object; for instance this tip outlines the process of using toggling methods to show rows or columns.
Report Design – Deploying
Now that the report is done, we need to move on to getting the report on to the website. Like other parts of SSRS, many methods exist to get a report to the SSRS website; the first is the manual upload method as shown below.

The second alternative is to use an automated deployment process directly from Visual Studio. The details of that procedure are covered in the second part of this tip. Additional options for deploying reports using Power Shell or the Command Line are also available; you can see these methods here: PowerShell Commands for SQL Server Reporting Services and SQL Server Reporting Services rsexe Utility.
Security
The final component of your report deployment process centers on security. There are two main setting topics in the security realm of SSRS. First, certain system levels roles need to be reviewed and set up. The roles included two roles: system administrator and system user. The system administrator has full control of the SSRS website and can add other users. Alternatively, the system user roles can only view the administrative settings. Drilling down from system level are SSRS folder access which can be seen at SQL Server Reporting Services Permissions and this tutorial: SQL Server Reporting Services Website Security . These tip reviews the basic roles, such as browser, content manager, and publisher, that provides user / group access to the actual folders and reports on a SSRS webserver. Nai Biao Zhou provides one method for moving even farther down the security chain by showing Row Level Security options.. Once your security is setup, you are ready for end users to use SSRS for their reporting needs.
Summary
Within this SSRS tutorial, we covered the SSRS report development process from beginning to end; throughout the context, we provided a quick way for you to drill directly into a sundry of other tips that explain each of the detailed processes (installation, security, authentication, etc.) and method used to complete a particular task.
Next Steps
- Additional Resources:

I have a passion for crafting Business Intelligence Solutions for my user groups. My experience includes almost 15 years of SQL Server involvement with the last 12 years focused specifically on Business Intelligence, SharePoint, OLAP, SSRS, and Decision Support solutions. Currently, I am a Business Intelligence Architect in the healthcare industry, and I also teach database and analytics classes for Kennesaw State University, Southern New Hampshire University, and Reinhardt University. My education includes an MBA and an undergraduate in Accounting (yes I am a reformed accountant!), both from Kennesaw State University. I enjoy every day by trying to grow my faith and spend precious time with my family. I have been happily married to my wife of over 20 years, and we have two teenagers one who we home school with the help of a University Model School, Cornerstone Prep in Acworth, GA (cornerstoneprep.org). Our other child is a Construction Management major at KSU’s Southern Poly / Marietta campus. We are a soccer and Cross Country (XC) family who play, coach, and referee soccer or run for fun most every day. For several years, our family has volunteered (and played with the dogs and cats) at Etowah Valley Humane Society in Cartersville, GA.
- MSSQLTips Awards: Champion (100+tips) – 2016 | Author of the Year – 2015 | Author Contender – 2014, 2016-2021