Problem
Data analysts use cross-tabulations, which are like Pivot Tables, to examine relationships within data. When using cross-tabulation, we arrange data in row groups and column groups. The row groups represent the different levels of one variable; the column groups represent the other variable that may also have multiple levels [1]. The intersections of rows and columns contain summarized information. For example, sales managers may want to view a breakdown of the company sales by product category and time. In this type of report, the rows are different product categories; the columns are different times. A cell, the intersection of a row and column, represents the total sales amount for the corresponding product category in a certain period. How can we build this kind of report in SSRS?
Solution
Matrices in SSRS provide functionalities like those features in the cross-tabulation and pivot tables [2]. We use a matrix to group data in row and column groups. This tip provides a step-by-step procedure to create a ready-to-use, cross-tabulation report shown in Figure 1. The report is interactive, i.e., the report allows users to expand or collapse a group. The demonstration report loads data from the AdventureWorks sample database “AdventureWorks2017.bak” [3].
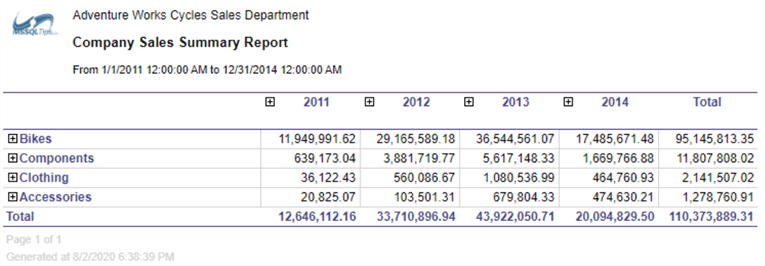
Figure 1 Adventure Works Sales Summary Report
This exercise gathers business requirements from the “Company Sales” report in the SQL Server Reporting Services Product Samples [4]:
Sales managers at AdventureWorks want to have a report to summarize the sales amount in a certain period. When report users view the report, they want to see a breakdown of company sales by product category and time. The product category variable has two levels: product category and product subcategory; the time group has two levels: year and quarter. Report users can interactively expand groups at higher levels and collapse rows associated with lower levels. Figure 2 demonstrates the expansion or contraction of groups.
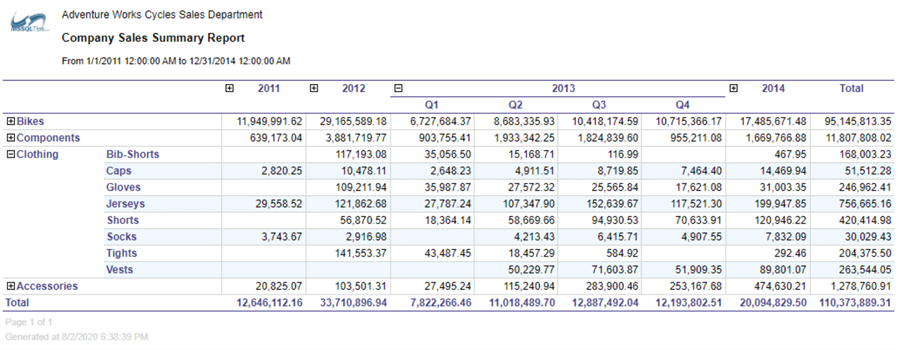
Figure 2 Interactively Expand a Row Group and a Column Group
I organize this procedure into five sections.
- In Section 1, we create a data source for a report.
- We cover a step-by-step process to design a ready-to-use, cross-tabulation report using Visual Studio 2019 in Section 2.
- Section 3 introduces techniques to build configurable reports.
- Next, in Section 4, we explore methods to add images to the report.
- Section 5 shows how to access reports through the SSRS web portal.
I created this report with Microsoft Visual Studio Community 2019 and Azure Data Studio 1.19.0 on Windows 10 Home 10.0 <X64>; I tested the report on SQL Server 2017 Reporting Services (Version 14.0.600.906). The DBMS is Microsoft SQL Server 2017 Enterprise Edition (64-bit).
1 – Preparing Data Sources for the Report
We create data sources for SSRS reports from which the SSRS loads report data. As a best practice, reports should share data sources [5]. This exercise uses the SQL Server relational database as the data source. The SSRS also supports other data source types, such as Microsoft SQL Server Analysis Services, Microsoft Azure SQL Database, Oracle, OLE DB, and XML [6].
1.1 Create a Stored Procedure to Extract Data
We use stored procedures to load report data from the SQL Server database. We recommend this method. DBAs only need to grant EXECUTE permission on these stored procedures without having a risk of exposing underlying tables [7]. Besides, we put all business logic in stored procedures; therefore the report, like the view component in the MVC pattern, solely displays data to report users.
According to the business requirements, we should load the following data into the report: sales amount, product subcategory, product category, quarter, and year. We extract unique identifiers associated with these names as well. Inspired by the SQL query in [4], we create a stored procedure “[dbo].[uspGetCompanySalesSummary]” to retrieve these data from the sample database:
CREATE PROCEDURE [dbo].[uspGetCompanySalesSummary]
    @StartDate  datetime
   ,@EndDate    datetime
AS
BEGIN
   BEGIN TRY
   SELECT PC.[ProductCategoryID]
      ,PC.[Name]            AS Category
      ,PS.ProductSubcategoryID
      ,PS.[Name]            AS Subcategory
      ,DATEPART(yy, SOH.OrderDate)   AS [Year]
      ,'Q' + DATENAME(qq, SOH.OrderDate)   AS Qtr
      ,SUM(DET.UnitPrice * DET.OrderQty)   AS Sales
   FROM Sales.SalesOrderDetail DET
   INNER JOIN  Sales.SalesOrderHeader SOH ON DET.SalesOrderID = SOH.SalesOrderID
   INNER JOIN  Production.Product P ON P.ProductID = DET.ProductID
   INNER JOIN  Production.ProductSubcategory PS ON PS.[ProductSubcategoryID] = P.[ProductSubcategoryID]
   INNER JOIN  Production.ProductCategory PC ON PC.ProductCategoryID = PS.ProductCategoryID
   WHERE(SOH.OrderDate BETWEEN(@StartDate) AND(@EndDate))
   GROUP BY DATEPART(yy, SOH.OrderDate)
         ,'Q' + DATENAME(qq, SOH.OrderDate)
         ,PC.[ProductCategoryID]
         ,PC.[Name]
         ,PS.ProductSubcategoryID
         ,PS.[Name]
   END TRY
   BEGIN CATCH
        DECLARE @ErrorMessage NVARCHAR(4000
        DECLARE @ErrorSeverity INT
        DECLARE @ErrorState INT
        SELECT @ErrorMessage = ERROR_MESSAGE(),
                @ErrorSeverity = ERROR_SEVERITY(),
                @ErrorState = ERROR_STATE
        RAISERROR(@ErrorMessage, @ErrorSeverity, @ErrorState
        RETURN 1
    END CATCH
    RETURN 0
END
1.2 Create a Shared Data Source
Multiple SSRS reports can reference a shared data source, a set of data source connection properties. With shared data sources, we can configure database connections for reports in a central place. For example, if we move the database to a different server, we can update the connection information in one place [8].
1.2.1 Create a Report Server project
Create an empty Report Server Project in Visual Studio 2019 by selecting the "Report Server Project" template, as shown in Figure 3. Then, follow instructions on the screen to create the report server project.
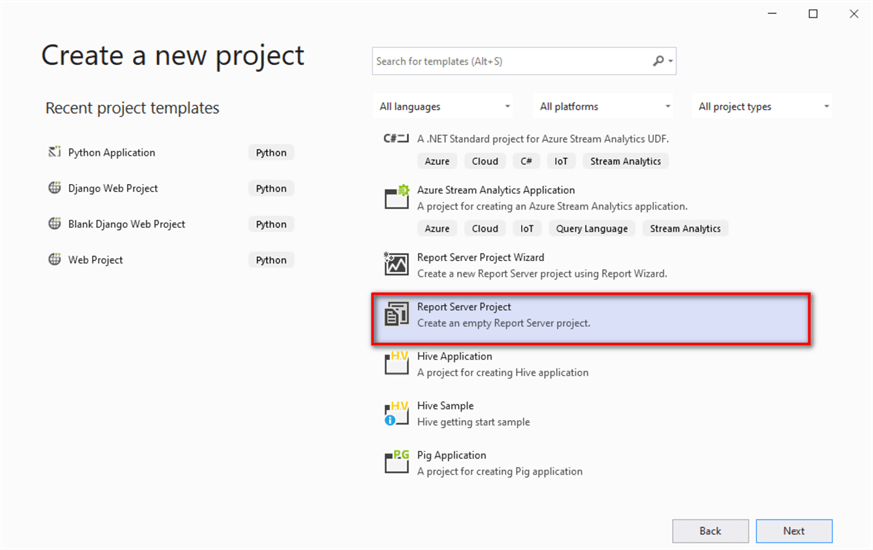
Figure 3 Create an Empty Report Server Project in Visual Studio 2019
The Solution Explorer panel should look like Figure 4. The project has three folders. As of this writing, we cannot create a subfolder under the report server project. If we want to keep our reports well-organized, such as all sales reports in one folder and all accounting reports in another folder, we create different projects for different reporting groups.
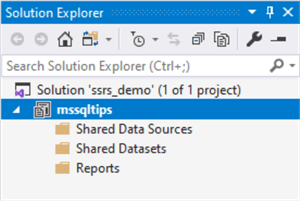
Figure 4 The Folder Structure of the Report Server Project in the Solution Explorer Panel
Right-click on the project name “mssqltips” to bring up the context menu and then select the “Properties” item in the menu. The project property pages dialog appears, and it should look like Figure 5. We ensure that the “TargetServerURL” property points to a report server. The “Report Server Configuration Manager” tool can configure a URL used to access the Report Server. Other properties in the project property pages dialog take default values.
It is worth noting that the default values of “OverwriteDatasets” and “OverwriteDataSources” are “False.” IT professionals who deploy reports may not undertake a task to manage these reports. After report deployment, we pass the control of reports to report managers. Some may overlook the boundary line between report development and report management. The deployment process should not overwrite any report management configurations.
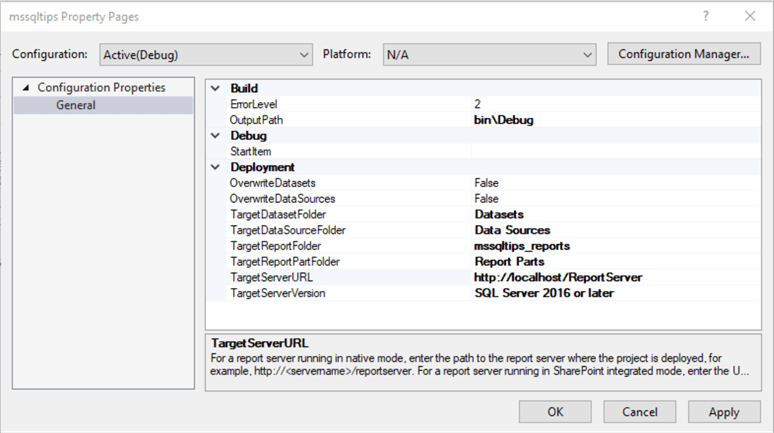
Figure 5 The Report Server Project Property Pages
1.2.2 Add a Shared Data Source
Right-click on the “Shared Data Sources” folder in the “Solution Explorer” panel. Select the “Add New Data Source” item from the context menu to bring up the “Shared Data Source Properties” dialog. We enter a value of “mssqltips_datasource” for the “Name” box; the dialog should look like Figure 6.
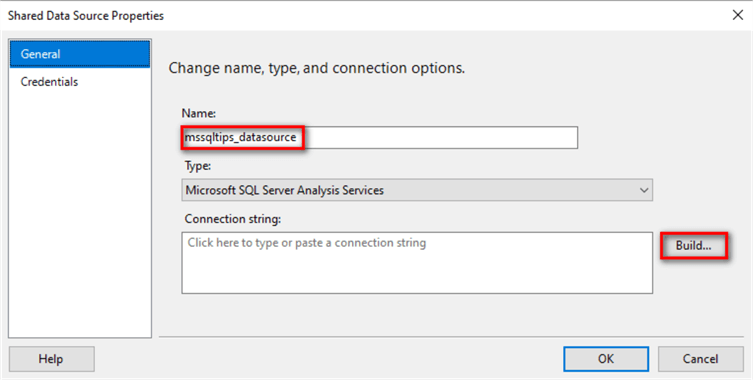
Figure 6 Create a Shared Data Source in the Report Server Project
Click on the “Build…” button in the “Shared Data Source Properties” dialog to bring up a new dialog, the “Connection Properties” dialog. Select a data source type, a server name, and a database name in the new dialog. The dialog should look like Figure 7. Click on the “Test Connection” button in the dialog to confirm the database connection.
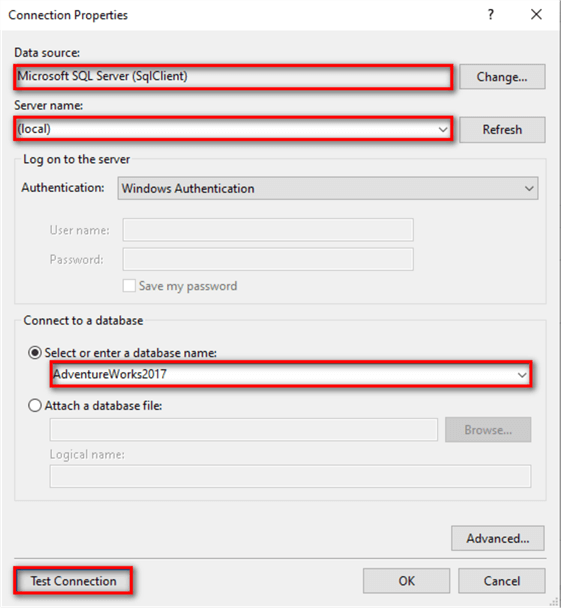
Figure 7 Configure the Database Connection String
Click on the button “OK” in the “Connection Properties” dialog to close the dialog. We notice that the “Connection string” box in the “Shared Data Source Properties” dialog has an auto-generated string. Click on the “OK” button to close the dialog. The shared data source shows up in the “Shared Data Sources” folder, as exhibited in Figure 8.
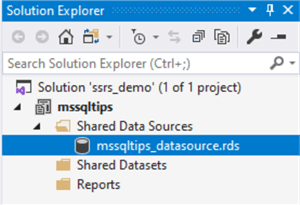
Figure 8 The Shared Data Source in the Project Folder
2 – Designing the Report Layout
Business users usually operate in a mode of discovery [9]. They will have more specific requirements when they see reports. This fact determines that creating reports is an iterative process. We create a report based on gathered requirements and then quickly deliver the report to business users for confirmation. We modify the report according to users’ feedback. This process repeats until all agree on what the report should look like and how it should work.
After we complete this report, we can use this report as a template. We usually do not start designing a report from scratch. We can either reference existing reports or consult business users for layout design. When we have many templates, we ask business users to pick one of them as the starting point. The usage of report templates shortens our development time.
2.1 Create a New SSRS Report
Some advanced features of SSRS are not available when we use the wizard [5]. If we have never used SQL Server Reporting Services, this wizard tool helps us quickly create a report and taste SSRS. In practice, we create a report from a blank canvas rather than running the wizard.
2.1.1 Add a New Report to the Project
Right-click on the folder “Reports” in the “Solution Explorer” panel, select “Add -> New Item…” item from the context menu, as shown in Figure 9.
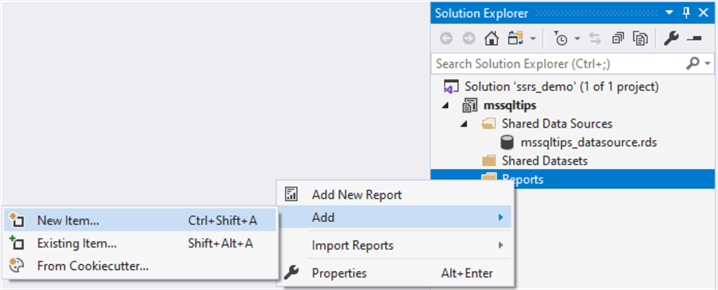
Figure 9 Drill Down to the Menu Item to Add a New Report
The “Add New Item” dialog appears, and it should look like Figure 10. Select the “Report” item and enter “Company_Sales_Summary_Report” for the “Name” box.
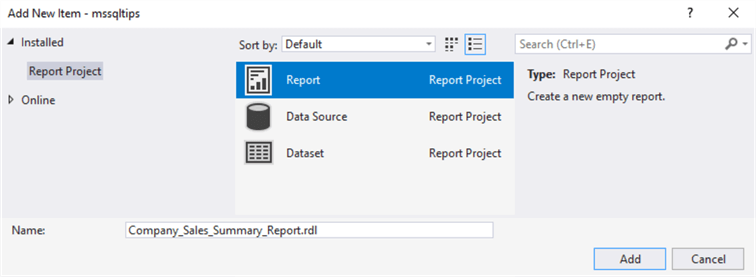
Figure 10 Select Report Item to Create a New Empty Report
Click on the “Add” button in the dialog. The IDE, Visual Studio 2019, adds the new report, “Company_Sales_Summary_Report,” to the project. The design canvas of the report should look like Figure 11.
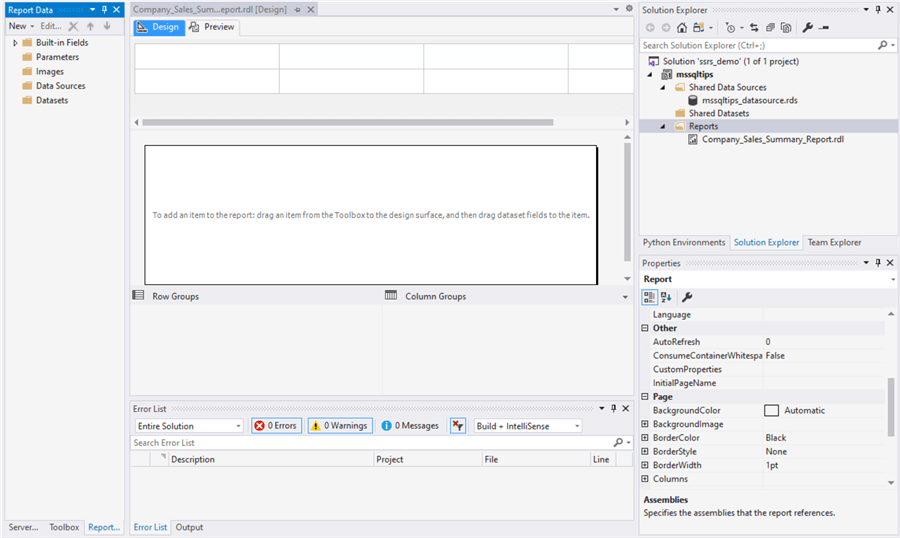
Figure 11 The Design Canvas of the New Report
2.1.2 Arrange the Report Layout
After we click on any area in the “Design” tab, the “Extension” menu on the top of Visual Studio 2019 includes a menu item “Report,” as shown in Figure 12. Click on menu items: “Add Page Header” and “Add Page footer,” to add a header section and a footer section to the report.
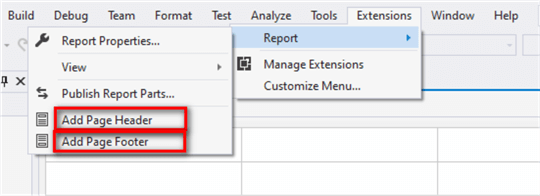
Figure 12 Activate the Report Item in the Extensions Menu
As shown in Figure 13, the report has three sections: report header, report body, and report footer. We can move the dotted line to change the height of each section.
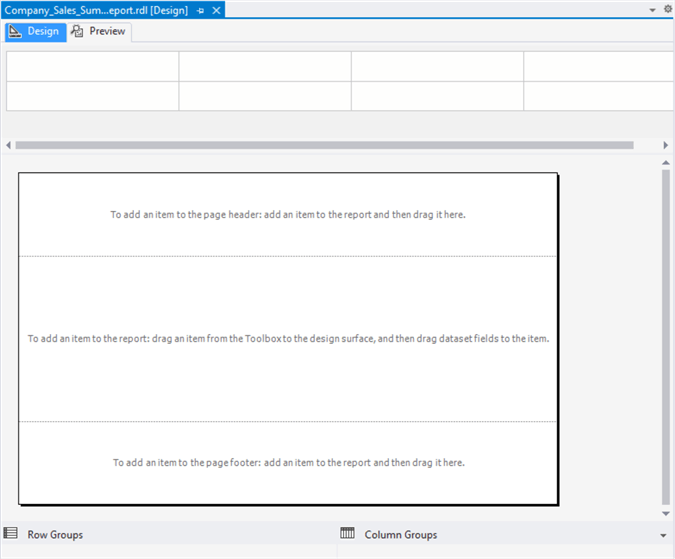
Figure 13 The Report Layout with Three Sections
2.1.3 Add the Shared Data Source to the Report
Right-click on the “Data Sources” in the “Report Data” panel. Select the “Add Data Source…” command from the context menu, as shown in Figure 14.
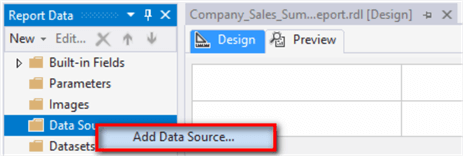
Figure 14 Add a New Data Source to the Report
The “Data Source Properties” dialog appears. Enter a value of “mssqltips_datasource” for the name box. Select “Use shared data source reference” and then select “missqltip_datasource” from the dropdown list. The dialog should look like Figure 15. Click on the “OK” button to close the dialog. The data source “mssqltips_datasource” appears under the “Data Source” folder in the “Report Data” panel and, then, the report can access the shared data source.
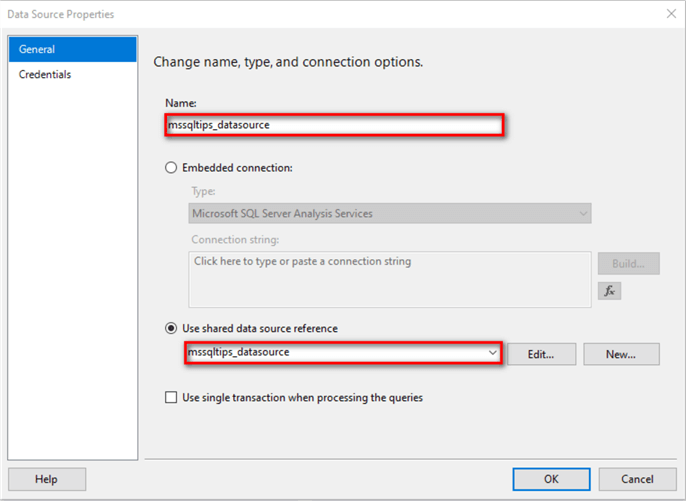
Figure 15 Add the Shared Data Source to the Report
2.1.4 Add Datasets to the Report
Right-click on the “Datasets” in the “Report Data” panel. Select the “Add Dataset…” command from the context menu, as shown in Figure 16.
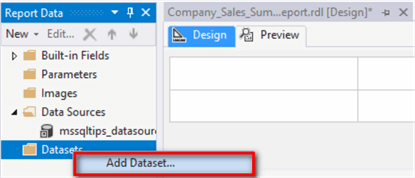
Figure 16 Add a New Dataset to the Report
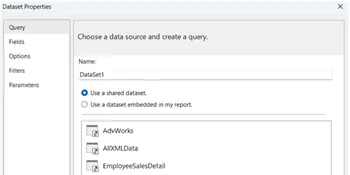
The “Dataset Properties” dialog appears. We use a dataset embedded in the report; therefore, we select “Use a dataset embedded in my report.” Select the shared data source “mssqltips_datasource” as the report data source and then, choose “Stored Procedure” as the “Query type.” Pick the stored procedure “uspGetCompanySalesSummary” from the dropdown list. We also use the stored procedure name as the name of the dataset. The “Dataset Properties” settings should look like Figure 17. Click the “Refresh Fields” button and then switch to the “Fields” tab to view a list of fields in this dataset. Click the “OK” button to close the dialog.
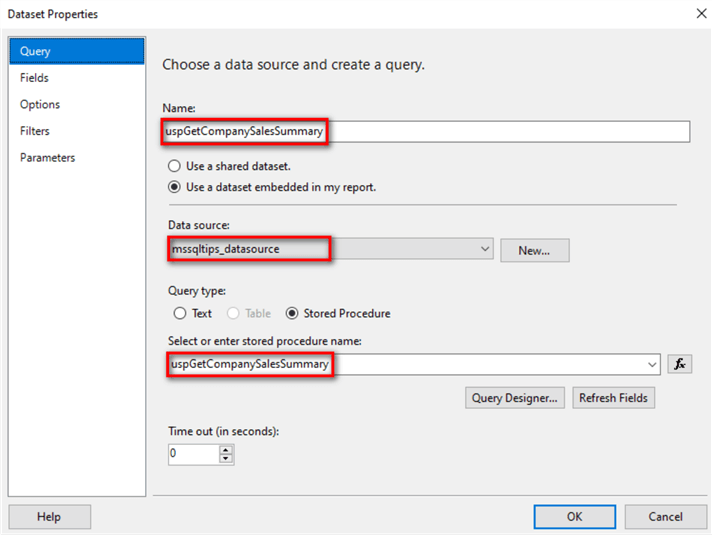
Figure 17 Add a Dataset to the Report
The “Report Data” panel should look like Figure 18. In this exercise, the report data contains one dataset. A report may have several datasets. Using a stored procedure name to be the corresponding dataset name, we can quickly identify which stored procedure loads data to the dataset.
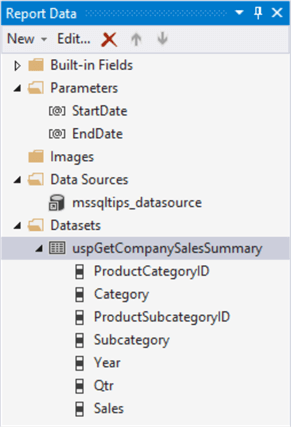
Figure 18 The Dataset Available to the Report
When we create a dataset from the stored procedure “uspGetCompanySalesSummary,” the use of the stored procedure triggers the creation of report parameters “StartDate” and “EndDate,” as shown in Figure 18. Right-click on the dataset “uspGetCompanySalesSummary” and select the “Dataset Properties” from the context menu. Choose the “Parameters” tab in the “Dataset Properties” dialog. As shown in Figure 19, the report parameters map to stored procedure parameters, respectively.
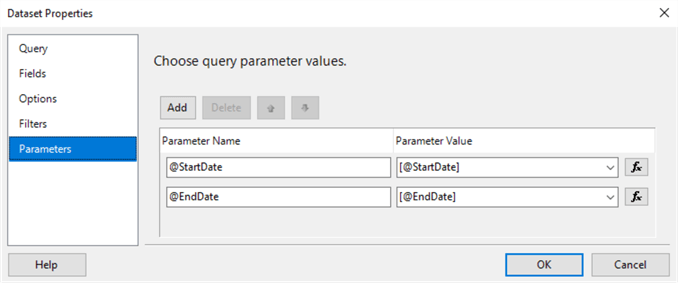
Figure 19 The Report Parameters Map to the Stored Procedure Parameters
2.2 Assign Default Values to Parameters
As a best practice, we add a default value for each report parameter. When building the report, we frequently preview the report. With default values, we do not need to specify values for these parameters when launching the report. This trick saves development time. Report users may also want to have default values for these report parameters.
Figure 18 indicates that the report has two parameters: StartDate and EndDate. Double click on the parameter name “StartDate” to bring up the “Report Parameter Properties” dialog. Switch to the “Default Values” tab. The dialog should look like Figure 20.
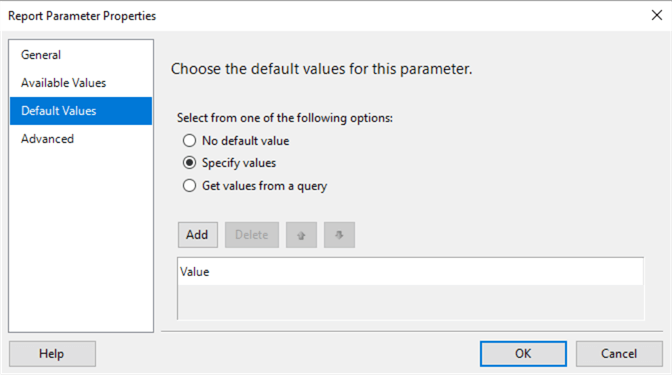
Figure 20 The Report Parameter Properties Dialog
Click on the “Add” button in the “Report Parameter Properties” dialog, and then enter a value of “2011-01-01” as the default value of the parameter “StartDate.” The dialog should look like Figure 21.
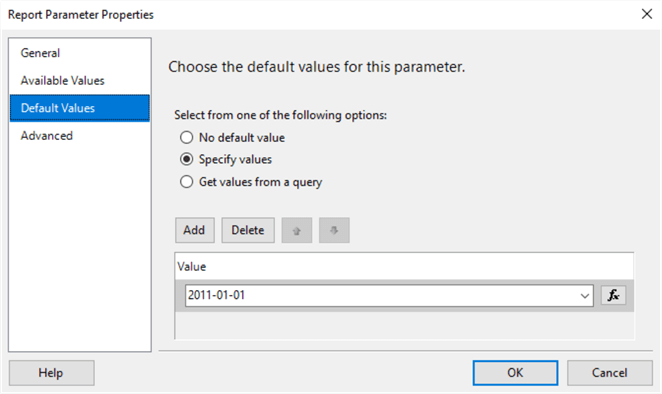
Figure 21 Assign a Default Value to the Parameter
Click on the “OK” button to close the “Report Parameter Properties” dialog. The report designer automatically transforms the string value to a date-time value because the data type of this parameter is date/time. We repeat the default value assignment process and assign a default value of “2014-12-31” to the parameter “End Date.” Next, activate the “Preview” tab. As shown in Figure 22, the two parameters have default values. If we want to pick another date for the “Start Date,” we click on the calendar icon to bring up a calendar dialog then choose the date.
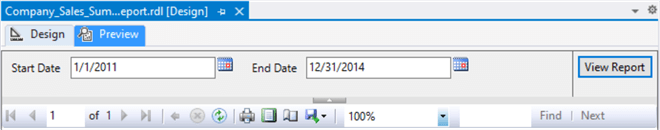
Figure 22 Report Parameter with Default Values in Preview Mode
2.3 Place a Matrix Data Region on the Report
The report designer provides several templates such as a table template, matrix template, and list template to organize data into rows and columns. These templates are data regions in SSRS. The table template can include row groups, and the matrix template can have both row and column groups. The list template can provide more free-style layout design but needs more design effort [10]. Since we want to build a cross-tabulation report in this exercise, we use the matrix data region.
2.3.1 Drag a Matrix Data Region to the Report
Switch to the “Toolbox” panel. Drag the “Matrix” item over the report body in the “Design” tab, and then drop it. The report design canvas should look like Figure 23. The data cell in the matrix is the intersection of a row and column groups.
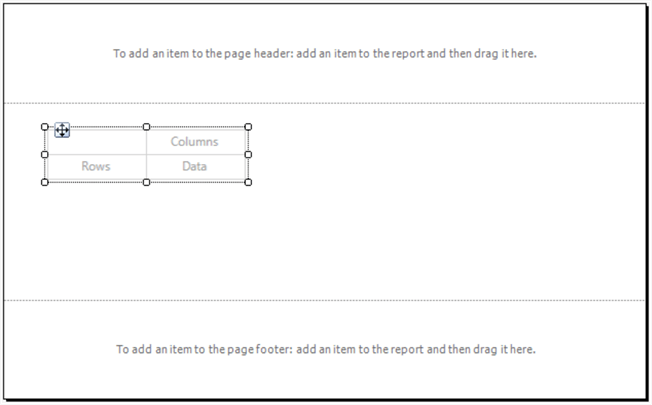
Figure 23 Add a Matrix Data Region to the Report
Select the matrix in the “Design” tab, and then look at the “Properties” panel. We change properties in the “Properties” panel according to Table 1. We immediately observe that the matrix moves to top-left in the report body section.
| Property | New Value |
|---|---|
| Name | matCompanySalesSummary |
| DataSetName | uspGetCompanySalesSummary |
| PageBreak: RepeatColumnHeaders | True |
| PageBreak: RepeatRowHeader | True |
| Location: Left | 0.05in |
| Location: Top | 0.05in |
Table 1 Set the Matrix Properties
2.3.2 Add Fields to the Matrix
The matrix has four cells in the default settings: an empty cell, a rows cell, a columns cell, and a data cell. When we move the cursor over the rows cell, columns cell, or data cell, an icon representing the field selector appears. Clicking on the icon, a list of fields in the dataset appears. The list of fields should look like Figure 24.
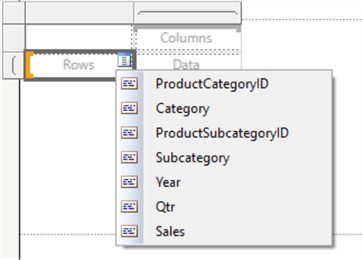
Figure 24 The Field Selector
Select the field “ProductSubcategoryID” for the row cell, the field “Qtr” for the column cell, and the field “Sales” for the data cell. The data cell automatically sums the sales amount. The matrix should look like Figure 25.
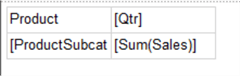
Figure 25 A Simple Version of the Cross-Tabulation Report
Switch to the “Preview” tab. We can select a different date range and then click on the “View Report” button to review data in a different period. When we select a date range from 2011-01-01 to 2012-06-30, the report should look like Figure 26.
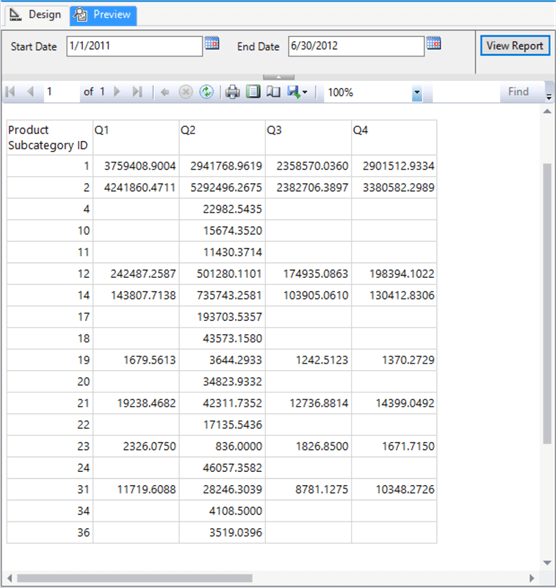
Figure 26 The First Glance of the Report
2.3.3 Add the Parent Grouping Levels to the Report
We created a row group and a column group. According to business requirements, each group has two levels:
- Row Group: Product Subcategory -> Product Category
- Column Group: Quarter -> Year
Several methods are available to add a parent group. We use the “Grouping” panel. When we right-click on any empty area in the report body, a context menu appears. The context menu should look like Figure 29. We display the “Grouping” panel by selecting the menu item “View -> Grouping.”
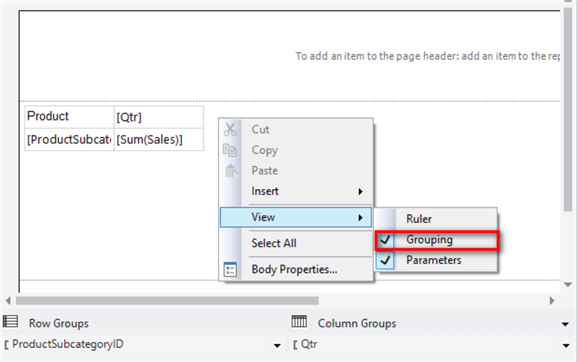
Figure 27 Display the Grouping Panel
Click on the down arrow in the “Row Groups” panel. The menu should look like Figure 30. We select the menu item “Add Group -> Parent Group.”
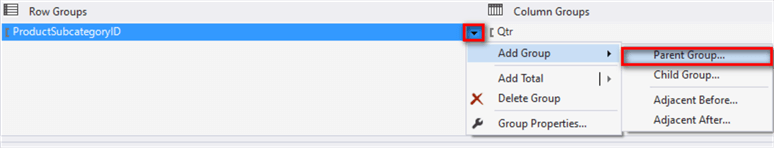
Figure 28 Add a Parent Group to the Row Group
The “Tablix group” dialog appears. We group the rows by “ProductCategoryID.” The dialog should appear like Figure 29. Since the name may change or duplicate, we group rows by the product category ID rather than the product category name.
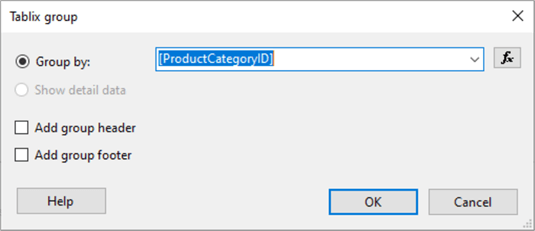
Figure 29 The Tablix Group Dialog
Click on the “OK” button to add the parent group. After dividing row data into two levels, we want to change the content in the row cells: “ProductCategoryID” and “ProductSubcategoryID.” Move the mouse over the “ProductCategoryID” cell. From the field selector, we select “Category.” We use the same method to replace the content in the “ProductSubcategoryID” cell with the “Subcategory” field. The matrix should look like Figure 30. The matrix still groups rows on the ProductCategoryID and ProductSubcategoryID, but we display fields “Category” and “Subcategory” in the row.
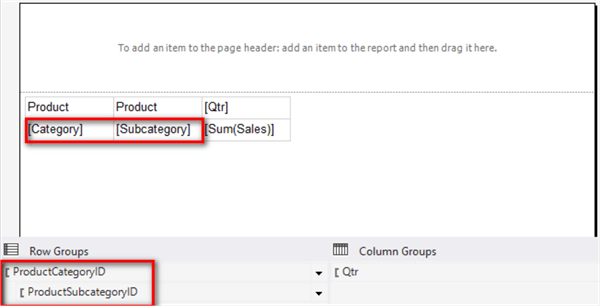
Figure 30 The Row Group Has Two Levels
Click on the down arrow beside the group “Qtr” in the “Column Groups” panel. Select the menu item “Add Group -> Parent Group” in the pull-down menu list. The “Tablix group” dialog appears. We add a parent column group that groups columns by “Year.” The dialog should look like Figure 31.
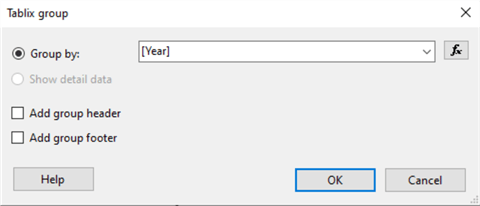
Figure 31 The Tablix Group Dialog
Click on the “OK” button to add the group. The canvas should look like Figure 32. The row represents the product category variable, which has two levels. The time variable, represented by the column, has two levels as well.
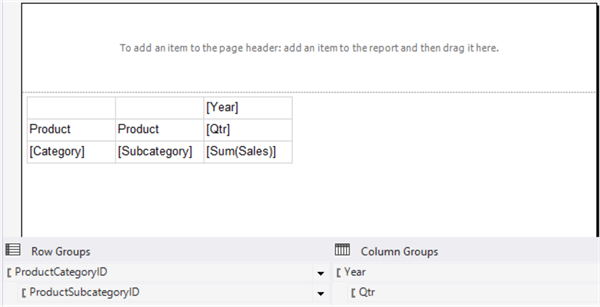
Figure 32 Add Multiple Grouping Levels to the Report
2.3.4 Add Totals to the Matrix
We want to add totals to the report. Click on the down arrow beside the row group “ProductCategoryID” in the “Row Groups” panel. The context menu should look like Figure 33.
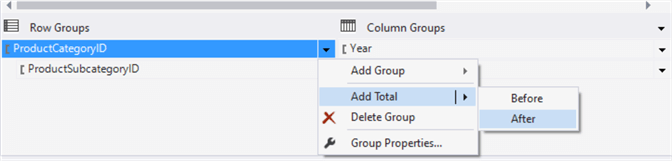
Figure 33 Add Totals to the Matrix
Select “Add Total -> After” from the context menu. A new row appends to the matrix. We use the same procedure to add a total on the group “Year.” The matrix should look like Figure 34.
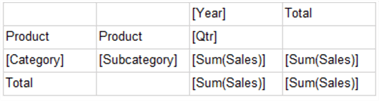
Figure 34 The Matrix with Totals on Rows and Columns
2.3.5 Decorate the Matrix
Switch to the “Design” tab and then click any area inside the matrix. Two grey bars appear to the left and top of the matrix, respectively. Click on the left grey bar to select the first row, as shown in Figure 35.
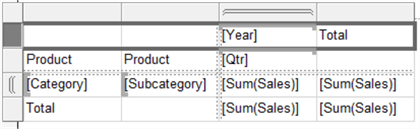
Figure 35 Select the First Row
With the first row selected, the “Properties” panel shows the row properties. Make the changes in the “Properties” panel based on settings in Table 2. Then select the second row and apply the same changes with the row properties.
| Property | New Value |
|---|---|
| BorderColor: Default | LightGrey |
| BorderColor: Top | DarkSlateBlue |
| BorderColor: Bottom | DarkSlateBlue |
| BorderStyle: Default | None |
| BorderStyle: Top | Solid |
| BorderStyle: Bottom | Solid |
| Font: Color | DarkSlateBlue |
| Font: FontFamily | Arial |
| Font: FontSize | 9pt |
| Font: FontWeight | Bold |
| TextAlign | Center |
Table 2 Set Properties of the First Row
Select the third row, i.e., the data row. Change the row properties in the “Properties” panel according to Table 3.
| Property | New Value |
|---|---|
| Font: FontFamily | Arial |
| Font: FontSize | 9pt |
| Font: Color | Black |
Table 3 Set the Data Row Properties
Select the fourth row, the last row. Except for not changing the “TextAlign” property, we use all other settings in Table 2 to set the fourth row’s properties. The matrix should look like Figure 36.
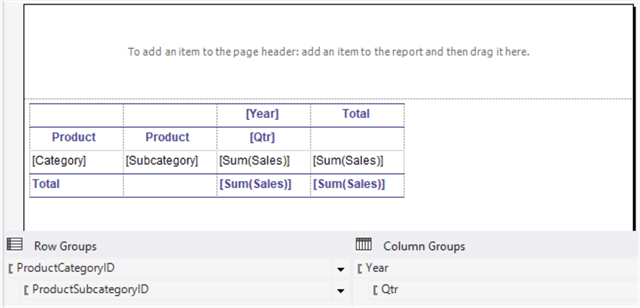
Figure 36 The Matrix on the Report
Since the cells Category and Subcategory have different properties from the numeric fields, we set properties of these two cells, individually. Select the cell “Category” and set the properties according to Table 4.
| Property | New Value |
|---|---|
| Font: FontFamily | Arial |
| Font: FontSize | 9pt |
| Font: FontWeight | Bold |
| Font: Color | DarkSlateBlue |
| BorderStyle: Left | None |
| BorderStyle: Right | None |
Table 4 Set the Cell's Properties in the Data Row
We apply the same property settings to the cell “Subcategory.” To maintain consistency in the layout, we select the last cell “Sum(Sales)” in the second row and change the property “BorderStyle: Right” to “None.” The matrix should look like Figure 37.
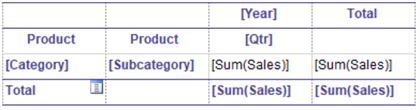
Figure 37 The Matrix on the Report
We do not need the column headers in the first two columns; we remove them by merging four cells. Select four cells, and then right-click to bring up a context menu, as shown in Figure 38.
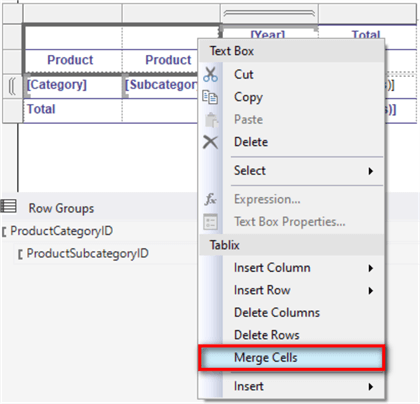
Figure 38 The Context Menu for Merging Cells
Click on the menu item “Merge Cells” to merge these four cells. We use the same merging method to merge the “Total” cells in the first column and last column. The matrix should look like Figure 39.
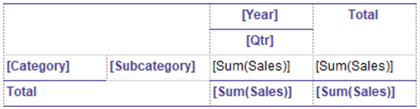
Figure 39 The Report Body with Merged Cells
The size of the contained items determines the column width and row height. Thereby, we usually set the minimum height and width of the cell by assigning values to its contained item’s height and width.
As a quick demonstration, we adjust each column’s width in the report matrix based on Table 5. Since each cell contains text, it is tricky to select the contained item in a cell. When we move the mouse over a text in the cell, we select the text by clicking on it. When we move the mouse over an empty area in the cell and click on the empty area, we select the textbox. The name in the “Properties” panel can tell which item we select.
| Cell | Size |
|---|---|
| Category | 1.2in, 0.19in |
| Subcategory | 1.4in,0.19in |
| Qtr | 1.0in, 0.19in |
| Year | 1.0in, 0.19in |
| Total Cell on the Last Column | 1.0in, 0.38in |
| Total Cell on the Last Row | 2.6in, 0.19in |
Table 5 Set Cell Width andHeight
Click on the “Preview” tab to view the report in the preview mode. The IDE automatically launches the report with default parameter values, and the report should look like Figure 40.
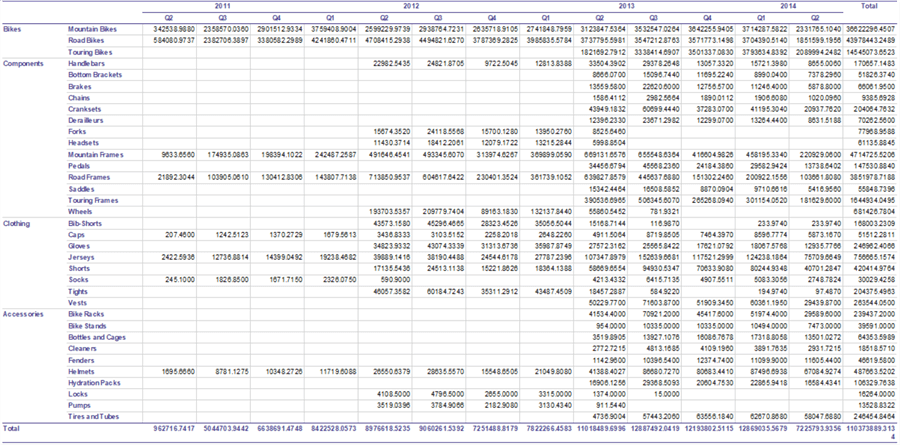
Figure 40 The Formatted Report in the Preview Mode
2.4 Format Numbers on the Report
Business users require two decimal places for any dollar amount. Four cells in the report have numeric values. We right-click on an empty area in the first textbox “Sum(Sales)” in the second row to bring up a context menu. Select “Textbox Properties…” from the menu. The “Text Box Properties” dialog appears. Set the textbox properties, as shown in Figure 41.
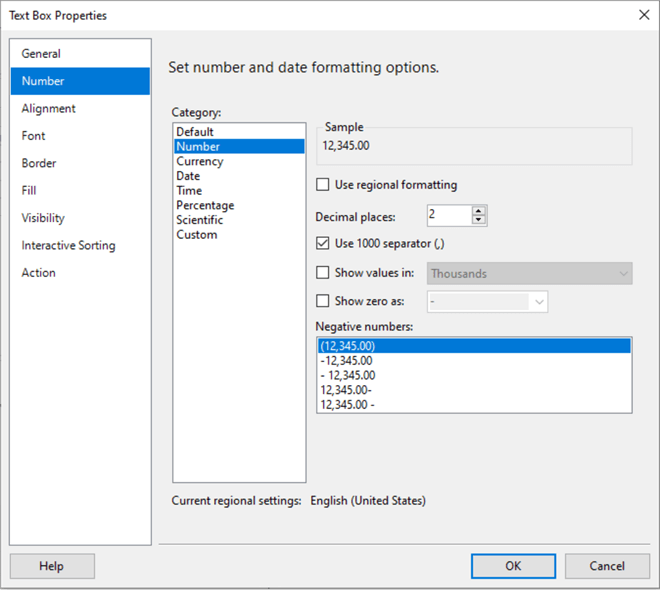
Figure 41 Set Number Formatting in the Text Box Properties Dialog
Click the “OK” button to close the dialog. The format property of this textbox in “Properties” panel is automatically set to “#,0.00;(#,0.00)”, as shown in Figure 42. Thus, we update the “Format” property of other numeric textboxes by using this value.
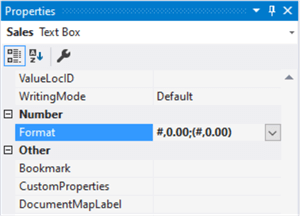
Figure 42 Set Formatting through the Properties Panel
Then, switch to the “Preview” tab. The numeric values should have two decimal places, and the report should look like Figure 43.
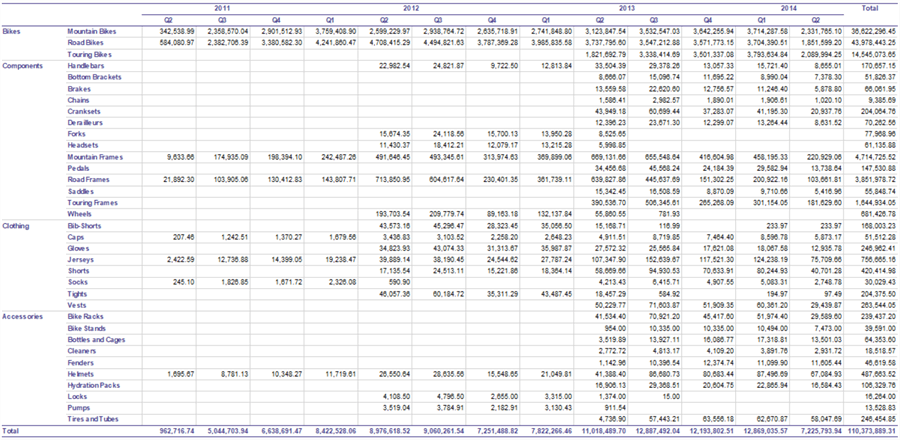
Figure 43 The Report Preview
2.5 Apply Colors to Alternate Rows in an SSRS Matrix
Through the menu item “Extensions -> Report -> Report Properties…”, we bring up the “Report Properties” dialog. Switch to the Code tab and copy the following code to the custom code box:
'*************************************************************************
' -- We use the Subcategory cell to toggle the BackGroundColor property.
' -- The other cells read the BackGroundColor defined by the Subcategory cell.
' -- Save the value of the BackGroundColor property in the report.
'*************************************************************************
Private _backGroundColor As String
'*************************************************************************
' -- This function reads the BackGroundColor saved in the report
' -- The first cell calls the function using this syntax:
' -- Code.GetBackGroundColor(True, "White", "AliceBlue")
' -- The rest cells call the function using this syntax:
' -- Code.GetBackGroundColor(False, "White")
'*************************************************************************
Function GetBackGroundColor(ByVal isFirstCell As Boolean,     _
   ByVal color1 As String, _
   Optional ByVal color2 As String = Nothing) As String
   dim backGroundColor As String
   If _backGroundColor = Nothing Then
      _backGroundColor = color1
   End If
   backGroundColor = _backGroundColor
   If isFirstCell Then
      If _backGroundColor = color1 Then
         _backGroundColor = color2
      Else
         _backGroundColor = color1
      End If
    End If
    Return backGroundColor
End Function
We can use SSRS custom code to create complex customized functions. In the "Report Properties" dialog, we navigate to the Code tab. After we paste the code to the custom code box, the dialog should look like Figure 44.
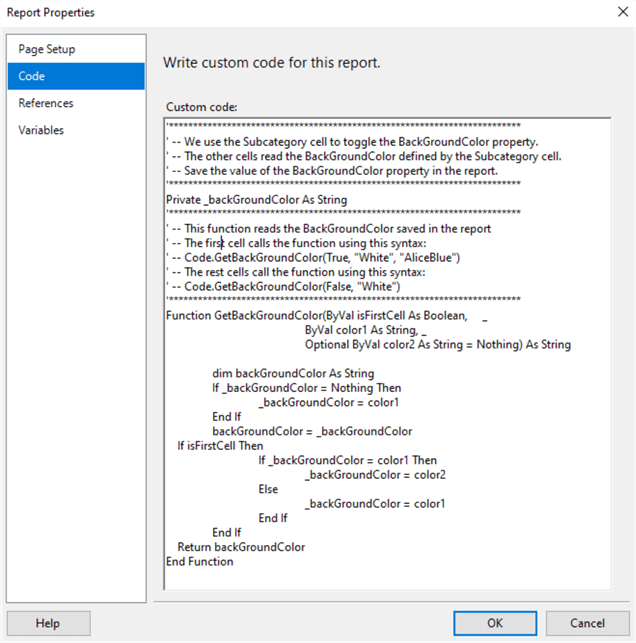
Figure 44 Write Custom Code for the Report
Then, we use an expression to determine the background color dynamically. Select the “Subcategory” in the matrix, and drill down into the “BackgroundColor” property in the “Properties” panel, as shown in Figure 45.
Figure 45 Set the Background Color of the Data Row
Select “Expression…” item from the pull-down menu. The “Expression” dialog appears. We enter the following expression in the dialog:
=Code.GetBackGroundColor(True, "White", "AliceBlue")
The “Expression” dialog should look like Figure 46. When we reference a valid custom code method, the expression editor may still warn that the identifier is invalid. We ignore the error and move forward.
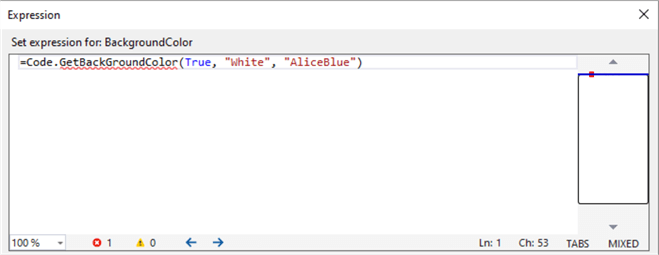
Figure 46 Enter an Expression to Determine the Background Color of a Detail Row
On the same row, we need to set the BackgroundColor” property for two “Sum(Sales)” cells. We use the same method to bring up the “Expression” dialog and enter the following expression in the dialog:
=Code.GetBackGroundColor(False, "White")
Switch to the “Preview” tab. The formatted report should look like Figure 47.
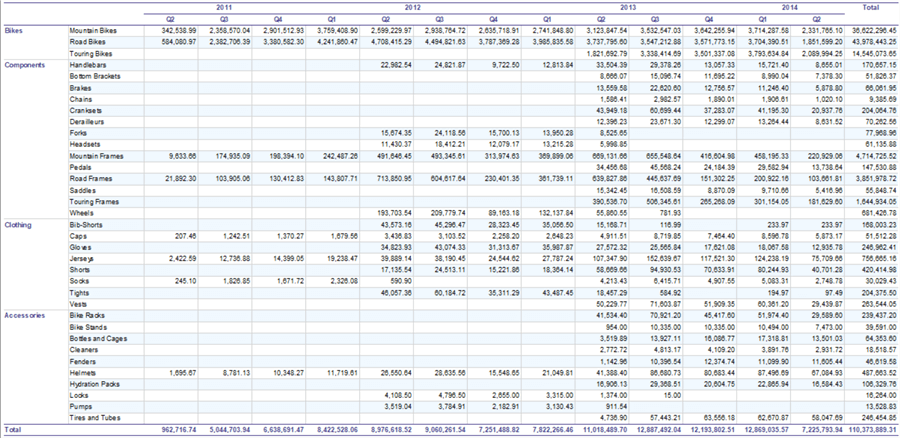
Figure 47 Apply Colors to Alternate Rows
2.6 Add a Report Header and Footer
The report header often includes information such as title, subtitle, and company logo. Some items, such as the date of generation and the page number, are in the footer section. We sometimes draw a line above or below the header or footer.
Since the matrix can automatically expand horizontally and vertically, we move the footer section close to the matrix. Then, we drag three textbox items to the header section and drag two textbox items to the footer section. We set the properties of these textboxes according to Table 6. We can set font properties through either the “Properties” panel or the IDE toolbar.
| Textbox No | Size | Text | Font | Expression |
|---|---|---|---|---|
| 1 | 4.0in,0.22in | Adventure Works Cycles Sales Department | FontFamily: Arial FontSize: 9pt | |
| 2 | 4.0in,0.22in | Sales Summary Report | FontFamily: Arial FontSize: 10pt FontWeight: Bold | |
| 3 | 4.0in,0.16in | From to (drag the parameters to the textbox) | FontFamily: Arial FontSize: 8pt | =Parameters!StartDate.Value =Parameters!EndDate.Value |
| 4 | 1.0in,0.16in | FontFamily: Arial FontSize: 8pt Color: LightGrey | =”Page ” & CStr(Globals!PageNumber) & ” of ” & CStr(Globals!OverallTotalPages) | |
| 5 | 4.0in,0.16in | FontFamily: Arial FontSize: 8pt Color: LightGrey | =”Generated at ” & CStr(Globals!ExecutionTime) |
Table 6 Configure Textboxes Properties
To precisely position these textboxes in the header and footer sections, we can use Ctrl + arrow keys to move a textbox when the textbox is selected. The layout design of this report should look like Figure 48.
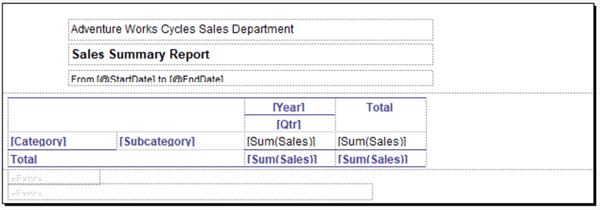
Figure 48 Add a Header and a Footer to the Report
2.7 Add Expand and Collapse Action to the Year Group
When users view the report, they want to group the sales summary by product category and year. When they want to access sales summary by subcategory or quarter, they can drill down a group into the lower level. The SSRS allows users to interactively expand or collapse rows and columns associated with a group for matrix [11].
Go to the “Grouping” panel and click on the down arrow to bring up a pull-down menu, as shown in Figure 49.
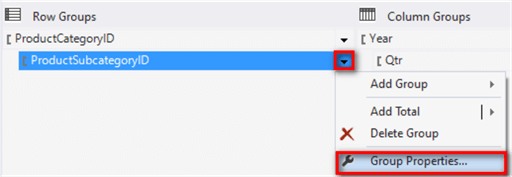
Figure 49 Access Group Properties
Click on the menu item “Group Properties” to bring up the “Group Properties” dialog and, then, switch to the “Visibility” tab. We change the display options according to Figure 50.
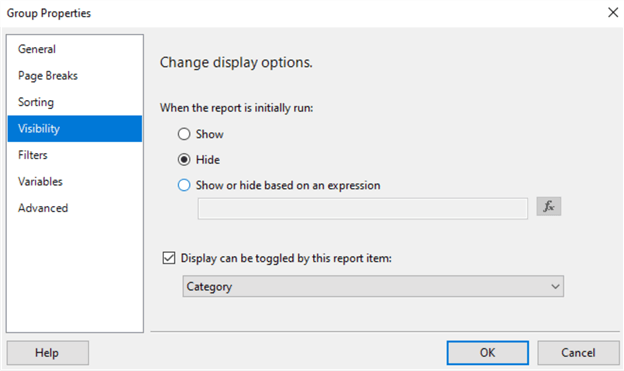
Figure 50 Change the Subcategory Group Display Options
We use the same procedure to bring up the “Group Properties” dialog for the “Qtr” group and, then, we change the display option according to Figure 51.
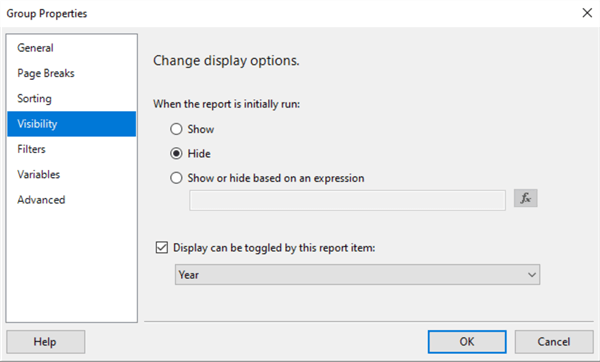
Figure 51 Change the Qtr Group Display Options
Switch to the “Preview” tab. The collapsed report should look like Figure 52.
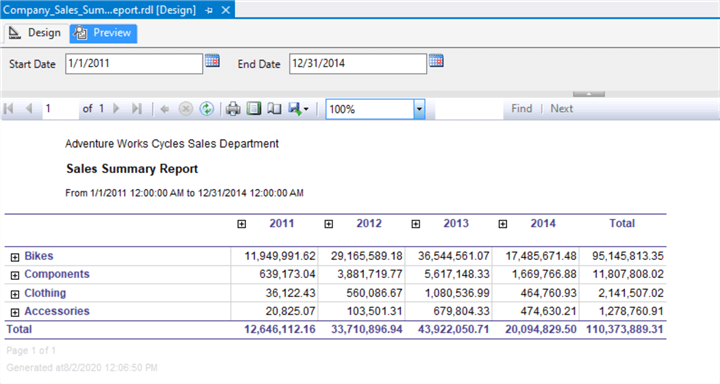
Figure 52 The Collapsed Report in the Preview Mode
Click on the plus signs beside the “Clothing” group and the “2013” group to expand the report. The report should look like Figure 53.

Figure 53 The Expanded Report in the Preview Mode
3 – Add Configurable Settings to the Report
In the SQL Server 2016 release, the SSRS provides a new web portal, which is a web-based application, for report managers to configure reports. We should draw a dividing line between the report development and report management. When we complete the development, the control of the reports passes to report managers. The report managers should be able to modify the reports without any development effort.
3.1 Create Parameters
Right-click on the “Parameters” folder in the “Report Data” panel. Select “Add Parameter…” menu item in the context menu. The “Report Parameter Properties” dialog shows up, and we fill-up the form according to Figure 54. We hide the parameter so that the report does not ask input from report users. The report managers can change the default value of the parameter through the web portal.
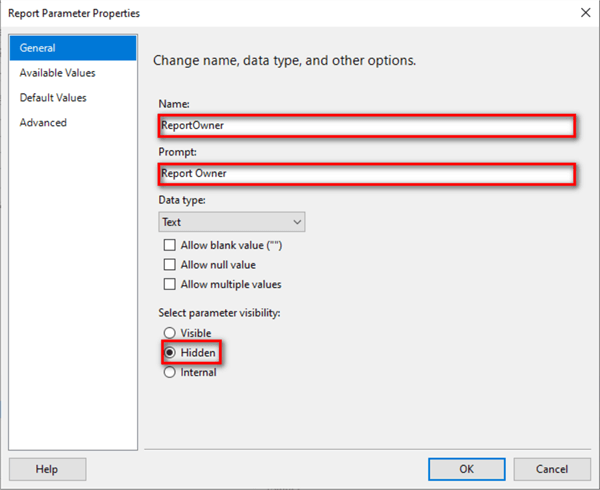
Figure 54 Create a New Report Parameter
Switch to the “Default Values” tab. Select the “Specify values” option and click the “Add” button to add a default value “Adventure Works Cycles Sales Department,” as shown in Figure 55.
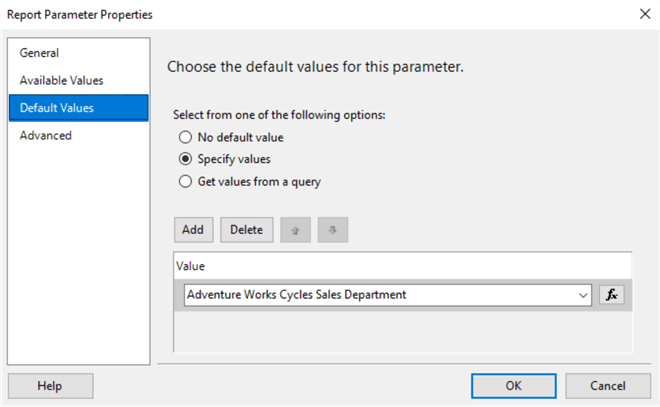
Figure 55 Specify a Default Value for the Parameter
Click the “OK” button to close the dialog. Then drag the new parameter “report_owner” to the first textbox in the header section and delete the other words in the box. The report header should look like Figure 56.
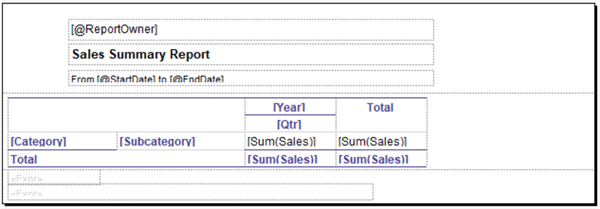
Figure 56 Parametrized Report Header Section
3.2 Use Report Metadata
The second textbox in the report header section contains the report name. Since report managers can change the report name through the web portal, we should use the built-in field “ReportName.” Right-click on the second textbox. The pop-up context menu should look like Figure 57.
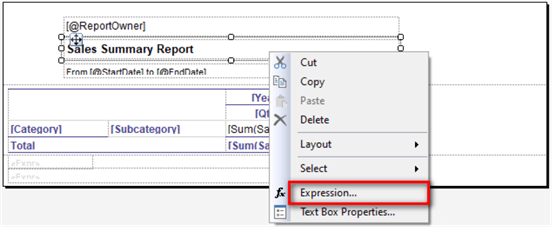
Figure 57 Use an Expression to Replace the Static Text
Select “Expression…” item from the context menu. The “Expression” dialog appears. We enter the following expression in the text box:
=Replace(Globals!ReportName,"_"," ")
Click on the “OK” button to close the dialog. The design view of the report should look like Figure 58.
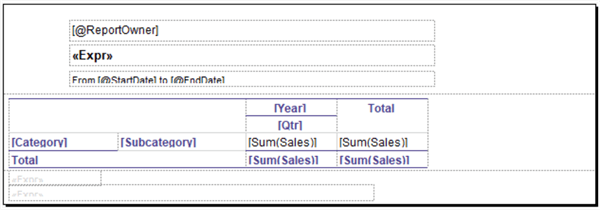
Figure 58 The Design View of the Report
4 – Add External Images to the Report
The report designer provides three options to reference images; the three options are “Embedded,” “External,” and “Database.” The “Embedded” option can always ensure images are available to the report, but images cannot be shared [9]. Further, report managers cannot replace images through the web portal. If images are part of data, such as product images, it will be preferable to use the “Database” option. For static images, such as a company logo, we should use the “External” option. By using the “External” option, we store images on the report server or a web server. In this exercise, we store a company logo on the report server.
4.1 Upload an Image to the Report Server
Access the web portal through the web portal URL such as “Http://<servername>/reports.” As shown in Figure 59, select the “Folder” item from the “New” pull-down menu. In the pop-up window, enter “IMAGE” as the new folder name and then click on the “Create” button to create the new folder. Use the “Upload” menu button to upload the logo of mssqltips.com to the IMAGE folder.
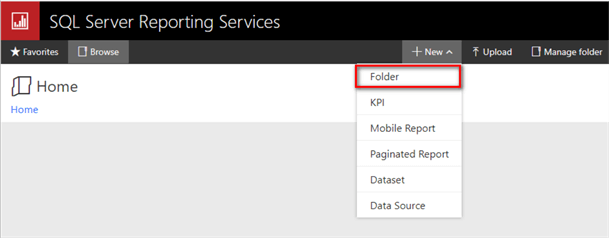
Figure 59 The Home Page of the Reporting Services Web Portal
Access the IMAGE folder on the web portal. The “IMAGE” folder page should look like Figure 60.
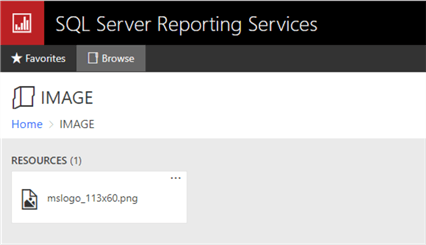
Figure 60 Upload the Logo to the IMAGE folder
Copy the logo image file into a local folder “C:\temp\.” When the report designer is in the preview mode, the report accesses the image from the local folder.
4.2 Configure the Unattended Execution Account
The SSRS provides a special account, the unattended execution account, to retrieve external image files. To configure the account, we first need to create or select a domain account, which should have reduced permission [12].
4.2.1 Specify the Unattended Execution Account
Run the “Report Server Configure Manager” from the start-up menu and, then, switch to the “Execution Account” panel. As shown in Figure 61, the description on the right panel introduces the special account. Select the “Specify an execution account” checkbox. Then, enter the account name and password. Click the “Apply” button to apply the changes.
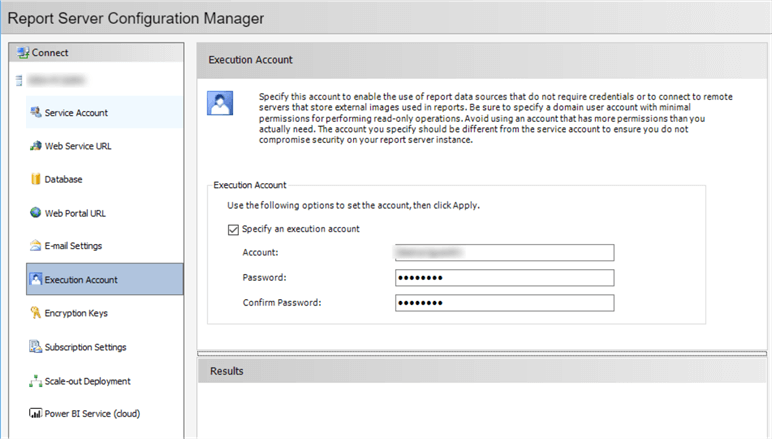
Figure 61 Configure the Unattended Execution Account
4.2.2 Configure a Folder Security
Access the web portal and click the “…” on the IMAGE folder’s top-right corner. Select the “Manage” menu item from the pop-up menu. The browser reaches the “Home -> IMAGE-> Manage -> Properties” page. Click the “Security” link button on the right panel and access the “Security” page, as shown in Figure 62.
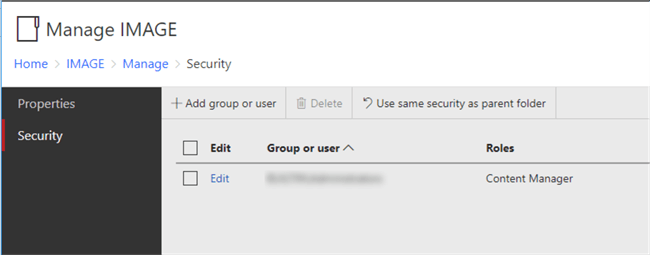
Figure 62 The Security Page of the IMAGE Folder
Click on the “Add group or user” link button and, then, assign the unattended execution account to the “Browser” role, as shown in Figure 63.
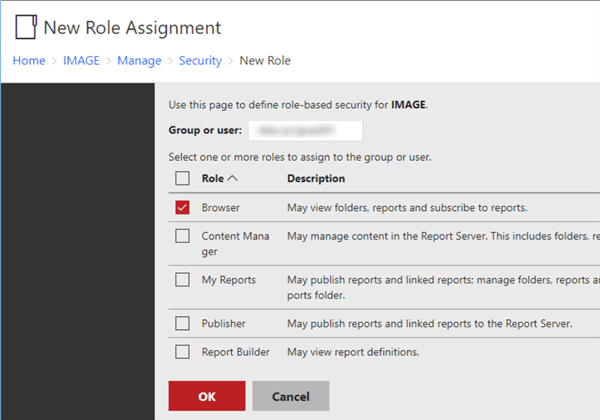
Figure 63 Give the Unattended Execution Account a Permission to Browser the Folder
Click on the “OK” button. The “Security” page should look like Figure 64.
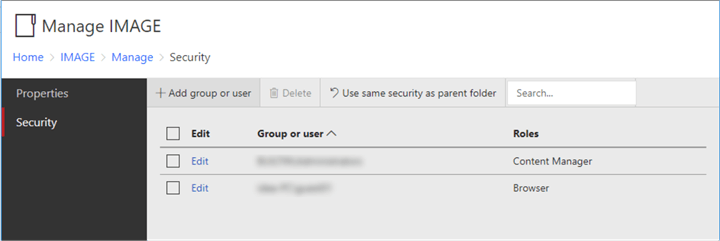
Figure 64 Security Page of the IMAGE Folder
4.3 Add the Image to the Header Section
Drag an Image item from the toolbox to the report header section. The “Image Properties” dialog appears. We name the image as “complayLogo” and choose the “External” as the image source. The dialog should look like Figure 65.

Figure 65 Set Image Properties
Click on the “fx” button beside the “Use this image” box, and enter the following code in the “Set expression for Value” box in the “Expression” dialog:
=IIF(Globals!ReportServerUrl is Nothing, "file:C:\temp\mslogo_113x60.png", Globals!ReportServerUrl + "?/IMAGE/mslogo_113x60.png")
The expression indicates that the report uses the image file in the local computer when we view the report on the “Preview” tab, and uses the image through “Http:// <servername>/reportserver?/IMAGE/mslogo_113x60.png” when we view the report from the report server. Click on the “OK” button to close the “Expression” dialog. Click the “OK” button to close the “Image Properties” dialog.
Move the Image item to the desired location, as shown in Figure 66. Sometimes, we need to go back to the “Image Properties” dialog to set up the image size.
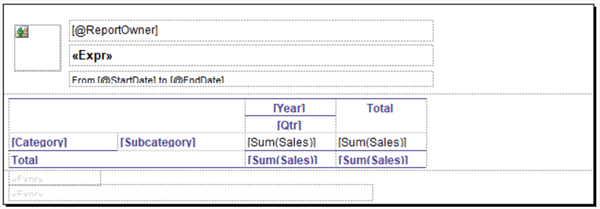
Figure 66 Place a Logo into the Report Header Section
5 – Access the Report through the Web Portal
The Reporting Services web portal allows us to publish our reports. Through the Internet, report users can access these reports. The web portal includes security configurations to folders and reports. We can also use the web portal to administer a single report server instance [13].
5.1 Deploy the Report to the Report Server through Visual Studio
Right-click on the report project in the “Solution Explorer” panel. Select the “Deploy” item from the context menu, as shown in Figure 67.
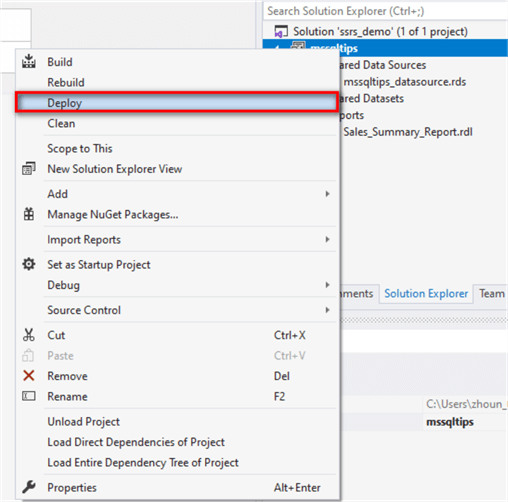
Figure 67 Deploy the Report Project through Visual Studio 2019
5.2 Access the Report through the Web Portal
The web portal URL consists of a hostname, port, and virtual directory [14]. Typing the URL, such as “Http://localhost/reports/,” in the browser’s address bar, we access the web portal. The report is in the folder “mssqltips_reports.” Then, we open the folder and double click on the report to launch the report. In the report page, we select a data range from 2011-01-01 to 2014-12-31. The report should look like Figure 68.
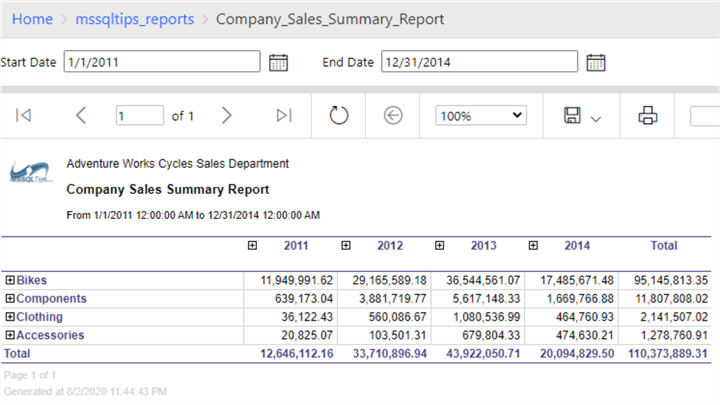
Figure 68 Access the Report on the Report Server
Click on the plus signs beside the Row “Clothing” and Column “2013.” The report shows the summary at a lower group, as illustrated in Figure 69.
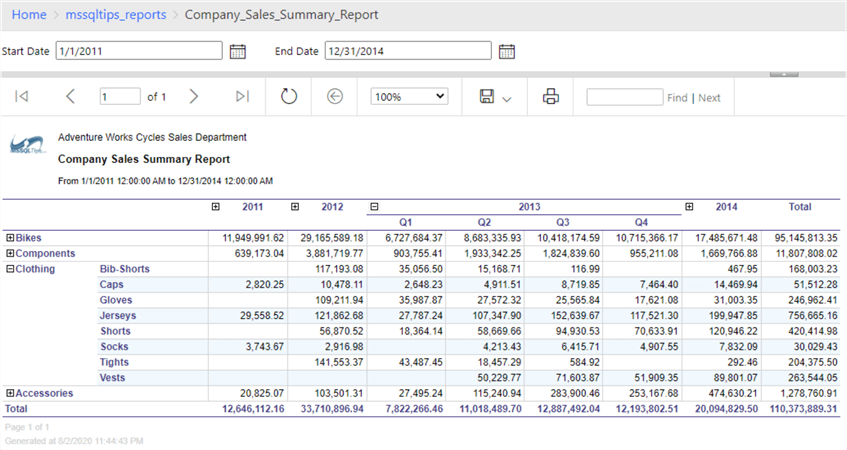
Figure 69 The Expanded Report
5.3 Modify the Report Header Through the Web Portal
Since some objects in the report header are configurable, report managers can use the web portal to modify these objects.
Access the page “Home > mssqltips_reports > Company_Sales_Summary_Report > Manage > Parameters” through the Web Portal. The page should look like Figure 70. When we change the default value of the parameter “ReportOwner,” the department name on the report changes accordingly.

Figure 70 Report Parameters Configuration Page
Access the page “Home -> mssqltips_reports -> Company_Sales_Summary_Report -> Manage -> Properties” through the Web Portal. If we want to change the report name on the report, we can change the name on this page shown in Figure 71.
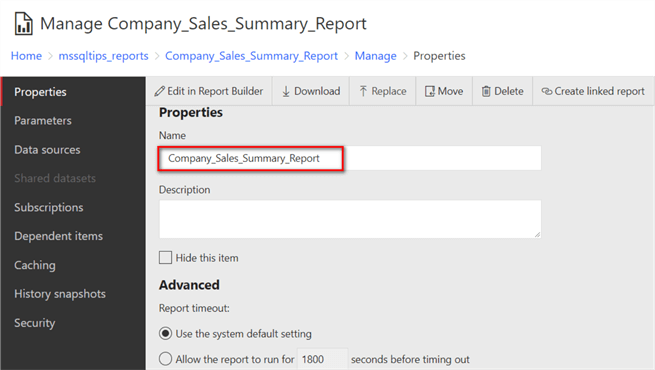
Figure 71 Change the Report Name
Summary
In this tip, we walked through a step-by-step process to create a ready-to-use, cross-tabulation report. We added a shared data source and an embedded dataset to the report. Through a matrix data region, the report divides sales summary data into row and column groups. To enhance readability, we apply colors to alternative rows in the matrix. We demonstrated the procedure to expand and collapse an item in the report. To enable report managers to customize the report, we created a hidden parameter with a default value, and the report used this value to decorate the header section. We presented an approach to add an external image to the report. Finally, we explored a method to access the report through the web portal.
Reference
[1] Pezzullo, C. J. (2013). Biostatistics for Dummies. Hoboken, NJ: John Wiley & Sons.
[2] Guyer, C., Keller, L., Hamilton, B., Sparkman, M., Rabeler, C., Ghanayem, M., Kumar, S., Milener, G., & Howell, W. J. (2017). Create a Matrix (Report Builder and SSRS). Retrieved from SQL Docs: https://docs.microsoft.com/en-us/sql/reporting-services/report-design/create-a-matrix-report-builder-and-ssrs?view=sql-server-ver15.
[3] Kess, B. (2017). AdventureWorks sample databases. Retrieved from Github: https://github.com/Microsoft/sql-server-samples/releases/tag/adventureworks.
[4] MSFTRSProdSamples: Microsoft SQL Server Product Samples: Reporting Services. Retrieved from https://archive.codeplex.com/?p=msftrsprodsamples.
[5] Kellenberger, K. (2016). Beginning SQL Server Reporting Services. Edwardsville, Il: Apress.
[6] Sparkman, M. (2020). Data Sources Supported by Reporting Services (SSRS). Retrieved from Microsoft: https://docs.microsoft.com/en-us/sql/reporting-services/report-data/data-sources-supported-by-reporting-services-ssrs?view=sql-server-ver15.
[7] Jin, Y. S., Wenzel, M., Latham, L., Hoffman, M., Jones, M., Blome, M. & Guyer, C. (2017). Managing Permissions with Stored Procedures in SQL Server. Retrieved from Microsoft: https://docs.microsoft.com/en-us/dotnet/framework/data/adonet/sql/managing-permissions-with-stored-procedures-in-sql-server.
[8] Sparkman, M., Guyer, C., Hamilton, Milener, G., Keller, L., B., Rabeler, C., Ghanayem, M., Kumar, S., & Howell, W. J. (2018). Create, Modify, and Delete Shared Data Sources (SSRS). Retrieved from SQL Docs: https://docs.microsoft.com/en-us/sql/reporting-services/report-data/create-modify-and-delete-shared-data-sources-ssrs?view=sql-server-ver15.
[9], Inmon, H. W. (2005). Building the Data Warehouse (4th Edition). Indianapolis, IN: John Wiley & Sons
[10] Sparkman, M., Milener, G., Howell, W. J., Guyer, C. & Rabeler, C. (2017). Tables, Matrices, and Lists (Report Builder and SSRS). Retrieved from SQL Docs: https://docs.microsoft.com/en-us/sql/reporting-services/report-design/tables-matrices-and-lists-report-builder-and-ssrs?view=sql-server-ver15.
[11] Guyer, C., Sparkman, M., Hamilton, B., Rabeler, C., Ghanayem, M., Kumar, S., Howell, J., & Milener, G. (2019). Add an Expand or Collapse Action to an Item (Report Builder & SSRS). Retrieved from SQL Docs: https://docs.microsoft.com/en-us/sql/reporting-services/report-design/add-an-expand-or-collapse-action-to-an-item-report-builder-and-ssrs?view=sql-server-ver15.
[12] Guyer, C., Sparkman, M., Milener, G., Hamilton, B., Kumar, S. & Rigney, R. (2017). Configure the Unattended Execution Account (SSRS Configuration Manager). Retrieved from SQL Docs: https://docs.microsoft.com/en-us/sql/reporting-services/install-windows/configure-the-unattended-execution-account-ssrs-configuration-manager?view=sql-server-ver15.
[13] Ghanayem, M., Milener, G., Howell, W. J., Guyer, C. & Sparkman, M. (2017). The web portal of a report server (SSRS Native Mode). Retrieved from SQL Docs: https://docs.microsoft.com/en-us/sql/reporting-services/web-portal-ssrs-native-mode?view=sql-server-ver15.
[14] Guyer, C., Sparkman, M., Hamilton, B., Sherer, T., & Ghanayem, M. (2017). Configure the web portal. Retrieved from SQL Docs: https://docs.microsoft.com/en-us/sql/reporting-services/report-server/configure-web-portal?view=sql-server-ver15.
Next Steps
- This tip placed focus on creating a ready-to-use report at work. Many methods used in this tip have alternative solutions. We chose straightforward solutions to move forward in building the report. However, these solutions may not best fit all situations. If we do not have much background in report development, we follow this tutorial to create a report. Then, we play with other features provided by SSRS to make the report better. If an organization starts to use SSRS reports, report developers should work with report users to compile some reporting conventions such as report layout, font size, and text alignment. These conventions help to maintain consistency in the organization.
- Check out these related tips:
- What's New for SQL Server Reporting Services 2016 Q&A
- Installing SQL Server Reporting Services 2017
- SQL Server Reporting Services 2017 Setup
- SQL Server Reporting Services (SSRS) Repeating Headers on Pages
- SQL Server Reporting Services Image Source Report Options
- Rendering images from a database on SSRS reports
- SQL Server Reporting Services Custom Code Assemblies
- Alternate Row Background Color in SQL Server Reporting Services Tablix and Matrix
- SQL Server Reporting Services Formatting and Placeholders
- SQL Server Reporting Services: What I wish I knew when I started?
- Conditional Formatting for SQL Server Reporting Services Reports
- Alternate Row Background Color in SQL Server Reporting Services Tablix and Matrix

Nai Biao Zhou has twenty years of experience in software development, with strong analytical skills and a broad range of computer expertise.
He has fifteen years of experience in development and maintenance of database applications on SQL Server in OLTP/OLAP/BI environments.
He has a master’s degree in Control Engineering and is pursuing a Master of Science degree in Predictive Analytics.
Knowledge/Skills
Advanced computer programming skills and well versed with C/C#, Java, ASP.NET, JavaScript, and SQL.
In depth knowledge of Solution Architecture, and Software Development Life Cycle (SDLC).
Microsoft Certified Application Developer (MCAD) since 2004.
- MSSQLTips Awards: Author of the Year – 2021 | Rising Star (50+ tips) – 2024 | Author Contender – 2020, 2023

Hello Ryan,
Thank you for the question.
According to the document: https://learn.microsoft.com/en-us/sql/reporting-services/install-windows/configure-the-unattended-execution-account-ssrs-configuration-manager?view=sql-server-ver16, the Unattended Execution Account must use a domain user account. The purpose of using this account is to access external resources rather than log in to database servers.
Nai Biao Zhou
How do I create an unattended execution account in SSMS?