Problem
There are a few different methods for developing, scheduling, and monitoring Lakehouse ELT pipelines using Apache Spark in Azure. Apache Spark ELT pipelines and jobs can be created and scheduled in Databricks, Data Factory, and Synapse Analytics workspaces. Apache Spark is widely used for processing big data ELT workloads in Azure and since there are numerous tools and technologies for processing these workloads, understanding the various methods for leveraging Apache Spark for ELT in Azure can be overwhelming.
Solution
In this article, you will learn about the various methods and applications that can be used to create and support your Data Lakehouse ELT design, development, scheduling, and monitoring of pipelines in Azure. With a focus on Apache Spark for development of these pipelines, you’ll get a deeper understanding of these various options which include Data Factory’s Mapping Data Flows and Spark activity, Databricks, and Synapse Analytics workspace jobs and pipelines.
Databricks
Databricks jobs support the orchestration and scheduling of one or more dependent tasks that contain ELT code from a Databricks notebook, Delta Live Table pipelines, or applications written in Scala, SQL, Java, or Python. The environments, parameters, libraries, and clusters can be defined and customized in the jobs. One of the key benefits is the variety of development languages and processes that can be used within the jobs, along with the ability to control the execution order of tasks by specifying dependencies. Tasks within a job can be executed sequentially based on dependencies or in parallel. The figure below demonstrates how you could potentially create a job with series of sequentially dependent or parallel tasks.

From the figure below, notice that you could easily call your Python, Scala, or SQL Databricks notebook in the task, specify your cluster type, add parameters through UI or JSON, and specify whether the task depends on another task to orchestrate the job.

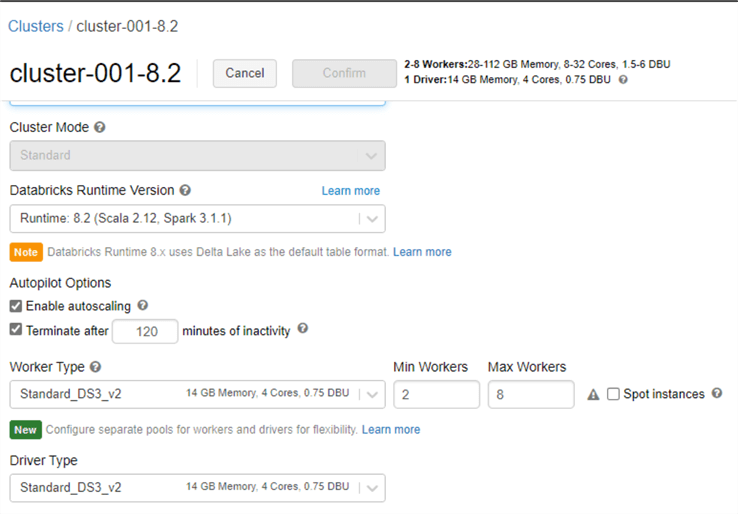
Databricks job clusters are highly customizable. Runtime versions are constantly being upgraded to offer better capabilities and support. That said, it is important to ensure that your notebook code is up to date and compatible with newer runtime versions. Within a Databricks cluster, there is an option to enable autoscaling of the cluster between a min and max number of predefined nodes based on load. Also, auto-termination stops the cluster after a set number of minutes to prevent costs from incurring. It is important to note also that these Databricks clusters can also be used within Data Factory to support more customized cluster configurations. For example, in Data Factory you may have a minimum cluster that is running 4 workers but only need 2 workers. In such a scenario, you could leverage the Databricks cluster configured for 2 workers and use that in your Data Factory pipelines.
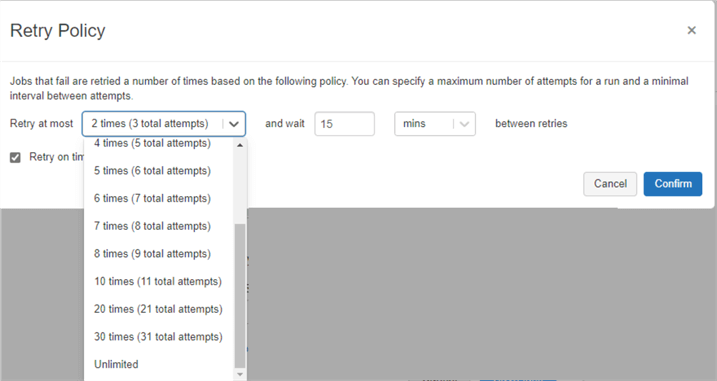
Additional advanced options for the Databricks Job allows you to specify custom retry policies along with intervals between policies. Within advanced options, you could also add email notifications for the start, success, and/or failure of the task. There are also options for adding dependent libraries to the task and editing timeout values for the task. Each task within the job could be customized with these advanced options.
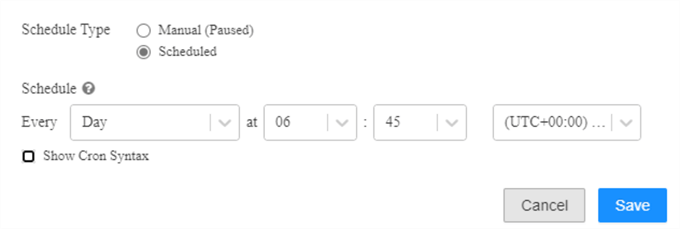
Finally, once your job is developed by combining and orchestrating a collection of tasks, you can flexibly schedule the job with the optional Cron Syntax feature to further customize the scheduling experience.
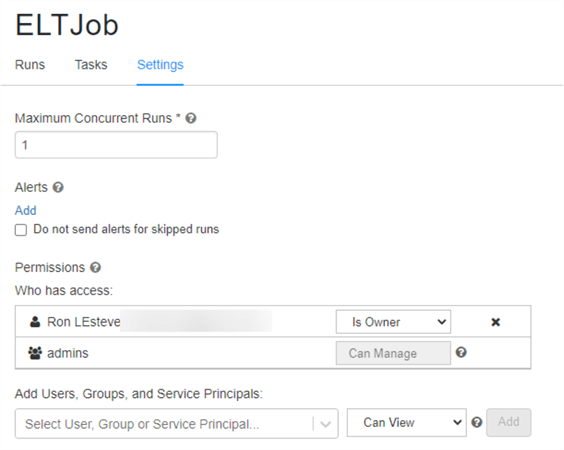
In the settings tab of the job, you could specify the maximum concurrent runs of the job. This is useful if you want to allow successive runs to overlap with each other, or if you want to trigger multiple runs that differ by their input parameters. You could also add alerts at the job level in addition to the task level. Lastly, you could add permissions here for who can view, manage, run, and own the job.
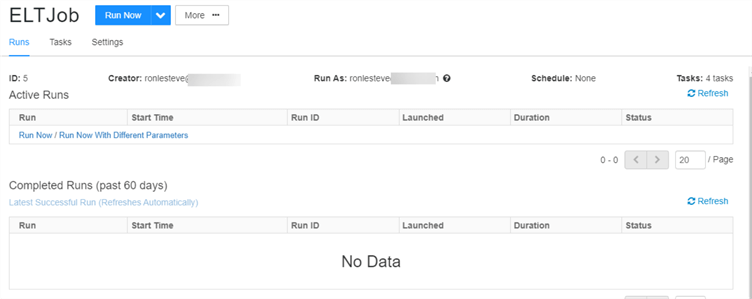
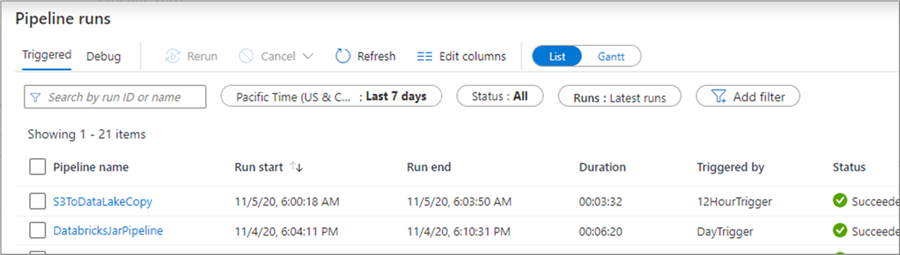
Once the job is scheduled and run, you’ll be able to view details around its activity runs within the Runs tab of the job page. It is in this page where you would be able to visually monitor both active and completed historical runs within the past 60 days. This experience is somewhat similar to Data Factory’s visually monitoring UI capability. The added benefit of using Databricks jobs is that you could also combine Delta Live table pipelines within the tasks of these jobs. For a better integration experience with other Azure applications and processes and as an alternative to Databricks jobs, Databricks notebooks can be executed from Data Factory’s Databricks job activity, integrated with other Azure applications such as Mapping Data Flows, functions etc., and scheduled/monitored in Data Factory.
Data Factory
Azure Data Factory offers a robust toolset for developing, scheduling, alerting, and visually monitoring pipeline activity and runs within its UI. Within Data Factory, Apache Spark can be leveraged for big data ELT workload processing with both Mapping Data Flows and the Spark activity. In this section, you will learn how to optimally create and run Apache Spark jobs in Data Factory.
Mapping Data Flows
Mapping data flows are visually designed data transformations within Data Factory that support the design and development of complex transformation logic with minimal code. These data flows can be executed on scaled-out Apache Spark clusters that are spun up at run-time and then operationalized using Data Factory scheduling, control, flow, and monitoring capabilities.
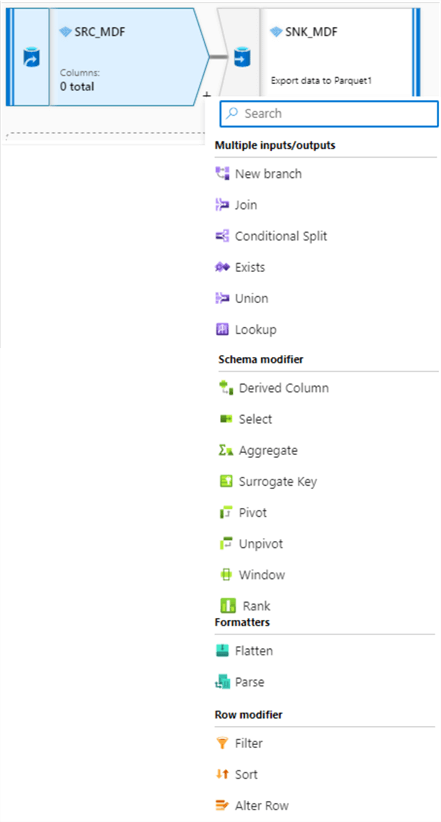
Within Mapping data flows, Data Engineers have access to a variety of data transformation activities, as shown in the figure below. These include joins, splits, lookups, complex schema and row modifiers, along with complex formatters such as flatten and parse transformations.
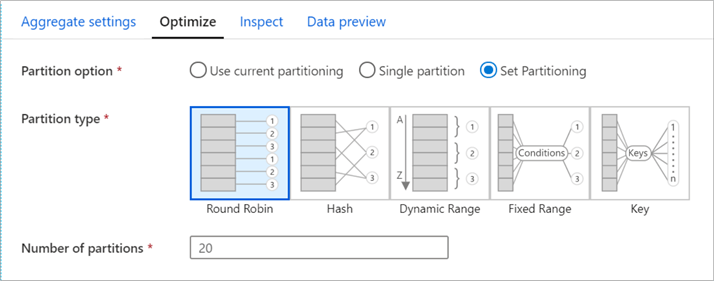
Mapping data flows supports optimizations including defining and configuring the partitioning scheme of the Spark cluster. It supports the repartitioning of data after the transformation has completed and allows you to control the distribution of your data across compute nodes. This is a powerful configuration that must be used with care to ensure that you are optimally partitioning your data.
Once you have completed developing you mapping data flow transformation logic, you can add the Data flow to the activity within Data Factory and integrate it with other pipeline processing steps. Additionally, you could also define the compute type, core count, logging levels, and more as you prepare this Data flow activity to be scheduled and monitored.
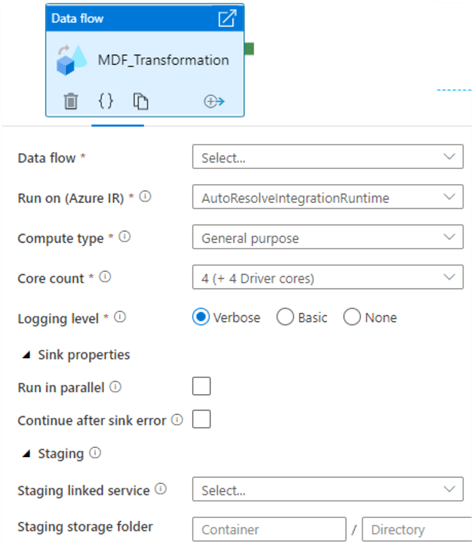
Compute Type: The three available Spark cluster options in Mapping Data Flows are general purpose, memory optimized, and compute optimized. General purpose clusters are the default, ideal for most workloads, and balance performance and cost. Memory optimized clusters are ideal for data flows with many joins and lookups since they can store more data in memory to minimize out of memory errors, and come at a higher price point per core. Finally, compute optimized clusters are ideal for simple, non-memory intensive data transformations such as filtering, adding derived columns. They are not recommended for ELT or production workloads and come at a cheaper price per core.
Logging Level: For pipeline executions that do not require fully logged activities, Basic or None could be selected. Alternatively, ‘Verbose’ requests ADF to fully log activity at each individual partition level during your data transformation.
Time to Live: Data flows spin up new Spark clusters based on the Azure IR configurations. Since these clusters take a few minutes to start up, the time to live (TTL) feature specifies how long to keep the cluster running after executing a job. This is a valuable setting when your pipeline contains multiple sequential data flows. The ‘Quick re-use’ feature also minimizes startup time by keeping the compute environment alive for the period specified in the TTL. For parallel data flow executions, ADF does not recommend enabling TTL for the activity’s IR since only one job can run on a single cluster at a time and when two data flows start, the second will spin up its own cluster.
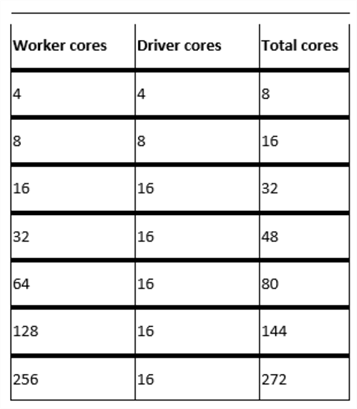
Core Count: Data flows distribute processing over nodes in a Spark cluster to complete operations in parallel. More cores translate into more nodes which increase processing power and decrease processing time. While the default cluster size is four driver and worker nodes, the cluster is capable of scaling up to the core counts specified in the figure below.
HDInsight Spark Activity
The Spark activity within Data Factory pipelines supports the execution of a Spark program on your own or on-demand HDInsight clusters. With an on-demand Spark linked service, Data Factory will automatically create a Spark cluster to process the data and will then delete the cluster after the processing is completed. Similar to most other Data Factory pipeline activities, the Spark activity supports custom defined timeouts and retry intervals. Additionally, it can be chained to other Data Factory pipeline activities and can accept variables and parameters. Note that HDInsight clusters come with their own pricing tiers which will need to be thoroughly evaluated and compared to other available clusters across Mapping Data Flows, Databricks, and Synapse Spark Pools.

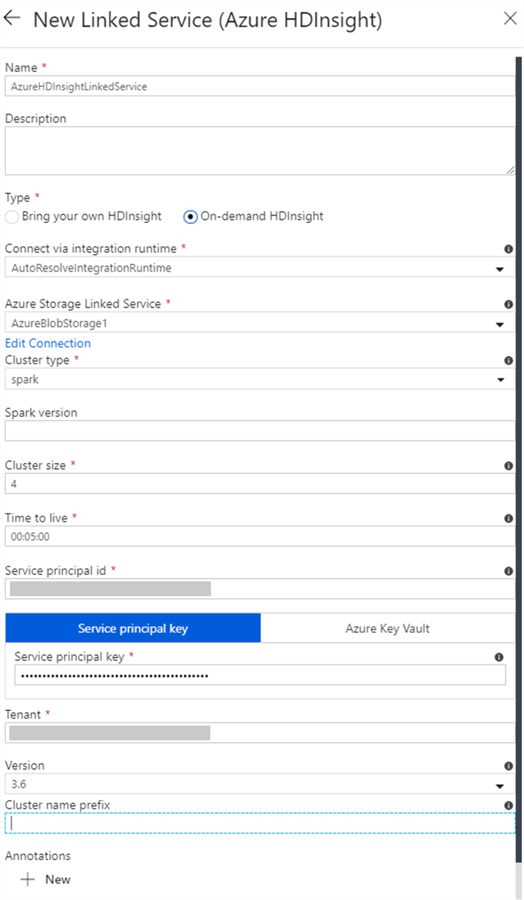
Azure HDInsight is a managed Apache Hadoop service that lets you run Apache Spark, Apache Hive, Apache Kafka, Apache HBase, and more in the cloud. One of the advantages of this Spark activity is that you can either bring your own HDInsight cluster or use an On-demand HDInsight cluster. When selecting the ‘On-demand HDInsight’ option, you must configure the properties listed in the figure below.
The ‘Time to Live’ specifies how long the on-demand HDInsight cluster stays alive after completion of an activity run if there are no other active jobs in the cluster, and the minimal allowed value is 5 minutes. The ‘Cluster Size’ defines the number of worker nodes in the cluster. The HDInsight cluster is created with 2 head nodes along with the number of worker nodes you specify for this property. The nodes are of size Standard_D3 that has 4 cores, so a 4-worker node cluster takes 24 cores (4*4 = 16 cores for worker nodes, plus 2*4 = 8 cores for head nodes).
The advantage of this Spark activity is that it supports the execution of highly customized Python scripts or JAR files that are stored in your Data Lake Storage Gen2 account. These scripts will be executed on the pre-defined cluster and is application agnostic in that you will not need an instance of either a Databricks or Synapse Analytics workspace notebook to persist and containerize your code. The code can simply be stored as a .py file in your ADLS gen2 account and be executed on the cluster defined in this Spark activity.
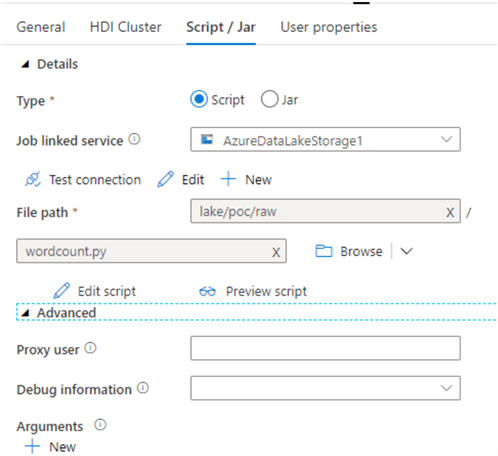
Here is a generic sample Python script file which takes an input sentence, splits the words out on individual lines and outputs the results to a defined storage account. This script, wordcount.py can be called from the Spark activity, as shown in the figure above.
import sys
from operator import add

from pyspark.sql import SparkSession

def main():
    spark = SparkSession        .builder        .appName("PythonWordCount")        .getOrCreate()

    lines = spark.read.text("wasbs://adftutorial@<storageaccountname>.blob.core.windows.net/spark/inputfiles/minecraftstory.txt").rdd.map(lambda r: r[0])
    counts = lines.flatMap(lambda x: x.split(' '))         .map(lambda x: (x, 1))         .reduceByKey(add)
    counts.saveAsTextFile("wasbs://adftutorial@<storageaccountname>.blob.core.windows.net/spark/outputfiles/wordcount")

    spark.stop()

if __name__ == "__main__":
    main()
Scheduling and Monitoring
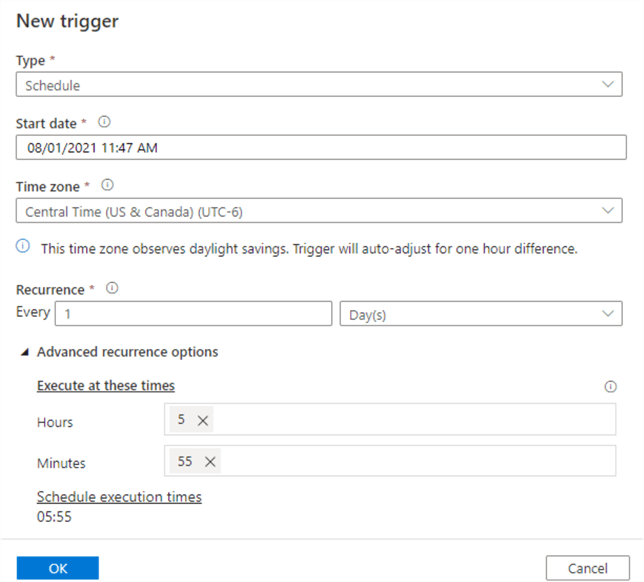
Azure Data Factory pipelines can be triggered manually and through a few scheduling methods. A Scheduled trigger invokes a pipeline based on a defined start and end date. It can be customized for recurrences as low as every one minute and as high as monthly schedules. A Tumbling window trigger operates on a periodic interval. Finally, an Event-based trigger responds to an event, which could be either storage events or custom events.
Data Factory offers a robust monitoring and alerting framework that allows a variety of customizations for visually monitoring pipeline and detailed activity runs within each pipeline. Within this monitoring UI, you can also manually re-run failed pipelines or cancel running pipelines. There are also options for monitoring consumption and alerting users on a variety of alert condition metrics.
Synapse Analytics Workspace
Azure Synapse Analytics Workspace is based on the existing Data Factory UI experience, therefore many of the scheduling and monitoring capabilities of Data Factory will also be redundant and applicable to workloads that are run within Synapse Analytics Workspace.
Within Synapse Analytics workspaces, users have access to Serverless SQL pools, Dedicated SQL pools, and Apache Spark pools. Serverless SQL pools support the need for ad-hoc querying and to further explore data to derive real time insights. They are created when the Synapse workspace is provisioned and it is essentially used to query data as a service. In addition, Dedicated SQL pools can be used when performance requirements are well defined and there is a need to persist, deliver, and maintain data in a traditional distributed data processing engine. Apache Spark pools in Synapse Analytics workspaces can be used for analytics using in-memory big data processing engine.
The default Spark node size is memory-optimized and it has a few options: Small (~4 vCores/32GB), Medium (~8 vCores/64GB), Large (~16 vCores/128GB), XLarge (~32 vCores/256GB), XXLarge (~64 vCores/432GB), XXXLarge (~80 vCores/2504GB). Auto-scaling can be enabled and is determined by the number of nodes defined in the scale settings.

In the next step, you’ll need to provide additional configuration settings related to pausing the cluster if it has been idle for a certain time. The default setting is 15 minutes. Additionally, there is an option to select the version of Spark to be used and options to upload environment configuration files.

After the Spark pool is created, you’ll be able to develop your ELT code within a new notebook in the Synapse Analytics workspace, attach it to the Spark pool and then add the notebook to either a new or existing pipeline.
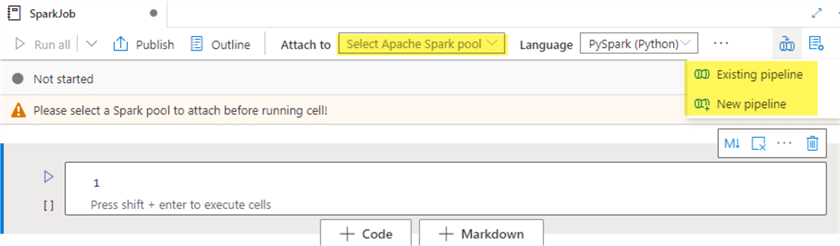
After adding the notebook to a new pipeline, notice the Notebook activity within Synapse pipelines, which is quite similar to Data Factory pipelines. The notebook is now available to be scheduled and monitored much like how the Data Factory pipelines are triggered and visually monitored. There are other Synapse activities that could be combined with this notebook.

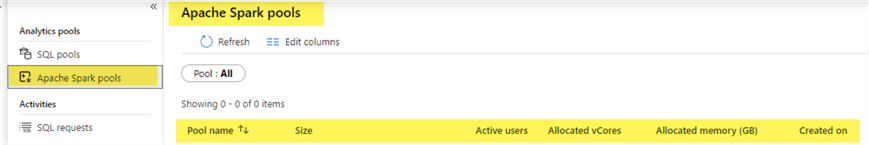
As for monitoring the Apache Spark pools, Synapse pipelines offers the capability to monitor the Spark pools visually within the monitor UI. For Spark pools, users have the ability to monitor the pool size, active users, allocated vCores and memory (GB), and when the pool was created.
Within the Apache Spark applications tab, users will be able to monitor the status, timestamp and various other metrics of the notebook that is run on the Spark pool. The visual monitoring experience is very similar to the monitoring of Data Factory pipelines.

Summary
In this article, you gained a deeper understanding of the various ways of creating, scheduling, and monitoring Apache Spark ELT jobs in Azure by using Data Factory’s Mapping data flows and Spark activity pipelines, Databricks jobs, and Synapse Analytics workspace pipelines. Mapping Data flows offers a low-code data engineering experience, while the Spark activity offers a more customizable experience within Data Factory’s native toolset. The Spark activity may be useful in scenarios where you’ll need to bring your own HDInsight cluster. In other scenarios it may be beneficial to consider Databricks for your ELT and scheduling them within either Databricks or the Data Factory pipeline experience. Synapse Analytics workspaces bring Spark pools as a service that can be used for custom development in a notebook experience and then scheduled / monitored with Synapse pipelines. As you continue your journey with implementing the Lakehouse architecture with big data ELT workloads, you’ll be better equipped with choosing the right tool for creating and scheduling your ELT jobs.
Next Steps
- Read more about how to Transform data by using Spark in Azure Data Factory
- Read more about Mapping data flow performance and tuning guide
- Read more about Pipeline execution and triggers in Azure Data Factory
- Read more about Creating and managing Databricks jobs with multiple tasks

Ron C. L’Esteve is a Data and AI Leader and professional Author residing in Chicago, IL, USA. He is well-known for his impactful books and article publications on Azure Data & AI Architecture, Engineering, and Leadership. Ron holds a Master of Business Administration (M.B.A.) and Master of Science in Corporate Finance (M.S.F.) from Loyola University Chicago. Ron possesses deep technical skills and experience in designing, implementing, leading, and delivering modern Azure Data & AI projects for numerous clients around the world. He is a Motorola Certified Six Sigma Green Belt, a Microsoft Global Challenger, and also holds numerous additional Microsoft, Snowflake, and Databricks professional certifications in Big Data Engineering, Artificial Intelligence, Apache Spark and Data Platform Architecture.
- MSSQLTips Awards: Champion (100+ tips) – 2023 | Author of the Year – 2020-2021 | Rookie of the Year – 2019


Awesome articles Ron.